Wednesday
26
November
 

Method

This map provides an overview of those river valleys within which groundwater flooding might be experienced, to aid county-scale assessments of groundwater flood risk. During a groundwater flooding episode, groundwater flooding may occur outside of the mapped outlines, and will not necessarily occur within any location within the mapped outline.

Hydrographs

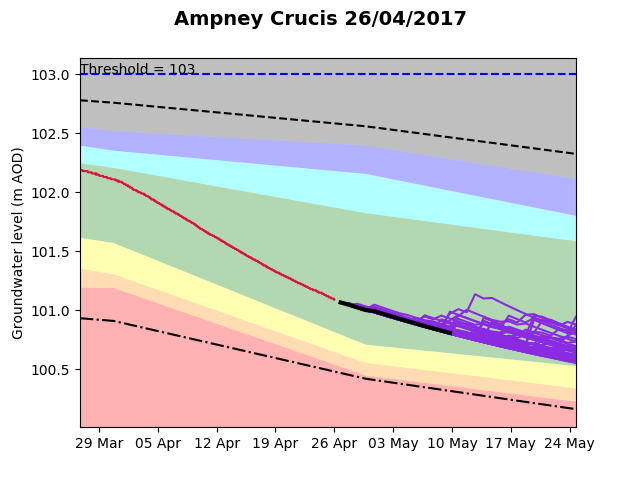
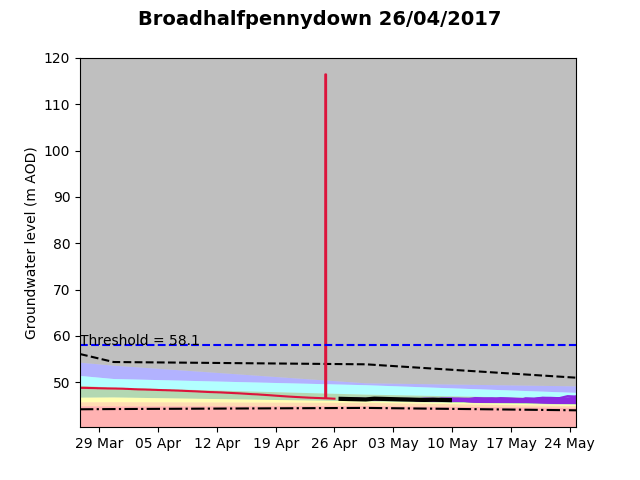
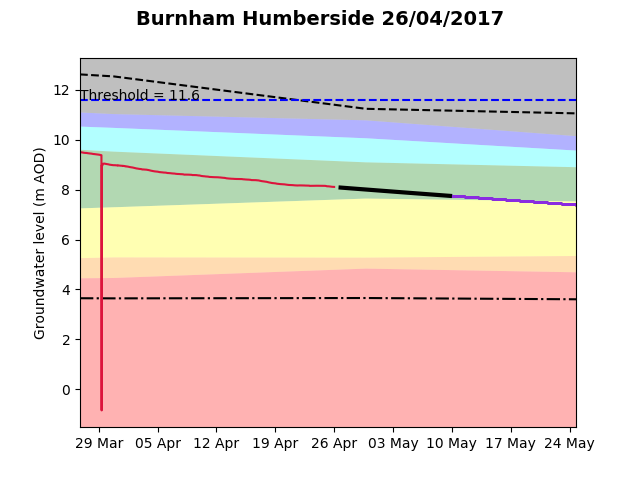
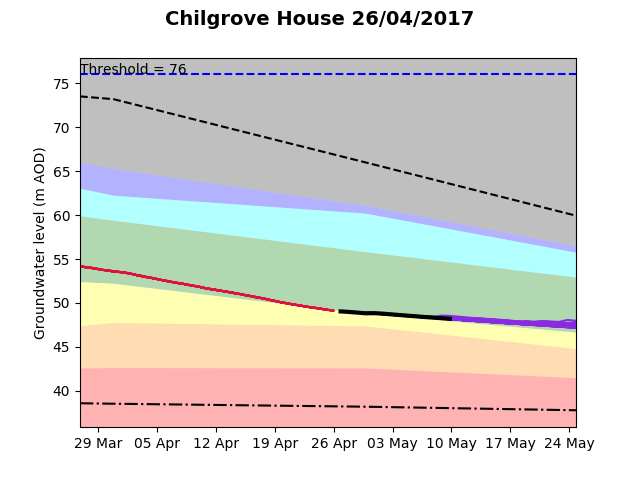
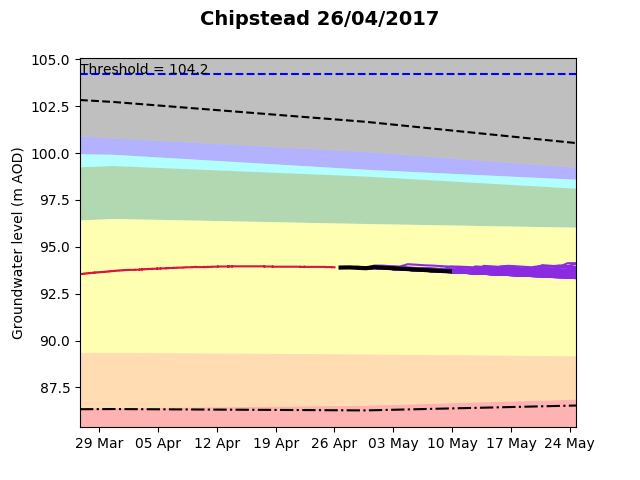
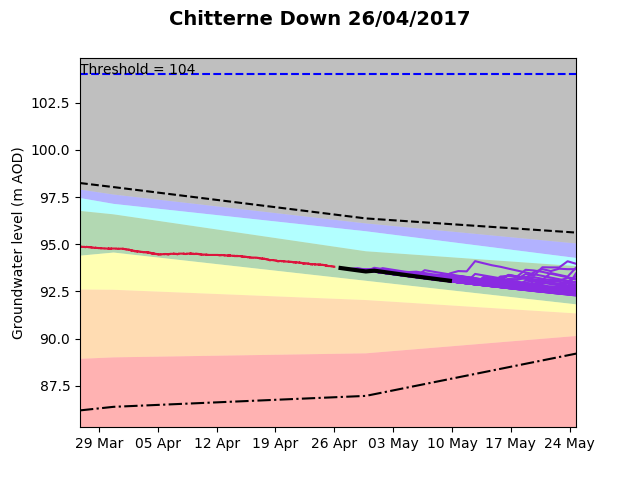
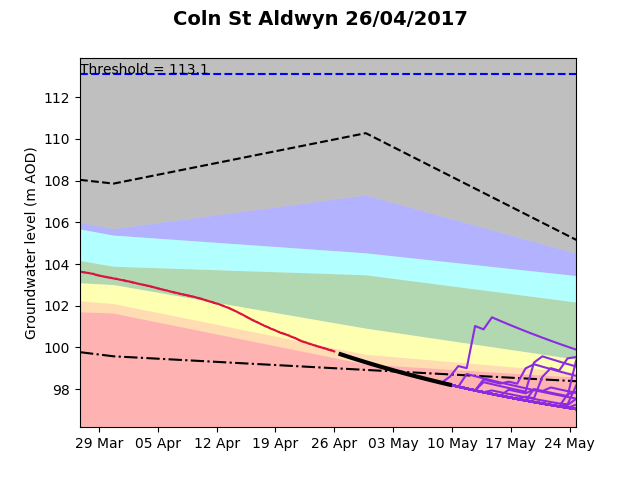
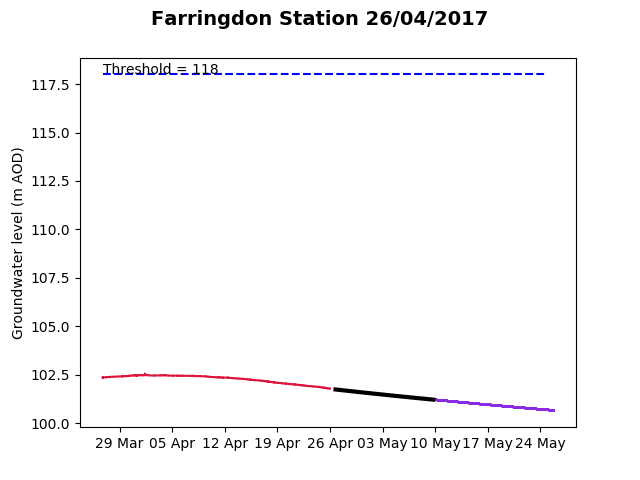
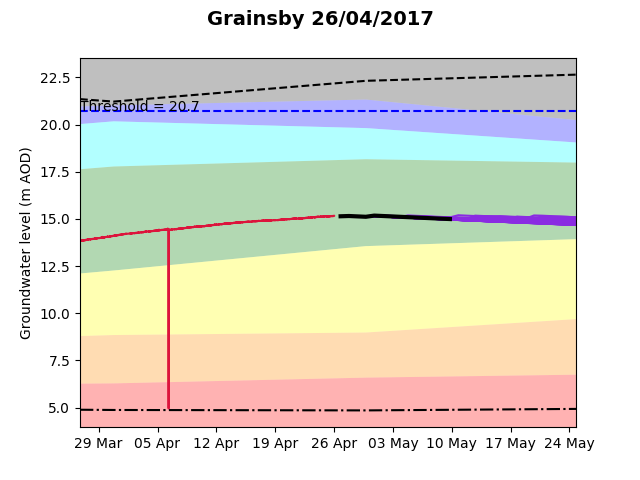
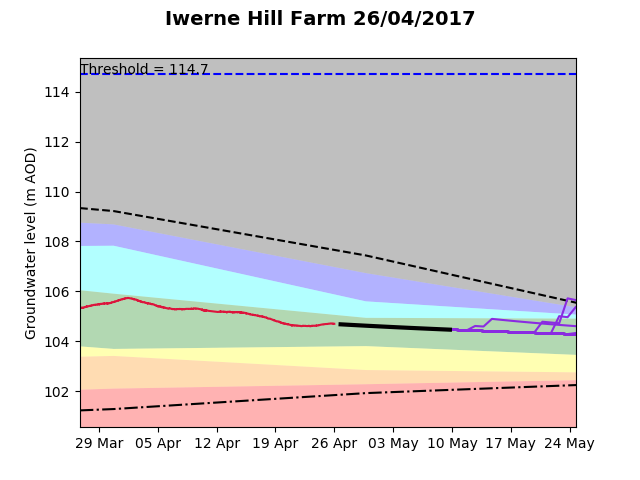
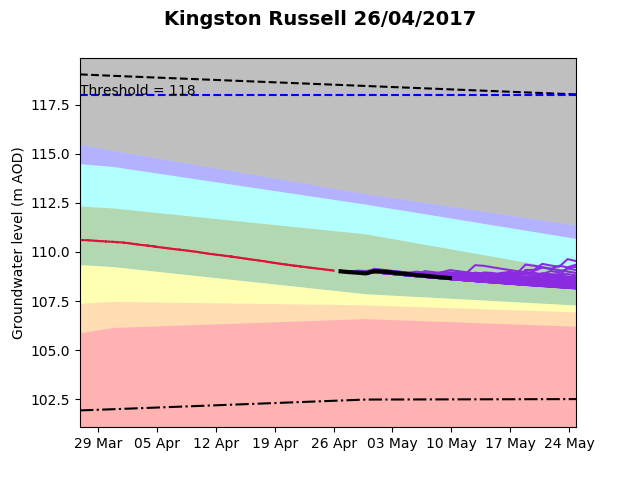
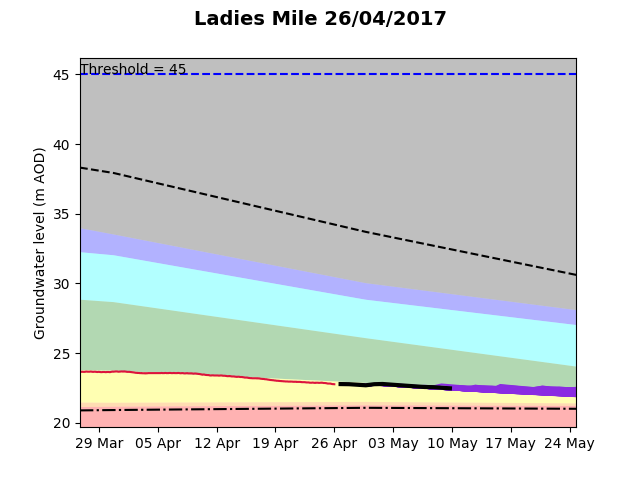
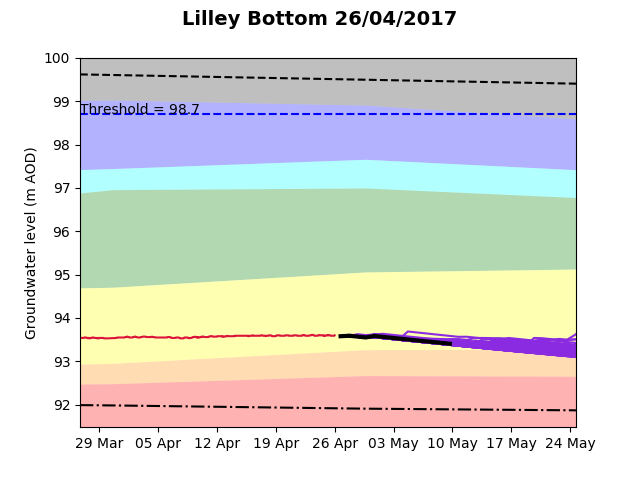
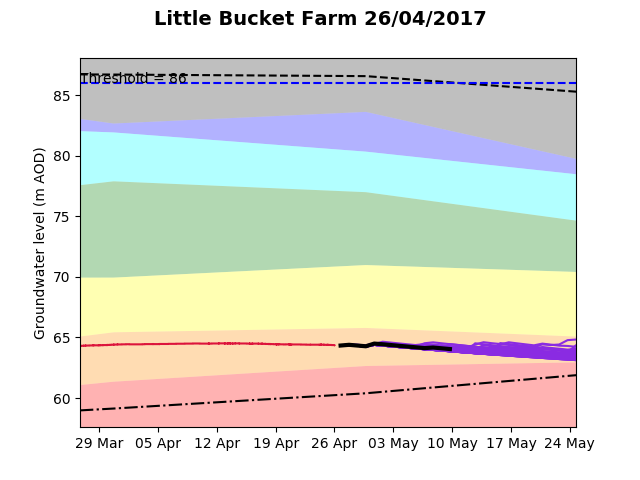
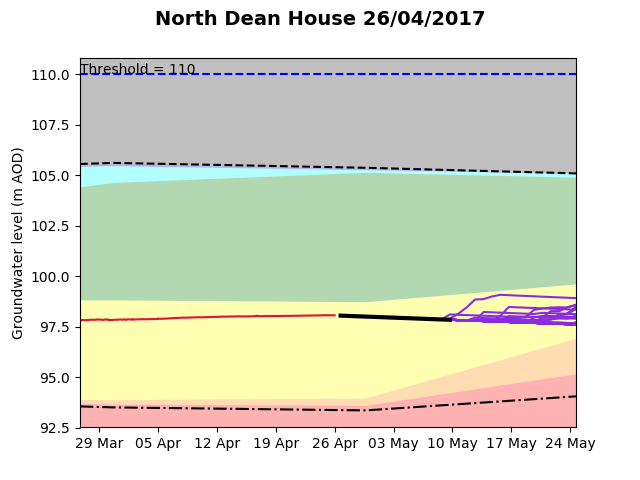
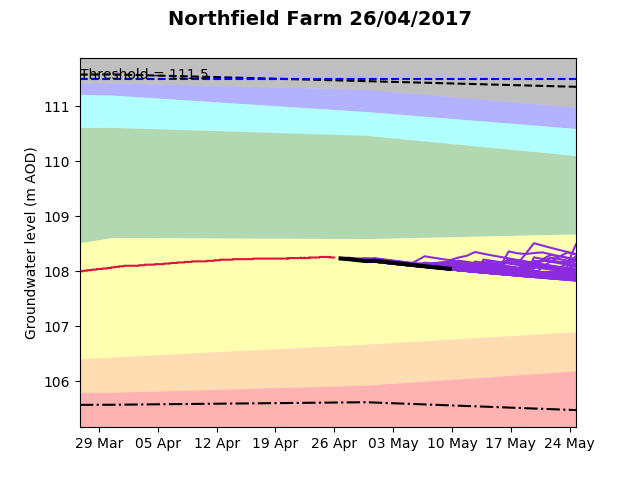
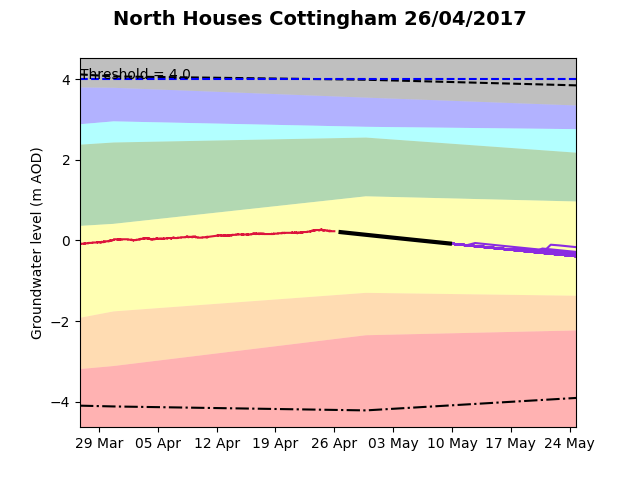
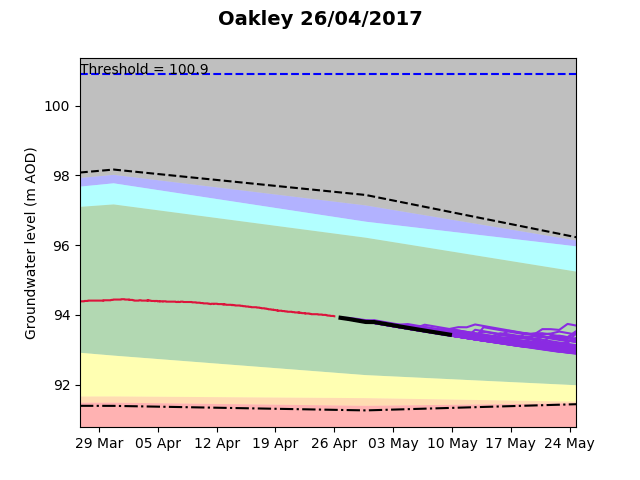
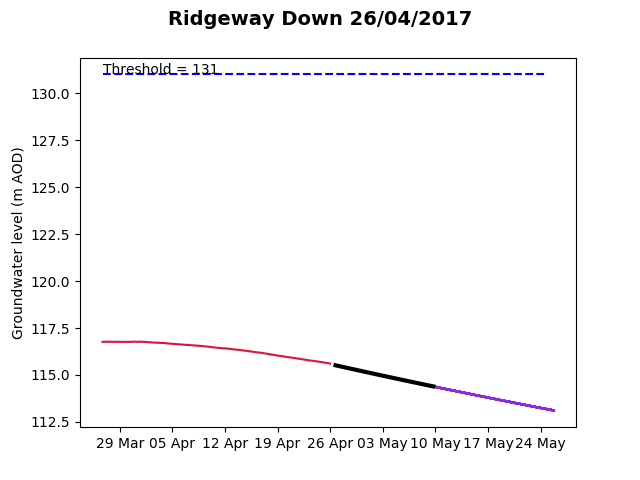
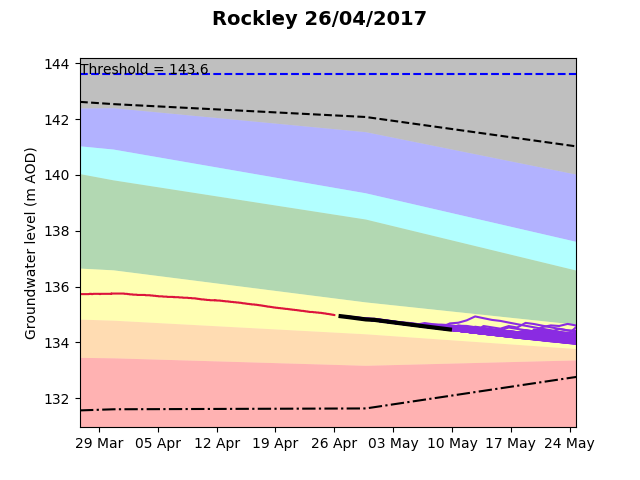
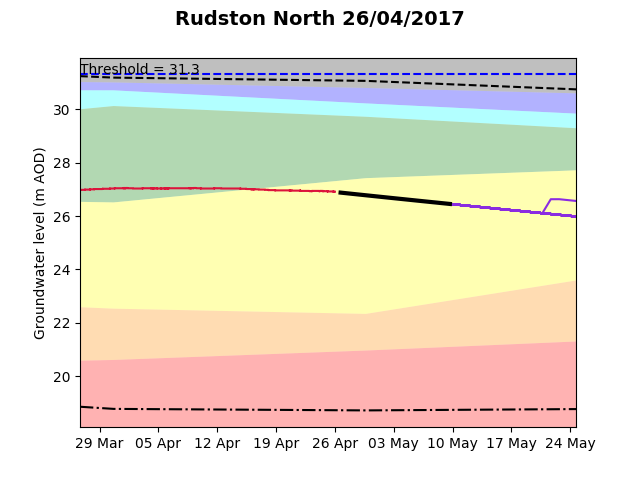
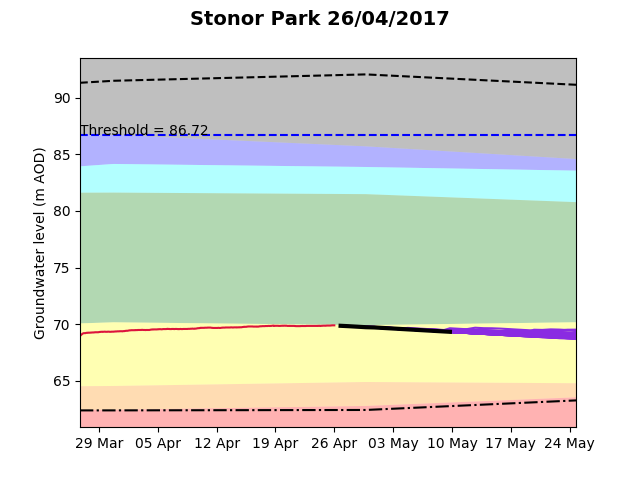
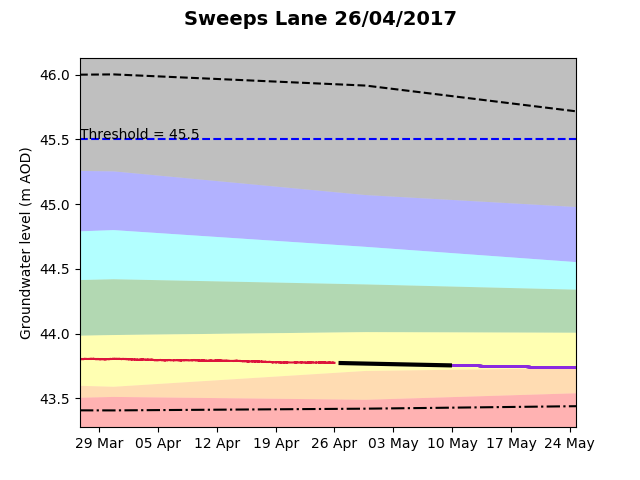
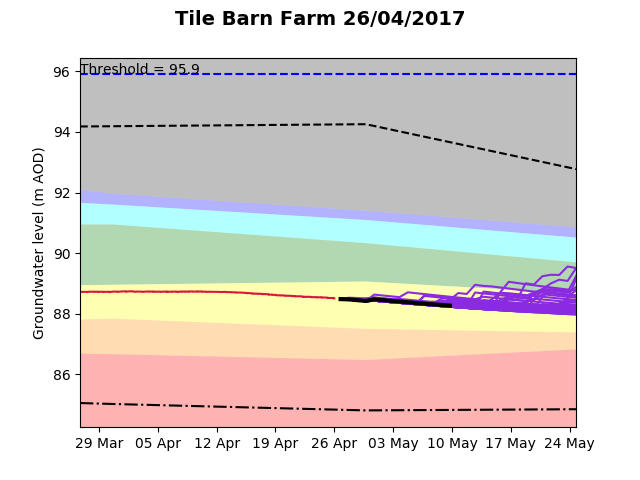
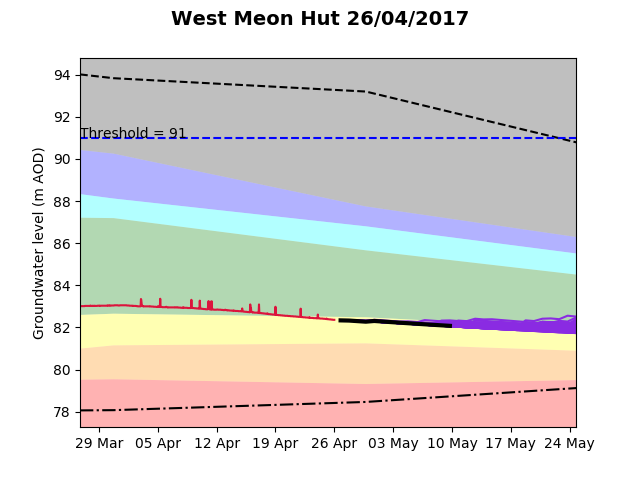
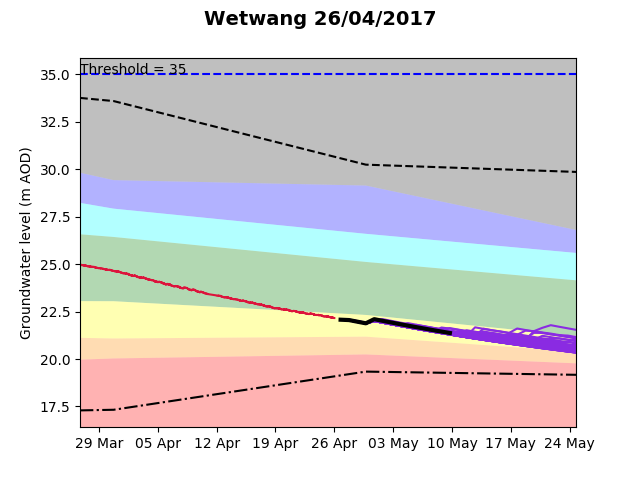
Long term statistical information on groundwater levels at each indicator borehole is displayed in the background of the figures below.

Results 2017-04-26.csv

Ampney Crucis 2017-04-26

Ampney Crucis 2017-04-26

Broadhalfpennydown 2017-04-26

Broadhalfpennydown 2017-04-26

Burnham Humberside 2017-04-26

Burnham Humberside 2017-04-26

Chilgrove House 2017-04-26

Chilgrove House 2017-04-26

Chipstead 2017-04-26

Chipstead 2017-04-26

Chitterne Down 2017-04-26

Chitterne Down 2017-04-26

Coln St Aldwyn 2017-04-26

Coln St Aldwyn 2017-04-26

Farringdon Station 2017-04-26

Farringdon Station 2017-04-26

Grainsby 2017-04-26

Grainsby 2017-04-26

Iwerne Hill Farm 2017-04-26

Iwerne Hill Farm 2017-04-26

Kingston Russell 2017-04-26

Kingston Russell 2017-04-26

Ladies Mile 2017-04-26

Ladies Mile 2017-04-26

Lilley Bottom 2017-04-26

Lilley Bottom 2017-04-26

Little Bucket Farm 2017-04-26

Little Bucket Farm 2017-04-26

North Dean House 2017-04-26

North Dean House 2017-04-26

Northfield Farm 2017-04-26

Northfield Farm 2017-04-26

North Houses Cottingham 2017-04-26

North Houses Cottingham 2017-04-26

Oakley 2017-04-26

Oakley 2017-04-26

Ridgeway Down 2017-04-26

Ridgeway Down 2017-04-26

Rockley 2017-04-26

Rockley 2017-04-26

Rudston North 2017-04-26

Rudston North 2017-04-26

Stonor Park 2017-04-26

Stonor Park 2017-04-26

Sweeps Lane 2017-04-26

Sweeps Lane 2017-04-26

Tile Barn Farm 2017-04-26

Tile Barn Farm 2017-04-26

West Meon Hut 2017-04-26

West Meon Hut 2017-04-26

Wetwang 2017-04-26

Wetwang 2017-04-26

Get in touch