Resource
| Id | hg19/scores/FitCons-i6-merged |
|---|---|
| Type | position_score |
| Version | 0 |
| Summary | fitCons (fitness consequences) score estimates selective pressure on genomic positions. |
| Description |
fitCons score predicts the fraction of genomic positions belonging to a specific function class (defined by epigenomic "fingerprint") that are under selective pressure. Scores range from 0 to 1, with a larger score indicating a higher proportion of nucleic sites of the functional class the genomic position belong to are under selective pressure, therefore more likely to be functional important. Integrated (i6) scores are integrated across three cell types (GM12878, H1-hESC and HUVEC). More details can be found in doi:10.1038/ng.3196. Estimation of the probability that a point mutation at each position in a genome will influence fitness. These fitness consequence (fitCons) scores serve as evolution-based measures of potential genomic function. Our approach is to cluster genomic positions into groups exhibiting distinct “fingerprints” based on high-throughput functional genomic data, then to estimate a probability of fitness consequences for each group from associated patterns of genetic polymorphism and divergence. We have generated fitCons scores for three human cell types based on public data from ENCODE. Compared with conventional conservation scores, fitCons scores show considerably improved prediction power for cis-regulatory elements. In addition, fitCons scores indicate that 4.2-7.5% of nucleotides in the human genome have influenced fitness since the human-chimpanzee divergence, and they suggest that recent evolutionary turnover has had limited impact on the functional content of the genome. |
| Labels |
|
Scores (1)
| ID | Type | Default annotation | Description | Histogram | Range | Summary |
|---|---|---|---|---|---|---|
| fc_i6_score | float |
fitcons_i6_merged |
probability that a point mutation at each position in a genome will influence fitness
Small values desc: less likely to have fitness consequence
Large values desc: more likely to have fitness consequence
|
 |
[0, 0.84] |
|
n counts base pairs; sd is the population standard deviation.
Coverage
| Chromosome | Covered positions | Covered % | Segments |
|---|---|---|---|
| all chromosomes | 2881031138 | 91.84% | 14715245 |
| chr1 | 249250600 | >99.99% | 1382696 |
| chr2 | 243199200 | >99.99% | 1234246 |
| chr3 | 198022400 | >99.99% | 1000314 |
| chr4 | 191154200 | >99.99% | 730271 |
| chr5 | 180915200 | >99.99% | 835862 |
| chr6 | 171115000 | >99.99% | 851778 |
| chr7 | 159138600 | >99.99% | 845856 |
| chr8 | 146364000 | >99.99% | 644015 |
| chr9 | 141213400 | >99.99% | 672588 |
| chr10 | 135534600 | >99.99% | 692044 |
| chr11 | 135006400 | >99.99% | 727009 |
| chr12 | 133851800 | >99.99% | 766879 |
| chr13 | 115169800 | >99.99% | 379165 |
| chr14 | 107349400 | >99.99% | 487494 |
| chr15 | 102531200 | >99.99% | 517842 |
| chr16 | 90354600 | >99.99% | 554673 |
| chr17 | 81195200 | >99.99% | 653807 |
| chr18 | 78077200 | >99.99% | 318816 |
| chr19 | 59128800 | >99.99% | 563387 |
| chr20 | 63025400 | >99.99% | 363765 |
| chr21 | 48129738 | >99.99% | 176186 |
| chr22 | 51304400 | >99.99% | 316552 |
| 71 contigs with no values (256127978 bp) | 0 | 0.00% | 0 |
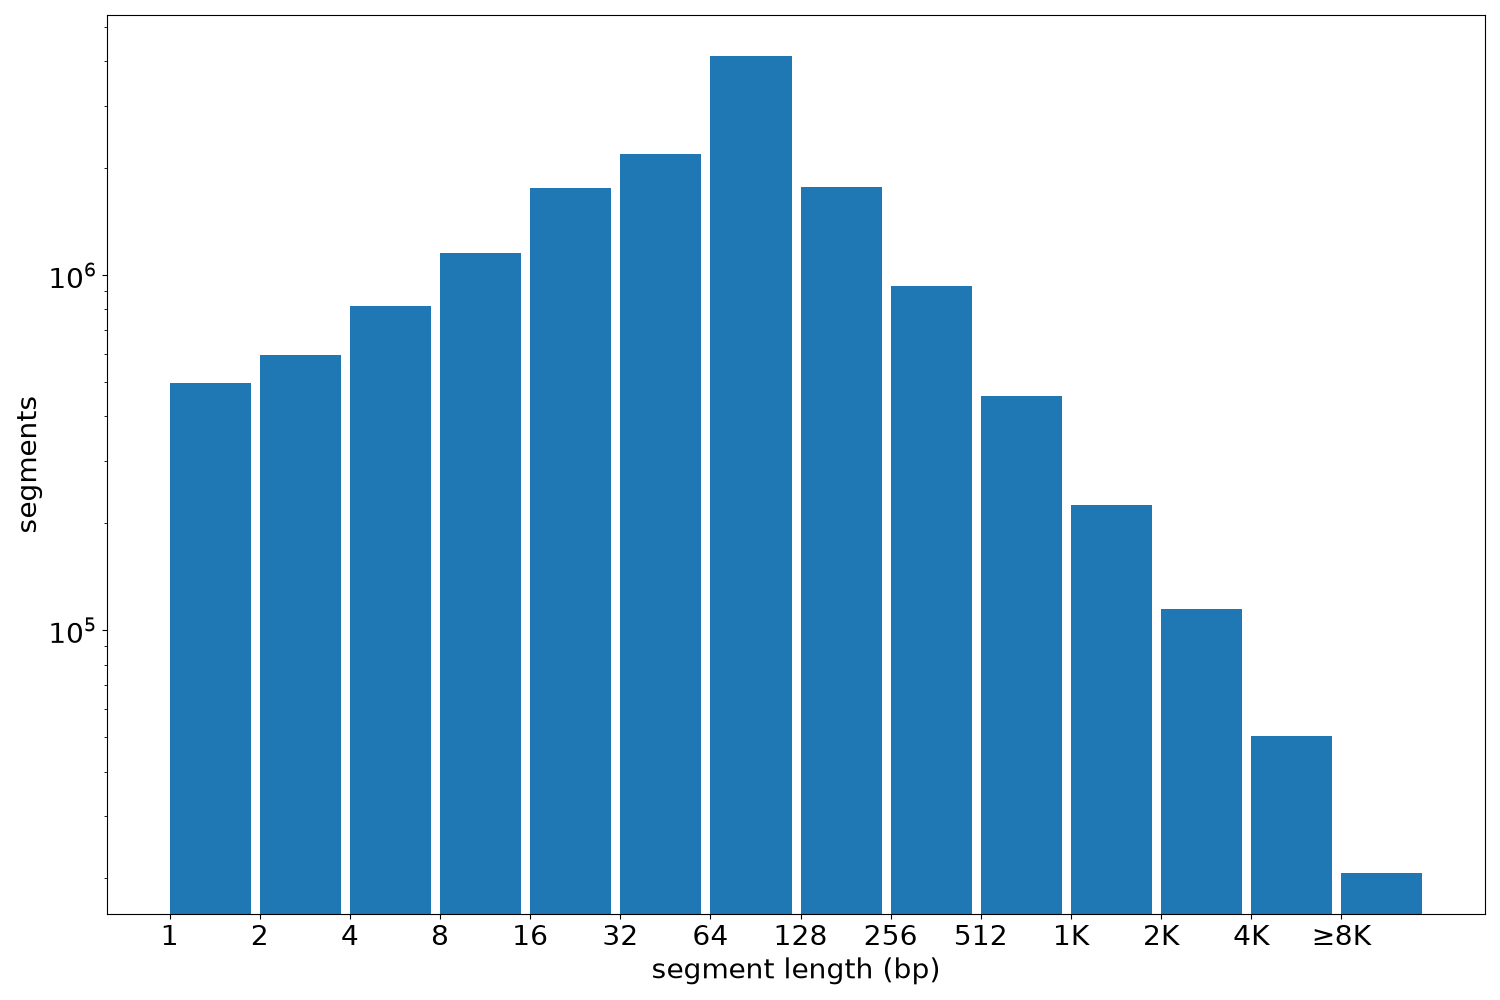
Segment lengths
| segments | min | max | mean | median | |
|---|---|---|---|---|---|
| segments | 14715245 | 1 | 21049565 | 195.79 | 71 |
Files
| Filename | Size | md5 |
|---|---|---|
| fc-i6.bedGraph.gz | 104.7 MB | 6dc0d7ae9e8a8e159a94d6aa9ea61ee8 |
| fc-i6.bedGraph.gz.tbi | 462.71 KB | 5ec4619d3a4ef2680d3f9024837c3ce9 |
| genomic_resource.yaml | 2.49 KB | 9b535fe41d55bbc227405eedf9b253a5 |
| statistics/ |