Resource
| Id | hg38/scores/dbNSFP4.9a |
|---|---|
| Type | allele_score |
| Version | 0 |
| Summary | dbNSFPv4.9a |
| Description |
The dbNSFP is an integrated database of functional annotations from multiple sources for the comprehensive collection of human non-synonymous SNPs (nsSNVs). Its current version includes a total of 84,013,490 nsSNVs and ssSNVs (splice site SNVs). It compiles prediction scores from 32 prediction algorithms (SIFT, SIFT4G, Polyphen2-HDIV, Polyphen2-HVAR, LRT, MutationTaster2, MutationAssessor, FATHMM, MetaSVM, MetaLR, CADD, VEST4, PROVEAN, FATHMM-MKL coding, FATHMM-XF coding, fitCons, LINSIGHT, DANN, GenoCanyon, Eigen, Eigen-PC, M-CAP, REVEL, MutPred, MVP, MPC, PrimateAI, GEOGEN2, BayesDel, ClinPred, LIST-S2, ALoFT), 9 conservation scores (bStatistic, phyloP100way_vertebrate, phyloP30way_mammal, phyloP17way_primate, phastCons100way_vertebrate, phastCons30way_mammal, phastCons17way_primate, GERP++ and SiPhy) and other function annotations. Since version 2.0, dbNSFP is separated into two parts, dbNSFP_variant and dbNSFP_gene. As their names indicate, the former focuses on variant annotations (including prediction scores and conservation scores), and the latter focuses on gene annotations. dbNSFPv4.9a.zip downloaded from https://dbnsfp.s3.amazonaws.com/dbNSFP4.9a.zip on 11/20/2024. dbNSFP4.9a.readme.txt is downloaded from https://usf.app.box.com/s/535gi9e8twzv2wr5j2sxlto3i6tc208d on 11/20/2024. build.sh creates dbNSFPv4.9a.gz and dbNSFPv4.9asamples.gz from the zip file and calls PrepGenRes.py, which 1) reads the score descriptions from dbNSFP4.9a.readme.txt, 2) infers score types using dbNSFPv4.9asamples.gz, 3) prepares the genomic_resource.yaml file. |
| Labels |
|
Scores (454)
| ID | Type | Default annotation | Description | Histogram | Range | Summary |
|---|---|---|---|---|---|---|
| aaref | str |
- |
reference amino acid "." if the variant is a splicing site SNP (2bp on each end of an intron)
|
 |
L, S, E, K, A, G, P, Q, D, V, R, T, I, F, N, H, Y, M, ., C, Other | |
| aaalt | str |
- |
alternative amino acid "." if the variant is a splicing site SNP (2bp on each end of an intron)
|
 |
R, S, L, V, A, T, G, X, P, I, D, N, E, H, Q, K, F, C, Y, ., Other | |
| rs_dbSNP | str |
- |
rs number from dbSNP
|
No histogram: Too many unique values 101 for categorical histogram. |
NO DOMAIN | |
| hg19_chr | str |
- |
chromosome as to hg19, "." means missing
|
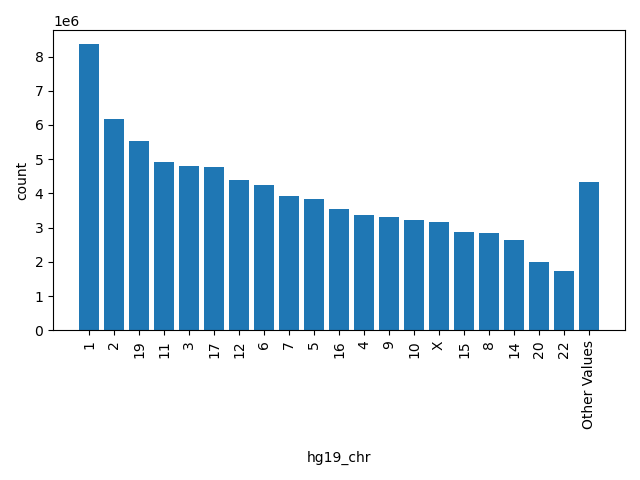 |
1, 2, 19, 11, 3, 17, 12, 6, 7, 5, 16, 4, 9, 10, X, 15, 8, 14, 20, 22, Other | |
| hg19_pos(1-based) | int |
- |
physical position on the chromosome as to hg19 (1-based coordinate). For mitochondrial SNV, this position refers to a YRI sequence (GenBank: AF347015)
|
.png "hg19_pos(1-based)") |
[3.31e+03, 2.49e+08] |
|
| hg18_chr | str |
- |
chromosome as to hg18, "." means missing
|
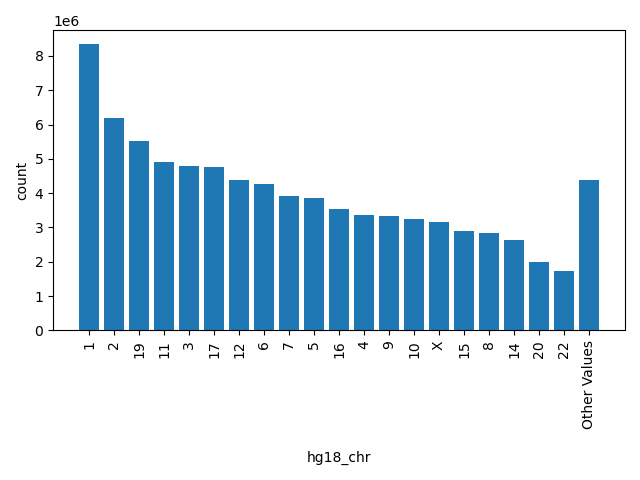 |
1, 2, 19, 11, 3, 17, 12, 6, 7, 5, 16, 4, 9, 10, X, 15, 8, 14, 20, 22, Other | |
| hg18_pos(1-based) | int |
- |
physical position on the chromosome as to hg18 (1-based coordinate) For mitochondrial SNV, this position refers to a YRI sequence (GenBank: AF347015)
|
.png "hg18_pos(1-based)") |
[3.31e+03, 2.47e+08] |
|
| aapos | str |
- |
amino acid position as to the protein. "-1" if the variant is a splicing site SNP (2bp on each end of an intron). Multiple entries separated by ";", corresponding to Ensembl_proteinid
|
No histogram: Too many unique values 101 for categorical histogram. |
NO DOMAIN | |
| genename | str |
- |
gene name; if the nsSNV can be assigned to multiple genes, gene names are separated by ";"
|
No histogram: Too many unique values 101 for categorical histogram. |
NO DOMAIN | |
| Ensembl_geneid | str |
- |
Ensembl gene id
|
No histogram: Too many unique values 101 for categorical histogram. |
NO DOMAIN | |
| Ensembl_transcriptid | str |
- |
Ensembl transcript ids (Multiple entries separated by ";")
|
No histogram: Too many unique values 101 for categorical histogram. |
NO DOMAIN | |
| Ensembl_proteinid | str |
- |
Ensembl protein ids Multiple entries separated by ";", corresponding to Ensembl_transcriptids
|
No histogram: Too many unique values 101 for categorical histogram. |
NO DOMAIN | |
| Uniprot_acc | str |
- |
Uniprot accession number matching the Ensembl_proteinid Multiple entries separated by ";".
|
No histogram: Too many unique values 101 for categorical histogram. |
NO DOMAIN | |
| Uniprot_entry | str |
- |
Uniprot entry ID matching the Ensembl_proteinid Multiple entries separated by ";".
|
No histogram: Too many unique values 101 for categorical histogram. |
NO DOMAIN | |
| HGVSc_ANNOVAR | str |
- |
HGVS coding variant presentation from ANNOVAR Multiple entries separated by ";", corresponds to Ensembl_transcriptid
|
No histogram: Too many unique values 101 for categorical histogram. |
NO DOMAIN | |
| HGVSp_ANNOVAR | str |
- |
HGVS protein variant presentation from ANNOVAR Multiple entries separated by ";", corresponds to Ensembl_proteinid
|
No histogram: Too many unique values 101 for categorical histogram. |
NO DOMAIN | |
| HGVSc_snpEff | str |
- |
HGVS coding variant presentation from snpEff Multiple entries separated by ";", corresponds to Ensembl_transcriptid
|
No histogram: Too many unique values 101 for categorical histogram. |
NO DOMAIN | |
| HGVSp_snpEff | str |
- |
HGVS protein variant presentation from snpEff Multiple entries separated by ";", corresponds to Ensembl_proteinid
|
No histogram: Too many unique values 101 for categorical histogram. |
NO DOMAIN | |
| HGVSc_VEP | str |
- |
HGVS coding variant presentation from VEP Multiple entries separated by ";", corresponds to Ensembl_transcriptid
|
No histogram: Too many unique values 101 for categorical histogram. |
NO DOMAIN | |
| HGVSp_VEP | str |
- |
HGVS protein variant presentation from VEP Multiple entries separated by ";", corresponds to Ensembl_proteinid
|
No histogram: Too many unique values 101 for categorical histogram. |
NO DOMAIN | |
| APPRIS | str |
- |
APPRIS annotation for the transcripts matching Ensembl_transcriptid Multiple entries separated by ";". Potential values: principal1, principal2, principal3, principal4, principal5, alternative1, alternative2. See https://useast.ensembl.org/info/genome/genebuild/transcript_quality_tags.html
|
No histogram: Too many unique values 101 for categorical histogram. |
NO DOMAIN | |
| GENCODE_basic | str |
- |
Whether the transcript belongs to GENCODE_basic (5' and 3' complete transcripts). Multiple entries separated by ";", matching Ensembl_transcriptid. See https://useast.ensembl.org/info/genome/genebuild/transcript_quality_tags.html
|
No histogram: Too many unique values 101 for categorical histogram. |
NO DOMAIN | |
| TSL | str |
- |
Transcript Support Level. Multiple entries separated by ";", matching Ensembl_transcriptid. Potential values: 1 to 5, NA. See https://useast.ensembl.org/info/genome/genebuild/transcript_quality_tags.html
|
No histogram: Too many unique values 101 for categorical histogram. |
NO DOMAIN | |
| VEP_canonical | str |
- |
canonical transcript used in Ensembl. Multiple entries separated by ";", matching Ensembl_transcriptid. See https://useast.ensembl.org/Help/Glossary?id=521
|
No histogram: Can not merge categorical histograms; too many unique values 130 |
NO DOMAIN | |
| cds_strand | str |
- |
coding sequence (CDS) strand (+ or -)
|
No histogram: Can not merge categorical histograms; too many unique values 101 |
NO DOMAIN | |
| refcodon | str |
- |
reference codon
|
No histogram: Too many unique values 101 for categorical histogram. |
NO DOMAIN | |
| codonpos | str |
- |
position on the codon (1, 2 or 3)
|
No histogram: Empty histogram for codonpos in a region: Too many unique values 101 for categorical histogram. |
NO DOMAIN | |
| codon_degeneracy | str |
- |
degenerate type (0, 2 or 3)
|
No histogram: Empty histogram for codon_degeneracy in a region: Too many unique values 101 for categorical histogram. |
NO DOMAIN | |
| Ancestral_allele | str |
- |
ancestral allele based on 8 primates EPO. Ancestral alleles by Ensembl 84. The following comes from its original README file: ACTG - high-confidence call, ancestral state supported by the other two sequences actg - low-confidence call, ancestral state supported by one sequence only N - failure, the ancestral state is not supported by any other sequence - - the extant species contains an insertion at this position . - no coverage in the alignment
|
 |
C, G, A, T, ., c, g, -, t, a, N | |
| AltaiNeandertal | str |
- |
genotype of a deep sequenced Altai Neanderthal
|
 |
C/C, G/G, A/A, T/T, ./., C/T, A/G, C/G, G/T, A/C, A/T | |
| Denisova | str |
- |
genotype of a deep sequenced Denisova
|
 |
C/C, G/G, A/A, T/T, ./., C/T, A/G, C/G, A/C, G/T, A/T | |
| VindijiaNeandertal | str |
- |
genotype of a deep sequenced Vindijia Neandertal
|
 |
C/C, G/G, A/A, T/T, ./., C/T, A/G, C/G, G/T, A/C, A/T | |
| ChagyrskayaNeandertal | str |
- |
genotype of a deep sequenced Chagyrskaya Neandertal
|
 |
C/C, G/G, A/A, T/T, ./., C/T, A/G, C/G, G/T, A/C, A/T | |
| SIFT_score | str |
- |
SIFT score (SIFTori). Scores range from 0 to 1. The smaller the score the more likely the SNP has damaging effect. Multiple scores separated by ";", corresponding to Ensembl_proteinid.
|
No histogram: Too many unique values 101 for categorical histogram. |
NO DOMAIN | |
| SIFT_converted_rankscore | float |
- |
SIFTori scores were first converted to SIFTnew=1-SIFTori, then ranked among all SIFTnew scores in dbNSFP. The rankscore is the ratio of the rank the SIFTnew score over the total number of SIFTnew scores in dbNSFP. If there are multiple scores, only the most damaging (largest) rankscore is presented. The rankscores range from 0.00964 to 0.91255.
|
 |
[0.00964, 0.913] |
|
| SIFT_pred | str |
- |
If SIFTori is smaller than 0.05 (rankscore>0.39575) the corresponding nsSNV is predicted as "D(amaging)"; otherwise it is predicted as "T(olerated)". Multiple predictions separated by ";"
|
No histogram: Too many unique values 101 for categorical histogram. |
NO DOMAIN | |
| SIFT4G_score | str |
- |
SIFT 4G score (SIFT4G). Scores range from 0 to 1. The smaller the score the more likely the SNP has damaging effect. Multiple scores separated by ",", corresponding to Ensembl_transcriptid
|
No histogram: Too many unique values 101 for categorical histogram. |
NO DOMAIN | |
| SIFT4G_converted_rankscore | float |
- |
SIFT4G scores were first converted to SIFT4Gnew=1-SIFT4G, then ranked among all SIFT4Gnew scores in dbNSFP. The rankscore is the ratio of the rank the SIFT4Gnew score over the total number of SIFT4Gnew scores in dbNSFP. If there are multiple scores, only the most damaging (largest) rankscore is presented.
|
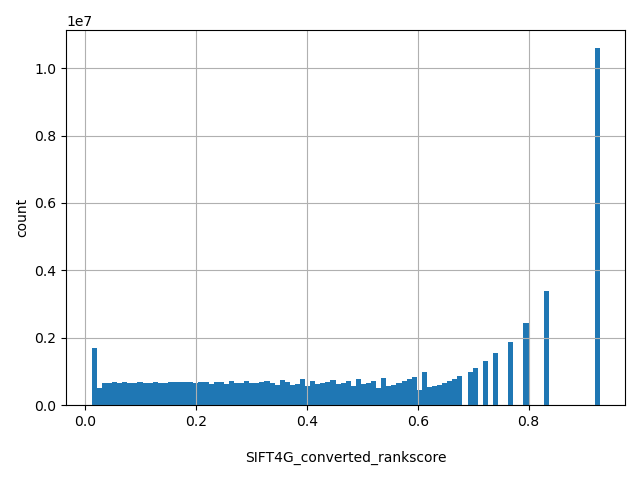 |
[0.0115, 0.928] |
|
| SIFT4G_pred | str |
- |
If SIFT4G is < 0.05 the corresponding nsSNV is predicted as "D(amaging)"; otherwise it is predicted as "T(olerated)". Multiple scores separated by ",", corresponding to Ensembl_transcriptid
|
No histogram: Too many unique values 101 for categorical histogram. |
NO DOMAIN | |
| Polyphen2_HDIV_score | str |
- |
Polyphen2 score based on HumDiv, i.e. hdiv_prob. The score ranges from 0 to 1. Multiple entries separated by ";", corresponding to Uniprot_acc.
|
No histogram: Too many unique values 101 for categorical histogram. |
NO DOMAIN | |
| Polyphen2_HDIV_rankscore | float |
- |
Polyphen2 HDIV scores were first ranked among all HDIV scores in dbNSFP. The rankscore is the ratio of the rank the score over the total number of the scores in dbNSFP. If there are multiple scores, only the most damaging (largest) rankscore is presented. The scores range from 0.03061 to 0.91137.
|
 |
[0.0295, 0.906] |
|
| Polyphen2_HDIV_pred | str |
- |
Polyphen2 prediction based on HumDiv, "D" ("probably damaging", HDIV score in [0.957,1] or rankscore in [0.55859,0.91137]), "P" ("possibly damaging", HDIV score in [0.454,0.956] or rankscore in [0.37043,0.55681]) and "B" ("benign", HDIV score in [0,0.452] or rankscore in [0.03061,0.36974]). Score cutoff for binary classification is 0.5 for HDIV score or 0.38028 for rankscore, i.e. the prediction is "neutral" if the HDIV score is smaller than 0.5 (rankscore is smaller than 0.38028), and "deleterious" if the HDIV score is larger than 0.5 (rankscore is larger than
|
No histogram: Too many unique values 101 for categorical histogram. |
NO DOMAIN | |
| Polyphen2_HVAR_score | str |
- |
Polyphen2 score based on HumVar, i.e. hvar_prob. The score ranges from 0 to 1. Multiple entries separated by ";", corresponding to Uniprot_acc.
|
No histogram: Too many unique values 101 for categorical histogram. |
NO DOMAIN | |
| Polyphen2_HVAR_rankscore | float |
- |
Polyphen2 HVAR scores were first ranked among all HVAR scores in dbNSFP. The rankscore is the ratio of the rank the score over the total number of the scores in dbNSFP. If there are multiple scores, only the most damaging (largest) rankscore is presented. The scores range from 0.01493 to 0.97581.
|
 |
[0.0139, 0.974] |
|
| Polyphen2_HVAR_pred | str |
- |
Polyphen2 prediction based on HumVar, "D" ("probably damaging", HVAR score in [0.909,1] or rankscore in [0.65694,0.97581]), "P" ("possibly damaging", HVAR in [0.447,0.908] or rankscore in [0.47121,0.65622]) and "B" ("benign", HVAR score in [0,0.446] or rankscore in [0.01493,0.47076]). Score cutoff for binary classification is 0.5 for HVAR score or 0.48762 for rankscore, i.e. the prediction is "neutral" if the HVAR score is smaller than 0.5 (rankscore is smaller than
|
No histogram: Too many unique values 101 for categorical histogram. |
NO DOMAIN | |
| LRT_score | float |
- |
The original LRT two-sided p-value (LRTori), ranges from 0 to 1.
|
 |
[0, 1] |
|
| LRT_converted_rankscore | float |
- |
LRTori scores were first converted as LRTnew=1-LRTori*0.5 if Omega<1, or LRTnew=LRTori*0.5 if Omega>=1. Then LRTnew scores were ranked among all LRTnew scores in dbNSFP. The rankscore is the ratio of the rank over the total number of the scores in dbNSFP. The scores range from 0.00162 to 0.8433.
|
 |
[0.00162, 0.843] |
|
| LRT_pred | str |
- |
LRT prediction, D(eleterious), N(eutral) or U(nknown), which is not solely determined by the score.
|
 |
D, N, ., U | |
| LRT_Omega | float |
- |
estimated nonsynonymous-to-synonymous-rate ratio (Omega, reported by LRT)
|
 |
[0, 7.78e+03] |
|
| MutationTaster_score | str |
- |
MutationTaster p-value (MTori), ranges from 0 to 1. Multiple scores are separated by ";". Information on corresponding transcript(s) can be found by querying http://www.mutationtaster.org/ChrPos.html
|
No histogram: Too many unique values 101 for categorical histogram. |
NO DOMAIN | |
| MutationTaster_converted_rankscore | float |
- |
The MTori scores were first converted. If the prediction is "A" or "D" MTnew=MTori; if the prediction is "N" or "P", MTnew=1-MTori. Then MTnew scores were ranked among all MTnew scores in dbNSFP. If there are multiple scores of a SNV, only the largest MTnew was used in ranking. The rankscore is the ratio of the rank of the score over the total number of MTnew scores in dbNSFP. The scores range from 0.08979 to 0.81001.
|
 |
[0.0897, 0.81] |
|
| MutationTaster_pred | str |
- |
MutationTaster prediction, "A" ("disease_causing_automatic"), "D" ("disease_causing"), "N" ("polymorphism") or "P" ("polymorphism_automatic"). The score cutoff between "D" and "N" is 0.5 for MTnew and 0.31733 for the rankscore.
|
No histogram: Too many unique values 101 for categorical histogram. |
NO DOMAIN | |
| MutationTaster_model | str |
- |
MutationTaster prediction models.
|
No histogram: Too many unique values 101 for categorical histogram. |
NO DOMAIN | |
| MutationTaster_AAE | str |
- |
MutationTaster predicted amino acid change.
|
No histogram: Too many unique values 101 for categorical histogram. |
NO DOMAIN | |
| MutationAssessor_score | str |
- |
MutationAssessor functional impact combined score (MAori). The score ranges from -5.17 to 6.49 in dbNSFP. Multiple entries are separated by ";", corresponding to Uniprot_entry.
|
No histogram: Too many unique values 101 for categorical histogram. |
NO DOMAIN | |
| MutationAssessor_rankscore | float |
- |
MAori scores were ranked among all MAori scores in dbNSFP. The rankscore is the ratio of the rank of the score over the total number of MAori scores in dbNSFP. The scores range from 0 to 1.
|
 |
[0, 1] |
|
| MutationAssessor_pred | str |
- |
MutationAssessor's functional impact of a variant - predicted functional, i.e. high ("H") or medium ("M"), or predicted non-functional, i.e. low ("L") or neutral ("N"). The MAori score cutoffs between "H" and "M", "M" and "L", and "L" and "N", are 3.5, 1.935 and 0.8, respectively. The rankscore cutoffs between "H" and "M", "M" and "L", and "L" and "N", are 0.9307, 0.52043 and 0.19675, respectively.
|
No histogram: Too many unique values 101 for categorical histogram. |
NO DOMAIN | |
| FATHMM_score | str |
- |
FATHMM default score (weighted for human inherited-disease mutations with Disease Ontology) (FATHMMori). Scores range from -16.13 to 10.64. The smaller the score the more likely the SNP has damaging effect. Multiple scores separated by ";", corresponding to Ensembl_proteinid.
|
No histogram: Too many unique values 101 for categorical histogram. |
NO DOMAIN | |
| FATHMM_converted_rankscore | float |
- |
FATHMMori scores were first converted to FATHMMnew=1-(FATHMMori+16.13)/26.77, then ranked among all FATHMMnew scores in dbNSFP. The rankscore is the ratio of the rank of the score over the total number of FATHMMnew scores in dbNSFP. If there are multiple scores, only the most damaging (largest) rankscore is presented. The scores range from 0 to 1.
|
 |
[0, 1] |
|
| FATHMM_pred | str |
- |
If a FATHMMori score is <=-1.5 (or rankscore >=0.81332) the corresponding nsSNV is predicted as "D(AMAGING)"; otherwise it is predicted as "T(OLERATED)". Multiple predictions separated by ";", corresponding to Ensembl_proteinid.
|
No histogram: Too many unique values 101 for categorical histogram. |
NO DOMAIN | |
| PROVEAN_score | str |
- |
PROVEAN score (PROVEANori). Scores range from -14 to 14. The smaller the score the more likely the SNP has damaging effect. Multiple scores separated by ";", corresponding to Ensembl_proteinid.
|
No histogram: Too many unique values 101 for categorical histogram. |
NO DOMAIN | |
| PROVEAN_converted_rankscore | float |
- |
PROVEANori were first converted to PROVEANnew=1-(PROVEANori+14)/28, then ranked among all PROVEANnew scores in dbNSFP. The rankscore is the ratio of the rank the PROVEANnew score over the total number of PROVEANnew scores in dbNSFP. If there are multiple scores, only the most damaging (largest) rankscore is presented. The scores range from 0 to 1.
|
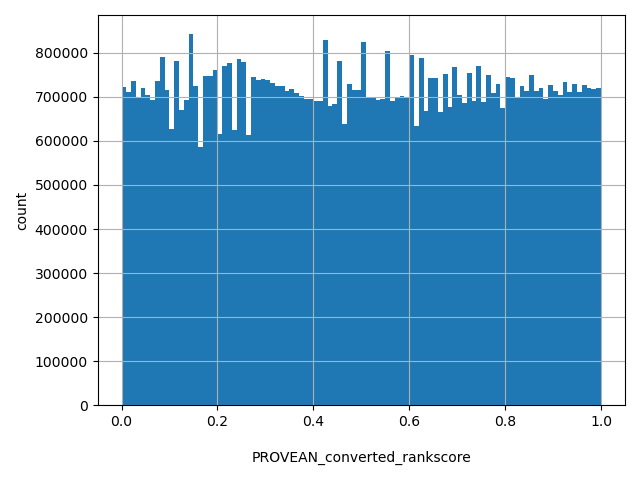 |
[0, 1] |
|
| PROVEAN_pred | str |
- |
If PROVEANori <= -2.5 (rankscore>=0.54382) the corresponding nsSNV is predicted as "D(amaging)"; otherwise it is predicted as "N(eutral)". Multiple predictions separated by ";", corresponding to Ensembl_proteinid.
|
No histogram: Too many unique values 101 for categorical histogram. |
NO DOMAIN | |
| VEST4_score | str |
- |
VEST 4.0 score. Score ranges from 0 to 1. The larger the score the more likely the mutation may cause functional change. Multiple scores separated by ";", corresponding to Ensembl_transcriptid. Please note this score is free for non-commercial use. For more details please refer to http://wiki.chasmsoftware.org/index.php/SoftwareLicense. Commercial users should contact the Johns Hopkins Technology Transfer office.
|
No histogram: Too many unique values 101 for categorical histogram. |
NO DOMAIN | |
| VEST4_rankscore | float |
- |
VEST4 scores were ranked among all VEST4 scores in dbNSFP. The rankscore is the ratio of the rank of the score over the total number of VEST4 scores in dbNSFP. In case there are multiple scores for the same variant, the largest score (most damaging) is presented. The scores range from 0 to 1. Please note VEST score is free for non-commercial use. For more details please refer to http://wiki.chasmsoftware.org/index.php/SoftwareLicense. Commercial users should contact the Johns Hopkins Technology Transfer office.
|
 |
[1e-05, 1] |
|
| MetaSVM_score | float |
- |
Our support vector machine (SVM) based ensemble prediction score, which incorporated 10 scores (SIFT, PolyPhen-2 HDIV, PolyPhen-2 HVAR, GERP++, MutationTaster, Mutation Assessor, FATHMM, LRT, SiPhy, PhyloP) and the maximum frequency observed in the 1000 genomes populations. Larger value means the SNV is more likely to be damaging. Scores range from -2 to 3 in dbNSFP.
|
 |
[-2.01, 3.04] |
|
| MetaSVM_rankscore | float |
- |
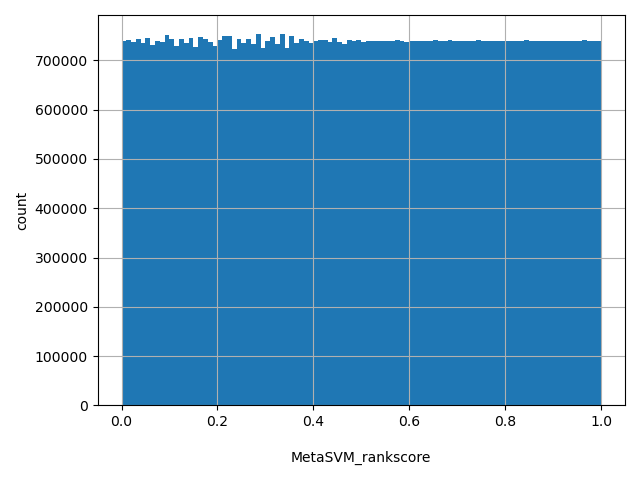
MetaSVM scores were ranked among all MetaSVM scores in dbNSFP. The rankscore is the ratio of the rank of the score over the total number of MetaSVM scores in dbNSFP. The scores range from 0 to 1.
|
 |
[0, 1] |
|
| MetaSVM_pred | str |
- |
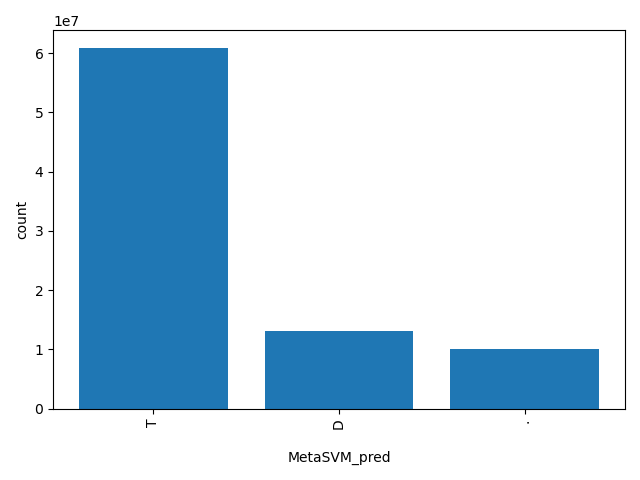
Prediction of our SVM based ensemble prediction score,"T(olerated)" or "D(amaging)". The score cutoff between "D" and "T" is 0. The rankscore cutoff between "D" and "T" is 0.82257.
|
 |
T, D, . | |
| MetaLR_score | float |
- |
Our logistic regression (LR) based ensemble prediction score, which incorporated 10 scores (SIFT, PolyPhen-2 HDIV, PolyPhen-2 HVAR, GERP++, MutationTaster, Mutation Assessor, FATHMM, LRT, SiPhy, PhyloP) and the maximum frequency observed in the 1000 genomes populations. Larger value means the SNV is more likely to be damaging. Scores range from 0 to 1.
|
 |
[0, 1] |
|
| MetaLR_rankscore | float |
- |
MetaLR scores were ranked among all MetaLR scores in dbNSFP. The rankscore is the ratio of the rank of the score over the total number of MetaLR scores in dbNSFP. The scores range from 0 to 1.
|
 |
[0.00011, 1] |
|
| MetaLR_pred | str |
- |
Prediction of our MetaLR based ensemble prediction score,"T(olerated)" or "D(amaging)". The score cutoff between "D" and "T" is 0.5. The rankscore cutoff between "D" and "T" is 0.81101.
|
 |
T, D, . | |
| Reliability_index | int |
- |
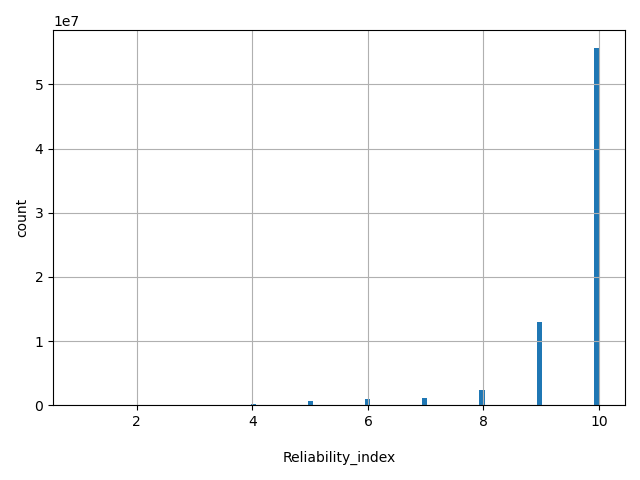
Number of observed component scores (except the maximum frequency in the 1000 genomes populations) for MetaSVM and MetaLR. Ranges from 1 to 10. As MetaSVM and MetaLR scores are calculated based on imputed data, the less missing component scores, the higher the reliability of the scores and predictions.
|
 |
[1, 10] |
|
| MetaRNN_score | str |
- |
Our recurrent neural network (RNN) based ensemble prediction score, which incorporated 16 scores (SIFT, Polyphen2_HDIV, Polyphen2_HVAR, MutationAssessor, PROVEAN, VEST4, M-CAP, REVEL, MutPred, MVP, PrimateAI, DEOGEN2, CADD, fathmm-XF, Eigen and GenoCanyon),
|
No histogram: Too many unique values 101 for categorical histogram. |
NO DOMAIN | |
| MetaRNN_rankscore | float |
- |
MetaRNN scores were ranked among all MetaRNN scores in dbNSFP. The rankscore is the ratio of the rank of the score over the total number of MetaRNN scores in dbNSFP. The scores range from 0 to 1.
|
 |
[3e-05, 1] |
|
| MetaRNN_pred | str |
- |
Prediction of our MetaRNN based ensemble prediction score,"T(olerated)" or "D(amaging)". The score cutoff between "D" and "T" is 0.5. The rankscore cutoff between "D" and "T" is 0.6149.
|
No histogram: Too many unique values 101 for categorical histogram. |
NO DOMAIN | |
| M-CAP_score | float |
- |
M-CAP is hybrid ensemble score (details in DOI: 10.1038/ng.3703). Scores range from 0 to 1. The larger the score the more likely the SNP has damaging effect.
|
 |
[6.7e-05, 1] |
|
| M-CAP_rankscore | float |
- |
M-CAP scores were ranked among all M-CAP scores in dbNSFP. The rankscore is the ratio of the rank of the score over the total number of M-CAP scores in dbNSFP.
|
 |
[0, 1] |
|
| M-CAP_pred | str |
- |
Prediction of M-CAP score based on the authors' recommendation, "T(olerated)" or "D(amaging)". The score cutoff between "D" and "T" is 0.025.
|
 |
D, T, . | |
| REVEL_score | str |
- |
REVEL is an ensemble score based on 13 individual scores for predicting the pathogenicity of missense variants. Scores range from 0 to 1. The larger the score the more likely the SNP has damaging effect. "REVEL scores are freely available for non-commercial use. For other uses, please contact Weiva Sieh" (weiva.sieh@mssm.edu) Multiple entries are separated by ";", corresponding to Ensembl_transcriptid.
|
No histogram: Too many unique values 101 for categorical histogram. |
NO DOMAIN | |
| REVEL_rankscore | float |
- |
REVEL scores were ranked among all REVEL scores in dbNSFP. The rankscore is the ratio of the rank of the score over the total number of REVEL scores in dbNSFP.
|
 |
[3e-05, 1] |
|
| MutPred_score | str |
- |
General MutPred score. Scores range from 0 to 1. The larger the score the more likely the SNP has damaging effect.
|
No histogram: Too many unique values 101 for categorical histogram. |
NO DOMAIN | |
| MutPred_rankscore | float |
- |
MutPred scores were ranked among all MutPred scores in dbNSFP. The rankscore is the ratio of the rank of the score over the total number of MutPred scores in dbNSFP.
|
 |
[0, 1] |
|
| MutPred_protID | str |
- |
UniProt accession or Ensembl transcript ID used for MutPred_score calculation.
|
No histogram: Too many unique values 101 for categorical histogram. |
NO DOMAIN | |
| MutPred_AAchange | str |
- |
Amino acid change used for MutPred_score calculation.
|
No histogram: Too many unique values 101 for categorical histogram. |
NO DOMAIN | |
| MutPred_Top5features | str |
- |
Top 5 features (molecular mechanisms of disease) as predicted by MutPred with p values. MutPred_score > 0.5 and p < 0.05 are referred to as actionable hypotheses. MutPred_score > 0.75 and p < 0.05 are referred to as confident hypotheses. MutPred_score > 0.75 and p < 0.01 are referred to as very confident hypotheses.
|
No histogram: Too many unique values 101 for categorical histogram. |
NO DOMAIN | |
| MVP_score | str |
- |
A pathogenicity prediction score for missense variants using deep learning approach. The range of MVP score is from 0 to 1. The larger the score, the more likely the variant is pathogenic. The authors suggest thresholds of 0.7 and 0.75 for separating damaging vs tolerant variants in constrained genes (ExAC pLI >=0.5) and non-constrained genes (ExAC pLI<0.5), respectively. Details see doi: http://dx.doi.org/10.1101/259390 Multiple entries are separated by ";", corresponding to Ensembl_transcriptid.
|
No histogram: Too many unique values 101 for categorical histogram. |
NO DOMAIN | |
| MVP_rankscore | float |
- |
MVP scores were ranked among all MVP scores in dbNSFP. The rankscore is the ratio of the rank of the score over the total number of MVP scores in dbNSFP.
|
 |
[0.00435, 1] |
|
| gMVP_score | str |
- |
A pathogenicity prediction score for missense variants using a graph attention neural network model. The range of gMVP score is from 0 to 1. The larger the score, the more likely the variant is pathogenic. Details see doi: https://www.nature.com/articles/s42256-022-00561-w Multiple entries are separated by ";", corresponding to Ensembl_transcriptid.
|
No histogram: Too many unique values 101 for categorical histogram. |
NO DOMAIN | |
| gMVP_rankscore | float |
- |
gMVP scores were ranked among all gMVP scores in dbNSFP. The rankscore is the ratio of the rank of the score over the total number of gMVP scores in dbNSFP.
|
 |
[0, 1] |
|
| MPC_score | str |
- |
A deleteriousness prediction score for missense variants based on regional missense constraint. The range of MPC score is 0 to 5. The larger the score, the more likely the variant is pathogenic. Details see doi: http://dx.doi.org/10.1101/148353. Multiple entries are separated by ";", corresponding to Ensembl_transcriptid.
|
No histogram: Too many unique values 101 for categorical histogram. |
NO DOMAIN | |
| MPC_rankscore | float |
- |
MPC scores were ranked among all MPC scores in dbNSFP. The rankscore is the ratio of the rank of the score over the total number of MPC scores in dbNSFP.
|
 |
[0.00014, 1] |
|
| PrimateAI_score | float |
- |
A pathogenicity prediction score for missense variants based on common variants of non-human primate species using a deep neural network. The range of PrimateAI score is 0 to 1. The larger the score, the more likely the variant is pathogenic. The authors suggest a threshold of 0.803 for separating damaging vs tolerant variants. Details see https://doi.org/10.1038/s41588-018-0167-z
|
 |
[0.111, 0.992] |
|
| PrimateAI_rankscore | float |
- |
PrimateAI scores were ranked among all PrimateAI scores in dbNSFP. The rankscore is the ratio of the rank of the score over the total number of PrimateAI scores in dbNSFP.
|
 |
[0, 1] |
|
| PrimateAI_pred | str |
- |
Prediction of PrimateAI score based on the authors' recommendation, "T(olerated)" or "D(amaging)". The score cutoff between "D" and "T" is 0.803.
|
 |
T, ., D | |
| DEOGEN2_score | str |
- |
A deleteriousness prediction score "which incorporates heterogeneous information about the molecular effects of the variants, the domains involved, the relevance of the gene and the interactions in which it participates". It ranges from 0 to 1. The larger the score, the more likely the variant is deleterious. The authors suggest a threshold of 0.5 for separating damaging vs tolerant variants.
|
No histogram: Too many unique values 101 for categorical histogram. |
NO DOMAIN | |
| DEOGEN2_rankscore | float |
- |
DEOGEN2 scores were ranked among all DEOGEN2 scores in dbNSFP. The rankscore is the ratio of the rank of the score over the total number of DEOGEN2 scores in dbNSFP.
|
 |
[0, 1] |
|
| DEOGEN2_pred | str |
- |
Prediction of DEOGEN2 score based on the authors' recommendation, "T(olerated)" or "D(amaging)". The score cutoff between "D" and "T" is 0.5.
|
No histogram: Too many unique values 101 for categorical histogram. |
NO DOMAIN | |
| BayesDel_addAF_score | float |
- |
A deleteriousness preidction meta-score for SNVs and indels with inclusion of MaxAF. See https://doi.org/10.1002/humu.23158 for details. The range of the score in dbNSFP is from -1.11707 to
|
 |
[-1.12, 0.751] |
|
| BayesDel_addAF_rankscore | float |
- |
BayesDel_addAF scores were ranked among all BayesDel_addAF scores in dbNSFP. The rankscore is the ratio of the rank of the score over the total number of BayesDel_addAF scores in dbNSFP.
|
 |
[0, 1] |
|
| BayesDel_addAF_pred | str |
- |
Prediction of BayesDel_addAF score based on the authors' recommendation, "T(olerated)" or "D(amaging)". The score cutoff between "D" and "T" is 0.0692655.
|
 |
T, D, . | |
| BayesDel_noAF_score | float |
- |
A deleteriousness preidction meta-score for SNVs and indels without inclusion of MaxAF. See https://doi.org/10.1002/humu.23158 for details. The range of the score in dbNSFP is from -1.31914 to 0.840878. The higher the score, the more likely the variant is pathogenic. The author suggested cutoff between deleterious ("D") and tolerated ("T") is -0.0570105.
|
 |
[-1.32, 0.841] |
|
| BayesDel_noAF_rankscore | float |
- |
BayesDel_noAF scores were ranked among all BayesDel_noAF scores in dbNSFP. The rankscore is the ratio of the rank of the score over the total number of BayesDel_noAF scores in dbNSFP.
|
 |
[0, 1] |
|
| BayesDel_noAF_pred | str |
- |
Prediction of BayesDel_noAF score based on the authors' recommendation, "T(olerated)" or "D(amaging)". The score cutoff between "D" and "T" is -0.0570105.
|
 |
T, D, . | |
| ClinPred_score | float |
- |
A deleteriousness preidction meta-score for nonsynonymous SNVs. See https://doi.org/10.1016/j.ajhg.2018.08.005. for details. The range of the score in dbNSFP is from 0 to 1. The higher the score, the more likely the variant is pathogenic. The author suggested cutoff between deleterious ("D") and tolerated ("T") is 0.5.
|
 |
[8.08e-06, 1] |
|
| ClinPred_rankscore | float |
- |
ClinPred scores were ranked among all ClinPred scores in dbNSFP. The rankscore is the ratio of the rank of the score over the total number of ClinPred scores in dbNSFP.
|
 |
[0, 1] |
|
| ClinPred_pred | str |
- |
Prediction of ClinPred score based on the authors' recommendation, "T(olerated)" or "D(amaging)". The score cutoff between "D" and "T" is 0.5.
|
 |
D, T, . | |
| LIST-S2_score | str |
- |
A deleteriousness preidction score for nonsynonymous SNVs. See https://doi.org/10.1093/nar/gkaa288. for details. The range of the score in dbNSFP is from 0 to 1. The higher the score, the more likely the variant is pathogenic. The author suggested cutoff between deleterious ("D") and tolerated ("T") is 0.85.
|
No histogram: Too many unique values 101 for categorical histogram. |
NO DOMAIN | |
| LIST-S2_rankscore | float |
- |
LIST-S2 scores were ranked among all LIST-S2 scores in dbNSFP. The rankscore is the ratio of the rank of the score over the total number of LIST-S2 scores in dbNSFP.
|
 |
[0, 1] |
|
| LIST-S2_pred | str |
- |
Prediction of LIST-S2 score based on the authors' recommendation, "T(olerated)" or "D(amaging)". The score cutoff between "D" and "T" is 0.85.
|
No histogram: Too many unique values 101 for categorical histogram. |
NO DOMAIN | |
| VARITY_R_score | str |
- |
VARITY_R scores are pathogenicity prediction scores for rare human missense variants. The range of VARITY_R score is from 0 to 1. The larger the score, the more likely the variant is pathogenic. Details see doi: https://doi.org/10.1016/j.ajhg.2021.08.012
|
No histogram: Too many unique values 101 for categorical histogram. |
NO DOMAIN | |
| VARITY_R_rankscore | float |
- |
VARITY_R scores were ranked among all VARITY_R scores in dbNSFP. The rankscore is the ratio of the rank of the score over the total number of VARITY_R scores in dbNSFP.
|
 |
[0, 1] |
|
| VARITY_ER_score | str |
- |
VARITY_ER scores are pathogenicity prediction scores for extreme rare human missense variants. The range of VARITY_ER score is from 0 to 1. The larger the score, the more likely the variant is pathogenic. Details see doi: https://doi.org/10.1016/j.ajhg.2021.08.012
|
No histogram: Too many unique values 101 for categorical histogram. |
NO DOMAIN | |
| VARITY_ER_rankscore | float |
- |
VARITY_ER scores were ranked among all VARITY_ER scores in dbNSFP. The rankscore is the ratio of the rank of the score over the total number of VARITY_ER scores in dbNSFP.
|
 |
[0, 1] |
|
| VARITY_R_LOO_score | str |
- |
"Same as VARITY_R except the prediction on the variants used for training was made using Leave-One-Variant out." Details see doi: https://doi.org/10.1016/j.ajhg.2021.08.012
|
No histogram: Too many unique values 101 for categorical histogram. |
NO DOMAIN | |
| VARITY_R_LOO_rankscore | float |
- |
VARITY_R_LOO scores were ranked among all VARITY_R_LOO scores in dbNSFP. The rankscore is the ratio of the rank of the score over the total number of VARITY_R_LOO scores in dbNSFP.
|
 |
[0, 1] |
|
| VARITY_ER_LOO_score | str |
- |
"Same as VARITY_ER except the prediction on the variants used for training was made using Leave-One-Variant out." Details see https://doi.org/10.1016/j.ajhg.2021.08.012
|
No histogram: Too many unique values 101 for categorical histogram. |
NO DOMAIN | |
| VARITY_ER_LOO_rankscore | float |
- |
VARITY_ER_LOO scores were ranked among all VARITY_ER_LOO scores in dbNSFP. The rankscore is the ratio of the rank of the score over the total number of VARITY_ER_LOO scores in dbNSFP.
|
 |
[0, 1] |
|
| ESM1b_score | str |
- |
ESM1b scores are log-likelihood ratio (LLR) scores for predicting the pathogenic effects of coding variants based on a 650-million-parameter protein language model, ESM1b. The range of ESM1b score in dbNSFP is from -24.538 to 6.937. The smaller the score, the more likely the variant is pathogenic. Details see doi: https://doi.org/10.1038/s41588-023-01465-0
|
No histogram: Too many unique values 101 for categorical histogram. |
NO DOMAIN | |
| ESM1b_rankscore | float |
- |
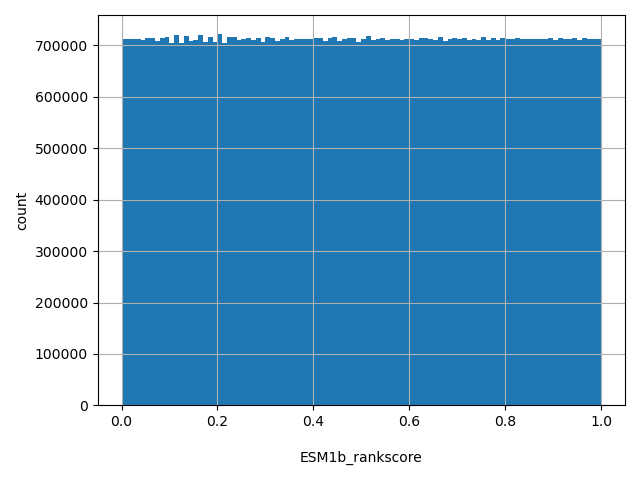
ESM1b scores were firstly negated (i.e., -ESM1b_score), then ranked among all -ESM1b_score scores in dbNSFP. The rankscore is the ratio of the rank of the -ESM1b_score over the total number of scores in dbNSFP.
|
 |
[0, 1] |
|
| ESM1b_pred | str |
- |
The authors do not recommend a threshold for separating deleterious (D) variants versus tolerated (T) variants. This prediction is based on the threshold of -7.5 described in their paper that yields a true-positive rate of 81% and a true-negative rate of 82% in their ClinVar and HGMD test datasets.
|
No histogram: Too many unique values 101 for categorical histogram. |
NO DOMAIN | |
| EVE_score | str |
- |
EVE is a unsupervised model designed to predict the clinical relevance of human single amino acid variants by examining the sequences of various organisms throughout evolutionary history. The EVE score ranges from 0 to 1. The larger the score, the more likely the variant is pathogenic. Detals see https://doi.org/10.1038/s41586-021-04043-8.
|
No histogram: Too many unique values 101 for categorical histogram. |
NO DOMAIN | |
| EVE_rankscore | float |
- |
EVE scores were ranked among all EVE scores in dbNSFP. The rankscore is the ratio of the rank of the score over the total number of EVE scores in dbNSFP.
|
 |
[0, 1] |
|
| EVE_Class10_pred | str |
- |
The EVE classification (B)enign, (U)ncertain, or (P)athogenic when setting 10% as uncertain in a Gaussian mixture model.
|
No histogram: Too many unique values 101 for categorical histogram. |
NO DOMAIN | |
| EVE_Class20_pred | str |
- |
The EVE classification (B)enign, (U)ncertain, or (P)athogenic when setting 20% as uncertain in a Gaussian mixture model.
|
No histogram: Too many unique values 101 for categorical histogram. |
NO DOMAIN | |
| EVE_Class25_pred | str |
- |
The EVE classification (B)enign, (U)ncertain, or (P)athogenic when setting 25% as uncertain in a Gaussian mixture model.
|
No histogram: Too many unique values 101 for categorical histogram. |
NO DOMAIN | |
| EVE_Class30_pred | str |
- |
The EVE classification (B)enign, (U)ncertain, or (P)athogenic when setting 30% as uncertain in a Gaussian mixture model.
|
No histogram: Too many unique values 101 for categorical histogram. |
NO DOMAIN | |
| EVE_Class40_pred | str |
- |
The EVE classification (B)enign, (U)ncertain, or (P)athogenic when setting 40% as uncertain in a Gaussian mixture model.
|
No histogram: Too many unique values 101 for categorical histogram. |
NO DOMAIN | |
| EVE_Class50_pred | str |
- |
The EVE classification (B)enign, (U)ncertain, or (P)athogenic when setting 50% as uncertain in a Gaussian mixture model.
|
No histogram: Too many unique values 101 for categorical histogram. |
NO DOMAIN | |
| EVE_Class60_pred | str |
- |
The EVE classification (B)enign, (U)ncertain, or (P)athogenic when setting 60% as uncertain in a Gaussian mixture model.
|
No histogram: Too many unique values 101 for categorical histogram. |
NO DOMAIN | |
| EVE_Class70_pred | str |
- |
The EVE classification (B)enign, (U)ncertain, or (P)athogenic when setting 70% as uncertain in a Gaussian mixture model.
|
No histogram: Too many unique values 101 for categorical histogram. |
NO DOMAIN | |
| EVE_Class75_pred | str |
- |
The EVE classification (B)enign, (U)ncertain, or (P)athogenic when setting 75% as uncertain in a Gaussian mixture model.
|
No histogram: Too many unique values 101 for categorical histogram. |
NO DOMAIN | |
| EVE_Class80_pred | str |
- |
The EVE classification (B)enign, (U)ncertain, or (P)athogenic when setting 80% as uncertain in a Gaussian mixture model.
|
No histogram: Too many unique values 101 for categorical histogram. |
NO DOMAIN | |
| EVE_Class90_pred | str |
- |
The EVE classification (B)enign, (U)ncertain, or (P)athogenic when setting 90% as uncertain in a Gaussian mixture model.
|
No histogram: Too many unique values 101 for categorical histogram. |
NO DOMAIN | |
| AlphaMissense_score | str |
- |
AlphaMissense is a unsupervised model for predicting the pathogenicity of human missense variants by incorporating structural context of an AlphaFold-derived system. The AlphaMissense score ranges from 0 to 1. The larger the score, the more likely the variant is pathogenic. Details see https://doi.org/10.1126/science.adg7492. License information: Copyright (2023) DeepMind Technologies Limited. All materials are licensed under the Creative Commons Attribution 4.0 International License (CC-BY) (the “License”). You may obtain a copy of the License at: https://creativecommons.org/licenses/by/4.0/legalcode.
|
No histogram: Too many unique values 101 for categorical histogram. |
NO DOMAIN | |
| AlphaMissense_rankscore | float |
- |
AlphaMissense scores were ranked among all AlphaMissense scores in dbNSFP. The rankscore is the ratio of the rank of the AlphaMissense_score over the total number of scores in dbNSFP.
|
 |
[0, 1] |
|
| AlphaMissense_pred | str |
- |
The AlphaMissense classification of likely (B)enign, (A)mbiguous, or likely (P)athogenic with
|
No histogram: Too many unique values 101 for categorical histogram. |
NO DOMAIN | |
| PHACTboost_score | str |
- |
"PHACTboost is a gradiatent boosting tree based classifier that combines PHACT scores with information from multiple sequence alignment, phylogenetic trees, and ancestral reconstruction." The range of the score is from 0 to 1, the larger the score the more likely the variant is pathegenic. Details see https://doi.org/10.1093/molbev/msae136. The authors recommend to use 0.62 as the cutoff for binary prediction (personal communication).
|
No histogram: Too many unique values 101 for categorical histogram. |
NO DOMAIN | |
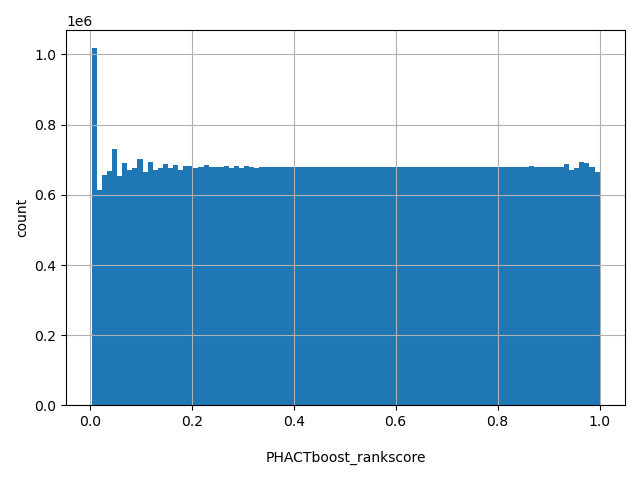
| PHACTboost_rankscore | float |
- |
PHACTboost scores were ranked among all PHACTboost scores in dbNSFP. The rankscore is the ratio of the rank of the PHACTboost_score over the total number of scores in dbNSFP.
|
 |
[0.00398, 1] |
|
| MutFormer_score | float |
- |
"MutFormer is an application of the BERT (Bidirectional Encoder Representations from Transformers) NLP (Natural Language Processing) model with an added adaptive vocabulary to protein context, for the purpose of predicting the effect of missense mutations on protein function." The range of the score is from 0 to 1, the larger the score the more likely the variant is pathegenic. Details see https://doi.org/10.1016/j.xinn.2023.100487. The authors recommend to use 0.8838 as the cutoff for binary prediction (personal communication).
|
 |
[3.9e-07, 1] |
|
| MutFormer_rankscore | float |
- |
MutFormer scores were ranked among all MutFormer scores in dbNSFP. The rankscore is the ratio of the rank of the MutFormer_score over the total number of scores in dbNSFP.
|
 |
[0.00026, 1] |
|
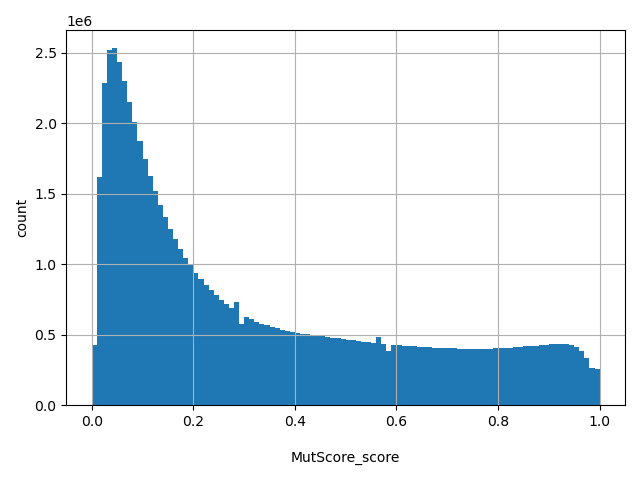
| MutScore_score | float |
- |
MutScore is an ensemble score which integerate multiple unsupervised scores for DNA substitutions with additional positional clustering information. The range of the score is from 0 to 1, the larger the score the more likely the variant is pathegenic. Details see https://doi.org/10.1016/j.ajhg.2022.01.006. The authors recommend to use 0.5 as the cutoff for binary prediction (personal communication).
|
 |
[0, 1] |
|
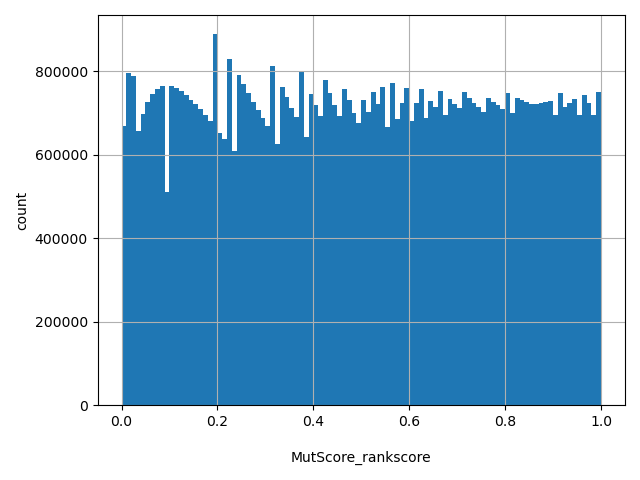
| MutScore_rankscore | float |
- |
MutScore scores were ranked among all MutScore scores in dbNSFP. The rankscore is the ratio of the rank of the MutScore_score over the total number of scores in dbNSFP.
|
 |
[0, 1] |
|
| Aloft_Fraction_transcripts_affected | str |
- |
the fraction of the transcripts of the gene affected i.e. No. of transcripts affected by the SNP/Total no. of protein_coding transcripts for the gene multiple values separated by ";", corresponding to Ensembl_proteinid.
|
No histogram: Too many unique values 101 for categorical histogram. |
NO DOMAIN | |
| Aloft_prob_Tolerant | str |
- |
Probability of the SNP being classified as benign by ALoFT multiple values separated by ";", corresponding to Ensembl_proteinid.
|
No histogram: Too many unique values 101 for categorical histogram. |
NO DOMAIN | |
| Aloft_prob_Recessive | str |
- |
Probability of the SNP being classified as recessive disease-causing by ALoFT multiple values separated by ";", corresponding to Ensembl_proteinid.
|
No histogram: Too many unique values 101 for categorical histogram. |
NO DOMAIN | |
| Aloft_prob_Dominant | str |
- |
Probability of the SNP being classified as dominant disease-causing by ALoFT multiple values separated by ";", corresponding to Ensembl_proteinid.
|
No histogram: Too many unique values 101 for categorical histogram. |
NO DOMAIN | |
| Aloft_pred | str |
- |
final classification predicted by ALoFT; values can be Tolerant, Recessive or Dominant multiple values separated by ";", corresponding to Ensembl_proteinid.
|
No histogram: Too many unique values 101 for categorical histogram. |
NO DOMAIN | |
| Aloft_Confidence | str |
- |
Confidence level of Aloft_pred; values can be "High Confidence" (p < 0.05) or "Low Confidence" (p > 0.05) multiple values separated by ";", corresponding to Ensembl_proteinid.
|
No histogram: Too many unique values 101 for categorical histogram. |
NO DOMAIN | |
| CADD_raw | float |
- |
CADD raw score for functional prediction of a SNP. Please refer to Kircher et al. (2014) Nature Genetics 46(3):310-5 for details. The larger the score the more likely the SNP has damaging effect. Scores range from -28.377575 to 25.511592 in dbNSFP. Please note the following copyright statement for CADD: "CADD scores (http://cadd.gs.washington.edu/) are Copyright 2013 University of Washington and Hudson-Alpha Institute for Biotechnology (all rights reserved) but are freely available for all academic, non-commercial applications. For commercial licensing information contact Jennifer McCullar (mccullaj@uw.edu)."
|
 |
[-28.4, 25.5] |
|
| CADD_raw_rankscore | float |
- |
CADD raw scores were ranked among all CADD raw scores in dbNSFP. The rankscore is the ratio of the rank of the score over the total number of CADD raw scores in dbNSFP. Please note the following copyright statement for CADD: "CADD scores (http://cadd.gs.washington.edu/) are Copyright 2013 University of Washington and Hudson-Alpha Institute for Biotechnology (all rights reserved) but are freely available for all academic, non-commercial applications. For commercial licensing information contact Jennifer McCullar (mccullaj@uw.edu)."
|
 |
[0, 1] |
|
| CADD_phred | float |
- |
CADD phred-like score. This is phred-like rank score based on whole genome CADD raw scores. Please refer to Kircher et al. (2014) Nature Genetics 46(3):310-5 for details. The larger the score the more likely the SNP has damaging effect. Please note the following copyright statement for CADD: "CADD scores (http://cadd.gs.washington.edu/) are Copyright 2013 University of Washington and Hudson-Alpha Institute for Biotechnology (all rights reserved) but are freely available for all academic, non-commercial applications. For commercial licensing information contact Jennifer McCullar (mccullaj@uw.edu)."
|
 |
[0, 99] |
|
| CADD_raw_hg19 | float |
- |
CADD raw score for functional prediction of a SNP using the hg19 model. Please refer to Kircher et al. (2014) Nature Genetics 46(3):310-5 for details. The larger the score the more likely the SNP has damaging effect. Scores range from -9.777566 to 30.05914 in dbNSFP. Please note the following copyright statement for CADD: "CADD scores (http://cadd.gs.washington.edu/) are Copyright 2013 University of Washington and Hudson-Alpha Institute for Biotechnology (all rights reserved) but are freely available for all academic, non-commercial applications. For commercial licensing information contact Jennifer McCullar (mccullaj@uw.edu)."
|
 |
[-9.78, 30.1] |
|
| CADD_raw_rankscore_hg19 | float |
- |
CADD raw scores were ranked among all CADD_raw_hg19 in dbNSFP. The rankscore is the ratio of the rank of the score over the total number of CADD raw scores in dbNSFP. Please note the following copyright statement for CADD: "CADD scores (http://cadd.gs.washington.edu/) are Copyright 2013 University of Washington and Hudson-Alpha Institute for Biotechnology (all rights reserved) but are freely available for all academic, non-commercial applications. For commercial licensing information contact Jennifer McCullar (mccullaj@uw.edu)."
|
 |
[0, 1] |
|
| CADD_phred_hg19 | float |
- |
CADD phred-like score using the hg19 model. This is phred-like rank score based on whole genome CADD raw scores. Please refer to Kircher et al. (2014) Nature Genetics
|
 |
[0, 99] |
|
| DANN_score | float |
- |
DANN is a functional prediction score retrained based on the training data of CADD using deep neural network. Scores range from 0 to 1. A larger number indicate a higher probability to be damaging. More information of this score can be found in doi: 10.1093/bioinformatics/btu703.
|
 |
[0.0171, 1] |
|
| DANN_rankscore | float |
- |
DANN scores were ranked among all DANN scores in dbNSFP. The rankscore is the ratio of the rank of the score over the total number of DANN scores in dbNSFP.
|
 |
[0, 1] |
|
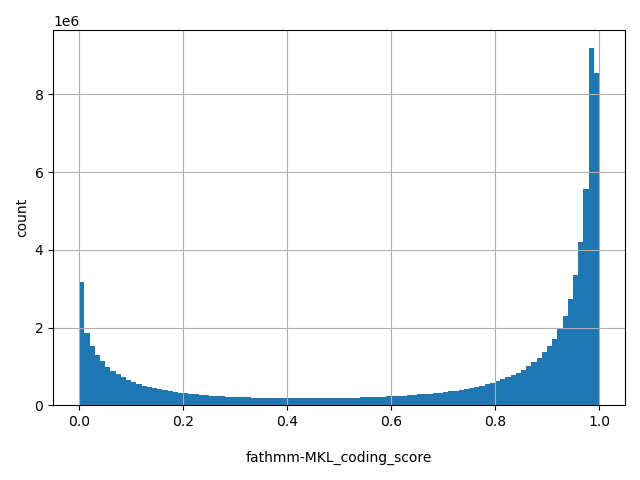
| fathmm-MKL_coding_score | float |
- |
fathmm-MKL p-values. Scores range from 0 to 1. SNVs with scores >0.5 are predicted to be deleterious, and those <0.5 are predicted to be neutral or benign. Scores close to 0 or 1 are with the highest-confidence. Coding scores are trained using 10 groups of features. More details of the score can be found in doi: 10.1093/bioinformatics/btv009.
|
 |
[0, 1] |
|
| fathmm-MKL_coding_rankscore | float |
- |
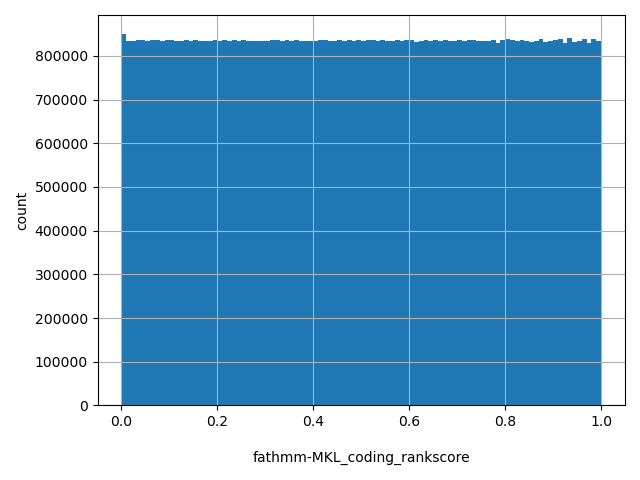
fathmm-MKL coding scores were ranked among all fathmm-MKL coding scores in dbNSFP. The rankscore is the ratio of the rank of the score over the total number of fathmm-MKL coding scores in dbNSFP.
|
 |
[0.00017, 1] |
|
| fathmm-MKL_coding_pred | str |
- |
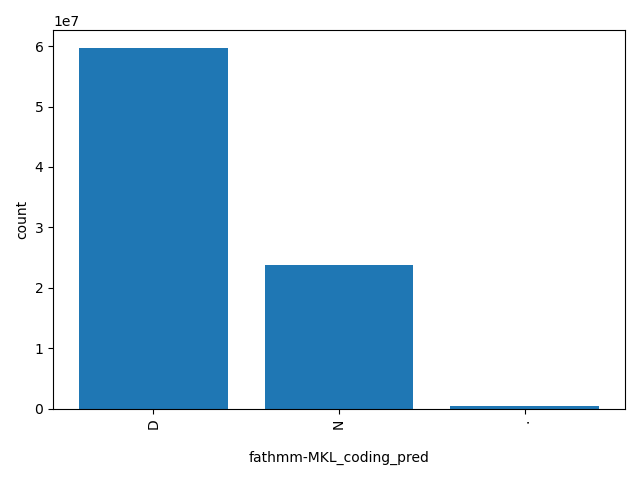
If a fathmm-MKL_coding_score is >0.5 (or rankscore >0.28317) the corresponding nsSNV is predicted as "D(AMAGING)"; otherwise it is predicted as "N(EUTRAL)".
|
 |
D, N, . | |
| fathmm-MKL_coding_group | str |
- |
the groups of features (labeled A-J) used to obtained the score. More details can be found in doi: 10.1093/bioinformatics/btv009.
|
No histogram: Can not merge categorical histograms; too many unique values 109 |
NO DOMAIN | |
| fathmm-XF_coding_score | float |
- |
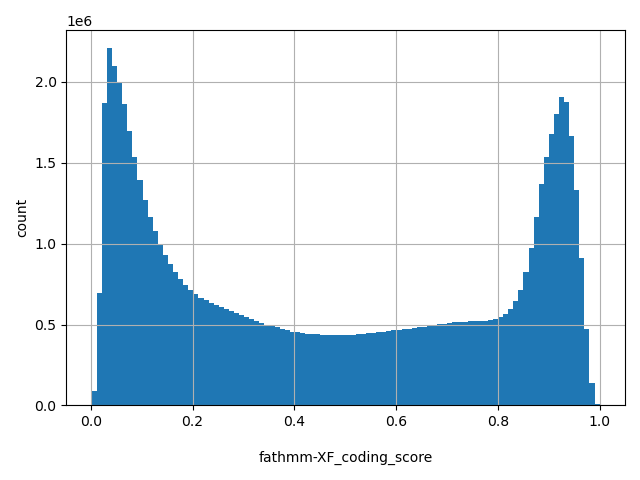
fathmm-XF p-values. Scores range from 0 to 1. SNVs with scores >0.5 are predicted to be deleterious, and those <0.5 are predicted to be neutral or benign. Scores close to 0 or 1 are with the highest-confidence. Coding scores are trained using 10 groups of features. More details of the score can be found in doi: 10.1093/bioinformatics/btx536.
|
 |
[0.00199, 0.999] |
|
| fathmm-XF_coding_rankscore | float |
- |
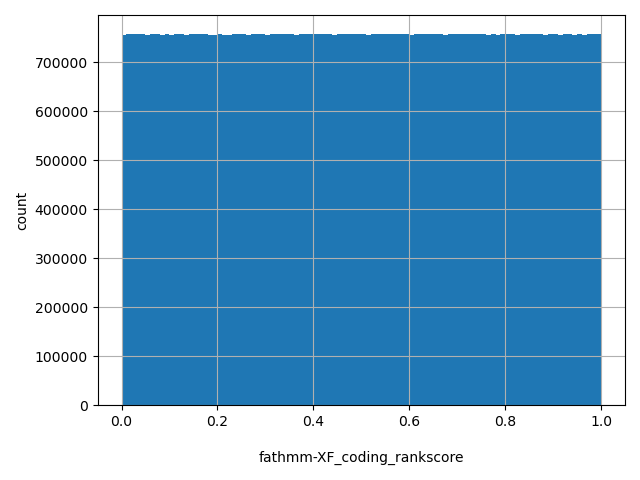
fathmm-XF coding scores were ranked among all fathmm-XF coding scores in dbNSFP. The rankscore is the ratio of the rank of the score over the total number of fathmm-XF coding scores in dbNSFP.
|
 |
[0, 1] |
|
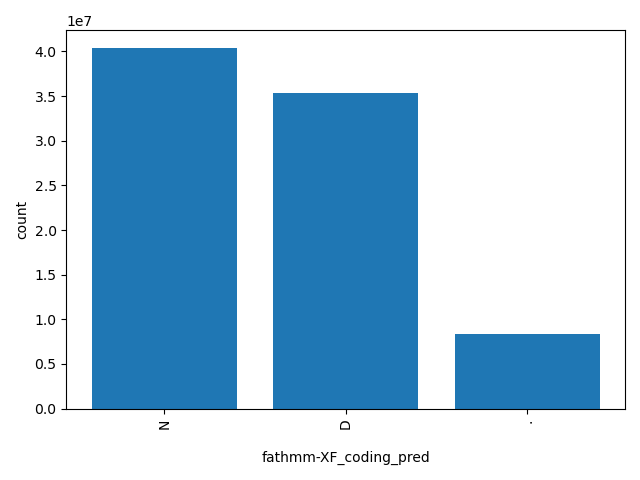
| fathmm-XF_coding_pred | str |
- |
If a fathmm-XF_coding_score is >0.5, the corresponding nsSNV is predicted as "D(AMAGING)"; otherwise it is predicted as "N(EUTRAL)".
|
 |
N, D, . | |
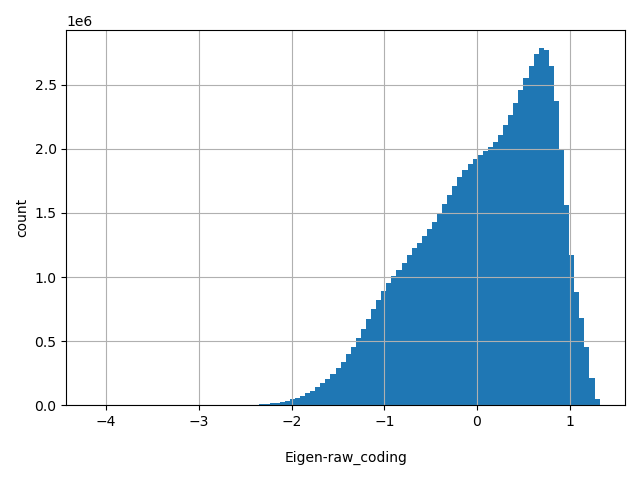
| Eigen-raw_coding | float |
- |
Eigen score for coding SNVs. A functional prediction score based on conservation, allele frequencies, and deleteriousness prediction using an unsupervised learning method (doi: 10.1038/ng.3477).
|
 |
[-4.15, 1.32] |
|
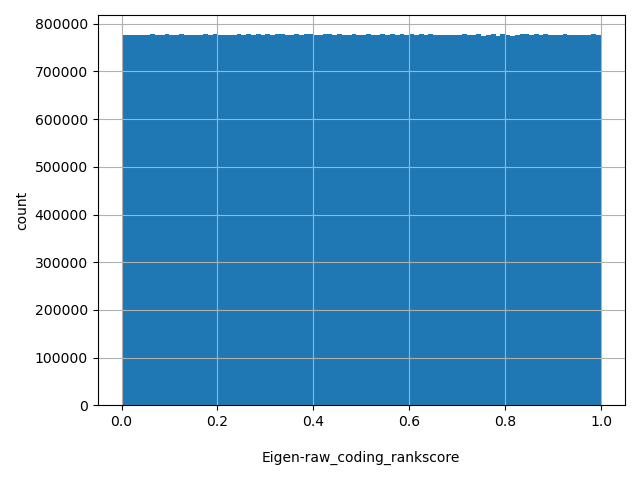
| Eigen-raw_coding_rankscore | float |
- |
Eigen-raw scores were ranked among all Eigen-raw scores in dbNSFP. The rankscore is the ratio of the rank of the score over the total number of Eigen-raw scores in dbNSFP.
|
 |
[0, 1] |
|
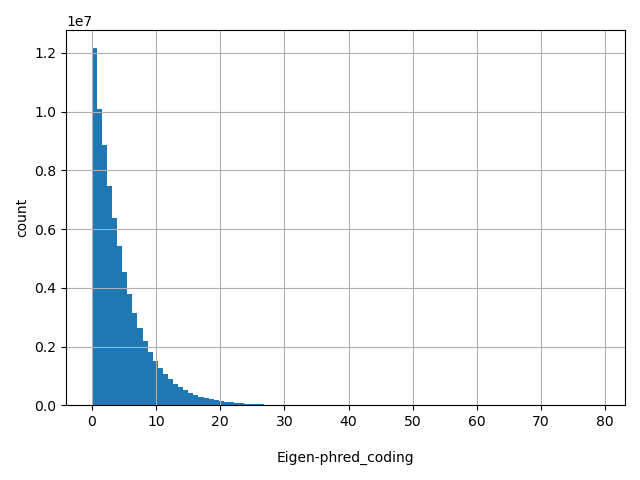
| Eigen-phred_coding | float |
- |
Eigen score in phred scale.
|
 |
[0, 79.1] |
|
| Eigen-PC-raw_coding | float |
- |
Eigen PC score for genome-wide SNVs. A functional prediction score based on conservation, allele frequencies, deleteriousness prediction (for missense SNVs) and epigenomic signals (for synonymous and non-coding SNVs) using an unsupervised learning method (doi: 10.1038/ng.3477).
|
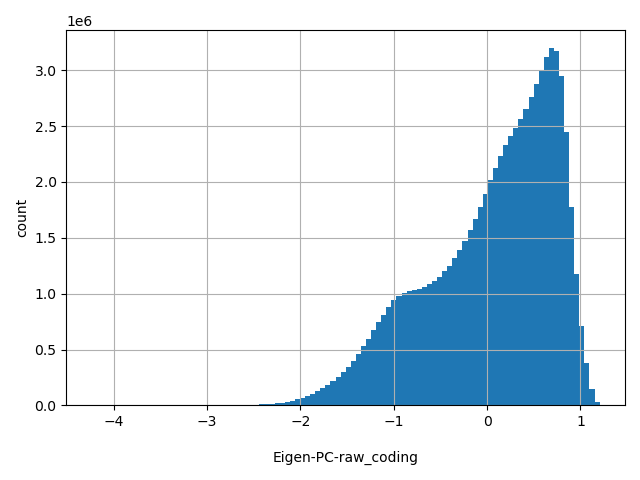 |
[-4.24, 1.2] |
|
| Eigen-PC-raw_coding_rankscore | float |
- |
Eigen-PC-raw scores were ranked among all Eigen-PC-raw scores in dbNSFP. The rankscore is the ratio of the rank of the score over the total number of Eigen-PC-raw scores in dbNSFP.
|
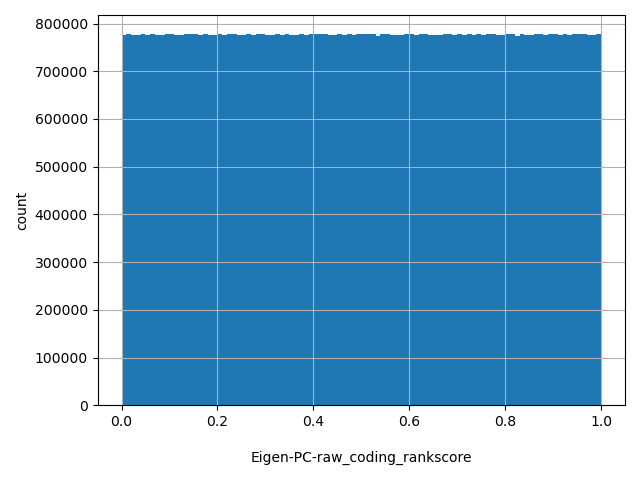 |
[0, 1] |
|
| Eigen-PC-phred_coding | float |
- |
Eigen PC score in phred scale.
|
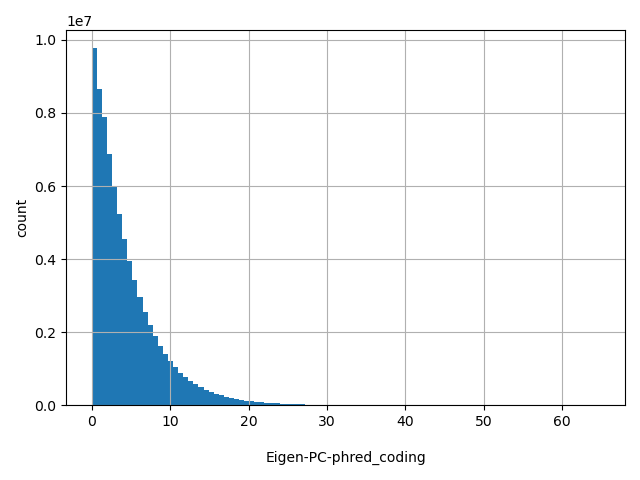 |
[0, 64.8] |
|
| GenoCanyon_score | float |
- |
A functional prediction score based on conservation and biochemical annotations using an unsupervised statistical learning. (doi:10.1038/srep10576)
|
 |
[1.1e-06, 1] |
|
| GenoCanyon_rankscore | float |
- |
GenoCanyon_score scores were ranked among all integrated fitCons scores in dbNSFP. The rankscore is the ratio of the rank of the score over the total number of GenoCanyon_score scores in dbNSFP.
|
 |
[0.012, 0.983] |
|
| integrated_fitCons_score | float |
- |
fitCons score predicts the fraction of genomic positions belonging to a specific function class (defined by epigenomic "fingerprint") that are under selective pressure. Scores range from 0 to 1, with a larger score indicating a higher proportion of nucleic sites of the functional class the genomic position belong to are under selective pressure, therefore more likely to be functional important. Integrated (i6) scores are integrated across three cell types (GM12878, H1-hESC and HUVEC). More details can be found in doi:10.1038/ng.3196.
|
 |
[0, 0.84] |
|
| integrated_fitCons_rankscore | float |
- |
integrated fitCons scores were ranked among all integrated fitCons scores in dbNSFP. The rankscore is the ratio of the rank of the score over the total number of integrated fitCons scores in dbNSFP.
|
 |
[0.00013, 1] |
|
| integrated_confidence_value | int |
- |
0 - highly significant scores (approx. p<.003); 1 - significant scores (approx. p<.05); 2 - informative scores (approx. p<.25); 3 - other scores (approx. p>=.25).
|
 |
[0, 3] |
|
| GM12878_fitCons_score | float |
- |
fitCons score predicts the fraction of genomic positions belonging to a specific function class (defined by epigenomic "fingerprint") that are under selective pressure. Scores range from 0 to 1, with a larger score indicating a higher proportion of nucleic sites of the functional class the genomic position belong to are under selective pressure, therefore more likely to be functional important. GM12878 fitCons scores are based on cell type GM12878. More details can be found in doi:10.1038/ng.3196.
|
 |
[0, 0.959] |
|
| GM12878_fitCons_rankscore | float |
- |
GM12878 fitCons scores were ranked among all GM12878 fitCons scores in dbNSFP. The rankscore is the ratio of the rank of the score over the total number of GM12878 fitCons scores in dbNSFP.
|
 |
[0.0001, 1] |
|
| GM12878_confidence_value | int |
- |
0 - highly significant scores (approx. p<.003); 1 - significant scores (approx. p<.05); 2 - informative scores (approx. p<.25); 3 - other scores (approx. p>=.25).
|
 |
[0, 3] |
|
| H1-hESC_fitCons_score | float |
- |
fitCons score predicts the fraction of genomic positions belonging to a specific function class (defined by epigenomic "fingerprint") that are under selective pressure. Scores range from 0 to 1, with a larger score indicating a higher proportion of nucleic sites of the functional class the genomic position belong to are under selective pressure, therefore more likely to be functional important. GM12878 fitCons scores are based on cell type H1-hESC. More details can be found in doi:10.1038/ng.3196.
|
 |
[0, 0.877] |
|
| H1-hESC_fitCons_rankscore | float |
- |
H1-hESC fitCons scores were ranked among all H1-hESC fitCons scores in dbNSFP. The rankscore is the ratio of the rank of the score over the total number of H1-hESC fitCons scores in dbNSFP.
|
 |
[0.00061, 1] |
|
| H1-hESC_confidence_value | int |
- |
0 - highly significant scores (approx. p<.003); 1 - significant scores (approx. p<.05); 2 - informative scores (approx. p<.25); 3 - other scores (approx. p>=.25).
|
 |
[0, 3] |
|
| HUVEC_fitCons_score | float |
- |
fitCons score predicts the fraction of genomic positions belonging to a specific function class (defined by epigenomic "fingerprint") that are under selective pressure. Scores range from 0 to 1, with a larger score indicating a higher proportion of nucleic sites of the functional class the genomic position belong to are under selective pressure, therefore more likely to be functional important. GM12878 fitCons scores are based on cell type HUVEC. More details can be found in doi:10.1038/ng.3196.
|
 |
[0, 0.836] |
|
| HUVEC_fitCons_rankscore | float |
- |
HUVEC fitCons scores were ranked among all HUVEC fitCons scores in dbNSFP. The rankscore is the ratio of the rank of the score over the total number of HUVEC fitCons scores in dbNSFP.
|
 |
[9e-05, 1] |
|
| HUVEC_confidence_value | int |
- |
0 - highly significant scores (approx. p<.003); 1 - significant scores (approx. p<.05); 2 - informative scores (approx. p<.25); 3 - other scores (approx. p>=.25).
|
 |
[0, 3] |
|
| LINSIGHT | float |
- |
"The LINSIGHT score measures the probability of negative selection on noncoding sites" Details refer to doi:10.1038/ng.3810.
|
 |
[0.0374, 0.995] |
|
| LINSIGHT_rankscore | float |
- |
LINSIGHT scores were ranked among all LINSIGHT scores in dbNSFP. The rankscore is the ratio of the rank of the score over the total number of LINSIGHT scores in dbNSFP.
|
 |
[0, 1] |
|
| GERP++_NR | float |
- |
GERP++ neutral rate
|
 |
[0.0465, 6.17] |
|
| GERP++_RS | float |
- |
GERP++ RS score, the larger the score, the more conserved the site. Scores range from -12.3 to 6.17.
|
 |
[-12.3, 6.17] |
|
| GERP++_RS_rankscore | float |
- |
GERP++ RS scores were ranked among all GERP++ RS scores in dbNSFP. The rankscore is the ratio of the rank of the score over the total number of GERP++ RS scores in dbNSFP.
|
 |
[1e-05, 0.997] |
|
| GERP_91_mammals | float |
- |
GERP conservation score calculated based on multiple sequence alignments of 91 mammals.
|
 |
[-19.4, 10] |
|
| GERP_91_mammals_rankscore | float |
- |
GERP (91 mammals) scores were ranked among all GERP (91 mammals) scores in dbNSFP. The rankscore is the ratio of the rank of the score over the total number of GERP_91_mammals scores in dbNSFP.
|
 |
[0, 1] |
|
| phyloP100way_vertebrate | float |
- |
phyloP (phylogenetic p-values) conservation score based on the multiple alignments of 100 vertebrate genomes (including human). The larger the score, the more conserved the site. Scores range from -20.0 to 10.003 in dbNSFP.
|
 |
[-20, 10] |
|
| phyloP100way_vertebrate_rankscore | float |
- |
phyloP100way_vertebrate scores were ranked among all phyloP100way_vertebrate scores in dbNSFP. The rankscore is the ratio of the rank of the score over the total number of phyloP100way_vertebrate scores in dbNSFP.
|
 |
[0, 0.997] |
|
| phyloP470way_mammalian | float |
- |
phyloP (phylogenetic p-values) conservation score based on the multiple alignments of 470 mammalian genomes (including human). The larger the score, the more conserved the site. Scores range from -20 to 11.936 in dbNSFP.
|
 |
[-20, 11.9] |
|
| phyloP470way_mammalian_rankscore | float |
- |
phyloP470way_mammalian scores were ranked among all phyloP470way_mammalian scores in dbNSFP. The rankscore is the ratio of the rank of the score over the total number of phyloP470way_mammalian scores in dbNSFP.
|
 |
[0.00162, 1] |
|
| phyloP17way_primate | float |
- |
a conservation score based on 17way alignment primate set, the higher the more conservative. Scores range from -13.362 to 0.756 in dbNSFP.
|
 |
[-13.4, 0.756] |
|
| phyloP17way_primate_rankscore | float |
- |
the rank of the phyloP17way_primate score among all phyloP17way_primate scores in dbNSFP.
|
 |
[0, 0.943] |
|
| phastCons100way_vertebrate | float |
- |
phastCons conservation score based on the multiple alignments of 100 vertebrate genomes (including human). The larger the score, the more conserved the site. Scores range from 0 to 1.
|
 |
[0, 1] |
|
| phastCons100way_vertebrate_rankscore | float |
- |
phastCons100way_vertebrate scores were ranked among all phastCons100way_vertebrate scores in dbNSFP. The rankscore is the ratio of the rank of the score over the total number of phastCons100way_vertebrate scores in dbNSFP.
|
 |
[0.0639, 0.716] |
|
| phastCons470way_mammalian | float |
- |
phastCons conservation score based on the multiple alignments of 470 mammalian genomes (including human). The larger the score, the more conserved the site. Scores range from 0 to 1.
|
 |
[0, 1] |
|
| phastCons470way_mammalian_rankscore | float |
- |
phastCons470way_mammalian scores were ranked among all phastCons470way_mammalian scores in dbNSFP. The rankscore is the ratio of the rank of the score over the total number of phastCons470way_mammalian scores in dbNSFP.
|
 |
[0.0837, 0.682] |
|
| phastCons17way_primate | float |
- |
a conservation score based on 17way alignment primate set, The larger the score, the more conserved the site. Scores range from 0 to 1.
|
 |
[0, 1] |
|
| phastCons17way_primate_rankscore | float |
- |
the rank of the phastCons17way_primate score among all phastCons17way_primate scores in dbNSFP.
|
 |
[0.00833, 0.972] |
|
| SiPhy_29way_pi | str |
- |
The estimated stationary distribution of A, C, G and T at the site, using SiPhy algorithm based on 29 mammals genomes.
|
No histogram: Too many unique values 101 for categorical histogram. |
NO DOMAIN | |
| SiPhy_29way_logOdds | float |
- |
SiPhy score based on 29 mammals genomes. The larger the score, the more conserved the site. Scores range from 0 to 37.9718 in dbNSFP.
|
 |
[0.0003, 38] |
|
| SiPhy_29way_logOdds_rankscore | float |
- |
SiPhy_29way_logOdds scores were ranked among all SiPhy_29way_logOdds scores in dbNSFP. The rankscore is the ratio of the rank of the score over the total number of SiPhy_29way_logOdds scores in dbNSFP.
|
 |
[0, 1] |
|
| bStatistic | int |
- |
Background selection (B) value estimates from doi.org/10.1371/journal.pgen.1000471. Ranges from 0 to 1000. It estimates the expected fraction (*1000) of neutral diversity present at a site. Values close to 0 represent near complete removal of diversity as a result of background selection and values near 1000 indicating absent of background selection. Data from CADD v1.4.
|
 |
[0, 1e+03] |
|
| bStatistic_converted_rankscore | float |
- |
bStatistic scores were first converted to -bStatistic, then ranked among all -bStatistic scores in dbNSFP. The rankscore is the ratio of the rank of -bStatistic over the total number of -bStatistic scores in dbNSFP.
|
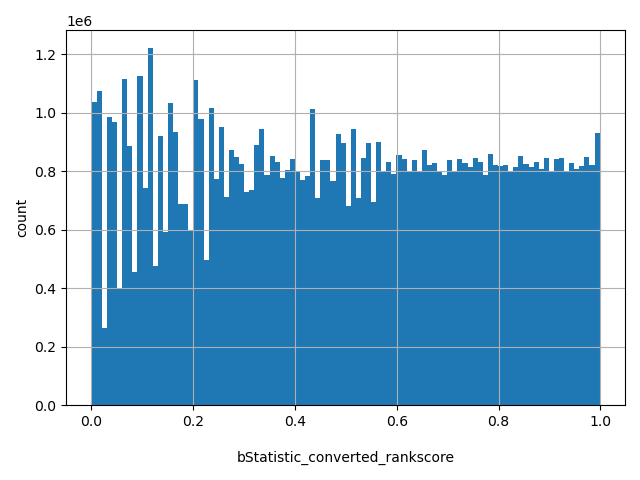 |
[0.00083, 0.999] |
|
| 1000Gp3_AC | int |
- |
Alternative allele counts in the whole 1000 genomes phase 3 (1000Gp3) data.
|
 |
[0, 5.01e+03] |
|
| 1000Gp3_AF | float |
- |
Alternative allele frequency in the whole 1000Gp3 data.
|
 |
[0, 1] |
|
| 1000Gp3_AFR_AC | int |
- |
Alternative allele counts in the 1000Gp3 African descendent samples.
|
 |
[0, 1.32e+03] |
|
| 1000Gp3_AFR_AF | float |
- |
Alternative allele frequency in the 1000Gp3 African descendent samples.
|
 |
[0, 1] |
|
| 1000Gp3_EUR_AC | int |
- |
Alternative allele counts in the 1000Gp3 European descendent samples.
|
 |
[0, 1.01e+03] |
|
| 1000Gp3_EUR_AF | float |
- |
Alternative allele frequency in the 1000Gp3 European descendent samples.
|
 |
[0, 1] |
|
| 1000Gp3_AMR_AC | int |
- |
Alternative allele counts in the 1000Gp3 American descendent samples.
|
 |
[0, 694] |
|
| 1000Gp3_AMR_AF | float |
- |
Alternative allele frequency in the 1000Gp3 American descendent samples.
|
 |
[0, 1] |
|
| 1000Gp3_EAS_AC | int |
- |
Alternative allele counts in the 1000Gp3 East Asian descendent samples.
|
 |
[0, 1.01e+03] |
|
| 1000Gp3_EAS_AF | float |
- |
Alternative allele frequency in the 1000Gp3 East Asian descendent samples.
|
 |
[0, 1] |
|
| 1000Gp3_SAS_AC | int |
- |
Alternative allele counts in the 1000Gp3 South Asian descendent samples.
|
 |
[0, 978] |
|
| 1000Gp3_SAS_AF | float |
- |
Alternative allele frequency in the 1000Gp3 South Asian descendent samples.
|
 |
[0, 1] |
|
| TWINSUK_AC | int |
- |
Alternative allele count in called genotypes in UK10K TWINSUK cohort.
|
 |
[0, 3.71e+03] |
|
| TWINSUK_AF | float |
- |
Alternative allele frequency in called genotypes in UK10K TWINSUK cohort.
|
 |
[0, 1] |
|
| ALSPAC_AC | int |
- |
Alternative allele count in called genotypes in UK10K ALSPAC cohort.
|
 |
[0, 3.85e+03] |
|
| ALSPAC_AF | float |
- |
Alternative allele frequency in called genotypes in UK10K ALSPAC cohort.
|
 |
[0, 1] |
|
| UK10K_AC | int |
- |
Alternative allele count in combined genotypes in UK10K cohort (TWINSUK+ALSPAC).
|
 |
[1, 7.56e+03] |
|
| UK10K_AF | float |
- |
Alternative allele frequency in combined genotypes in UK10K cohort (TWINSUK+ALSPAC).
|
 |
[0.000132, 1] |
|
| ESP6500_AA_AC | int |
- |
Alternative allele count in the African American samples of the NHLBI GO Exome Sequencing Project (ESP6500 data set).
|
 |
[0, 4.41e+03] |
|
| ESP6500_AA_AF | float |
- |
Alternative allele frequency in the African American samples of the NHLBI GO Exome Sequencing Project (ESP6500 data set).
|
 |
[0, 1] |
|
| ESP6500_EA_AC | int |
- |
Alternative allele count in the European American samples of the NHLBI GO Exome Sequencing Project (ESP6500 data set).
|
 |
[0, 8.6e+03] |
|
| ESP6500_EA_AF | float |
- |
Alternative allele frequency in the European American samples of the NHLBI GO Exome Sequencing Project (ESP6500 data set).
|
 |
[0, 1] |
|
| ExAC_AC | int |
- |
Allele count in total ExAC samples (60,706 samples)
|
 |
[1, 1.21e+05] |
|
| ExAC_AF | float |
- |
Allele frequency in total ExAC samples
|
 |
[8.24e-06, 1] |
|
| ExAC_Adj_AC | int |
- |
Adjusted Alt allele counts (DP >= 10 & GQ >= 20) in total ExAC samples
|
 |
[0, 1.21e+05] |
|
| ExAC_Adj_AF | float |
- |
Adjusted Alt allele frequency (DP >= 10 & GQ >= 20) in total ExAC samples
|
 |
[0, 1] |
|
| ExAC_AFR_AC | int |
- |
Adjusted Alt allele counts (DP >= 10 & GQ >= 20) in African & African American ExAC samples
|
 |
[0, 1.04e+04] |
|
| ExAC_AFR_AF | float |
- |
Adjusted Alt allele frequency (DP >= 10 & GQ >= 20) in African & African American ExAC samples
|
 |
[0, 1] |
|
| ExAC_AMR_AC | int |
- |
Adjusted Alt allele counts (DP >= 10 & GQ >= 20) in American ExAC samples
|
 |
[0, 1.16e+04] |
|
| ExAC_AMR_AF | float |
- |
Adjusted Alt allele frequency (DP >= 10 & GQ >= 20) in American ExAC samples
|
 |
[0, 1] |
|
| ExAC_EAS_AC | int |
- |
Adjusted Alt allele counts (DP >= 10 & GQ >= 20) in East Asian ExAC samples
|
 |
[0, 8.65e+03] |
|
| ExAC_EAS_AF | float |
- |
Adjusted Alt allele frequency (DP >= 10 & GQ >= 20) in East Asian ExAC samples
|
 |
[0, 1] |
|
| ExAC_FIN_AC | int |
- |
Adjusted Alt allele counts (DP >= 10 & GQ >= 20) in Finnish ExAC samples
|
 |
[0, 6.61e+03] |
|
| ExAC_FIN_AF | float |
- |
Adjusted Alt allele frequency (DP >= 10 & GQ >= 20) in Finnish ExAC samples
|
 |
[0, 1] |
|
| ExAC_NFE_AC | int |
- |
Adjusted Alt allele counts (DP >= 10 & GQ >= 20) in Non-Finnish European ExAC samples
|
 |
[0, 6.67e+04] |
|
| ExAC_NFE_AF | float |
- |
Adjusted Alt allele frequency (DP >= 10 & GQ >= 20) in Non-Finnish European ExAC samples
|
 |
[0, 1] |
|
| ExAC_SAS_AC | int |
- |
Adjusted Alt allele counts (DP >= 10 & GQ >= 20) in South Asian ExAC samples
|
 |
[0, 1.65e+04] |
|
| ExAC_SAS_AF | float |
- |
Adjusted Alt allele frequency (DP >= 10 & GQ >= 20) in South Asian ExAC samples
|
 |
[0, 1] |
|
| ExAC_nonTCGA_AC | int |
- |
Allele count in total ExAC_nonTCGA samples (53,105 samples)
|
 |
[1, 1.06e+05] |
|
| ExAC_nonTCGA_AF | float |
- |
Allele frequency in total ExAC_nonTCGA samples
|
 |
[9.42e-06, 1] |
|
| ExAC_nonTCGA_Adj_AC | int |
- |
Adjusted Alt allele counts (DP >= 10 & GQ >= 20) in total ExAC_nonTCGA samples
|
 |
[0, 1.06e+05] |
|
| ExAC_nonTCGA_Adj_AF | float |
- |
Adjusted Alt allele frequency (DP >= 10 & GQ >= 20) in total ExAC_nonTCGA samples
|
 |
[0, 1] |
|
| ExAC_nonTCGA_AFR_AC | int |
- |
Adjusted Alt allele counts (DP >= 10 & GQ >= 20) in African & African American ExAC_nonTCGA samples
|
 |
[0, 9.07e+03] |
|
| ExAC_nonTCGA_AFR_AF | float |
- |
Adjusted Alt allele frequency (DP >= 10 & GQ >= 20) in African & African American ExAC_nonTCGA samples
|
 |
[0, 1] |
|
| ExAC_nonTCGA_AMR_AC | int |
- |
Adjusted Alt allele counts (DP >= 10 & GQ >= 20) in American ExAC_nonTCGA samples
|
 |
[0, 1.12e+04] |
|
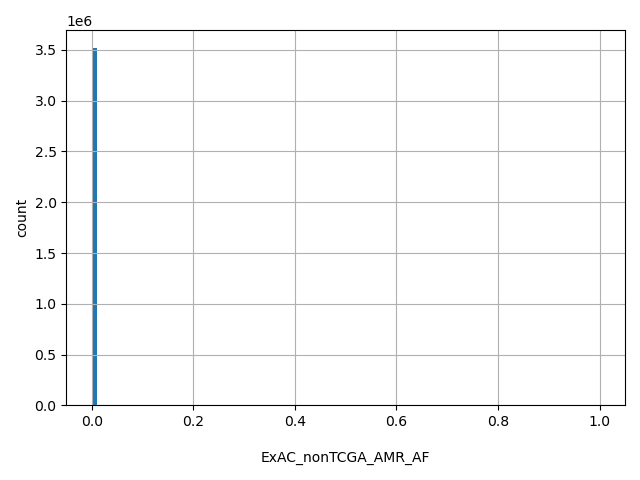
| ExAC_nonTCGA_AMR_AF | float |
- |
Adjusted Alt allele frequency (DP >= 10 & GQ >= 20) in American ExAC_nonTCGA samples
|
 |
[0, 1] |
|
| ExAC_nonTCGA_EAS_AC | int |
- |
Adjusted Alt allele counts (DP >= 10 & GQ >= 20) in East Asian ExAC_nonTCGA samples
|
 |
[0, 7.87e+03] |
|
| ExAC_nonTCGA_EAS_AF | float |
- |
Adjusted Alt allele frequency (DP >= 10 & GQ >= 20) in East Asian ExAC_nonTCGA samples
|
 |
[0, 1] |
|
| ExAC_nonTCGA_FIN_AC | int |
- |
Adjusted Alt allele counts (DP >= 10 & GQ >= 20) in Finnish ExAC_nonTCGA samples
|
 |
[0, 6.61e+03] |
|
| ExAC_nonTCGA_FIN_AF | float |
- |
Adjusted Alt allele frequency (DP >= 10 & GQ >= 20) in Finnish ExAC_nonTCGA samples
|
 |
[0, 1] |
|
| ExAC_nonTCGA_NFE_AC | int |
- |
Adjusted Alt allele counts (DP >= 10 & GQ >= 20) in Non-Finnish European ExAC_nonTCGA samples
|
 |
[0, 5.43e+04] |
|
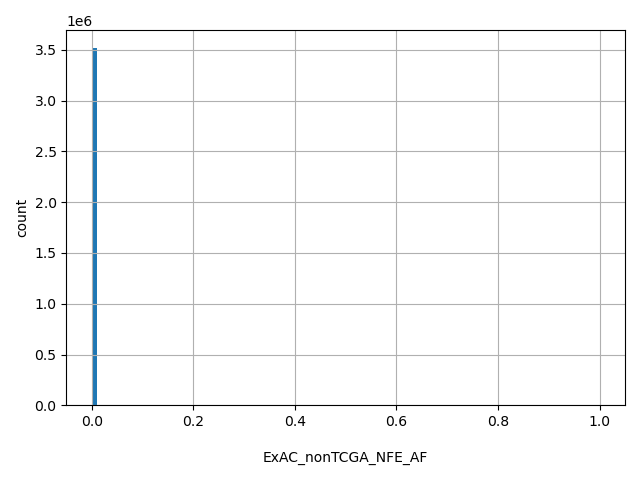
| ExAC_nonTCGA_NFE_AF | float |
- |
Adjusted Alt allele frequency (DP >= 10 & GQ >= 20) in Non-Finnish European ExAC_nonTCGA samples
|
 |
[0, 1] |
|
| ExAC_nonTCGA_SAS_AC | int |
- |
Adjusted Alt allele counts (DP >= 10 & GQ >= 20) in South Asian ExAC_nonTCGA samples
|
 |
[0, 1.64e+04] |
|
| ExAC_nonTCGA_SAS_AF | float |
- |
Adjusted Alt allele frequency (DP >= 10 & GQ >= 20) in South Asian ExAC_nonTCGA samples
|
 |
[0, 1] |
|
| ExAC_nonpsych_AC | int |
- |
Allele count in total ExAC_nonpsych samples (45,376 samples)
|
 |
[1, 9.08e+04] |
|
| ExAC_nonpsych_AF | float |
- |
Allele frequency in total ExAC_nonpsych samples
|
 |
[1.1e-05, 1] |
|
| ExAC_nonpsych_Adj_AC | int |
- |
Adjusted Alt allele counts (DP >= 10 & GQ >= 20) in total ExAC_nonpsych samples
|
 |
[0, 9.08e+04] |
|
| ExAC_nonpsych_Adj_AF | float |
- |
Adjusted Alt allele frequency (DP >= 10 & GQ >= 20) in total ExAC_nonpsych samples
|
 |
[0, 1] |
|
| ExAC_nonpsych_AFR_AC | int |
- |
Adjusted Alt allele counts (DP >= 10 & GQ >= 20) in African & African American ExAC_nonpsych samples
|
 |
[0, 1.04e+04] |
|
| ExAC_nonpsych_AFR_AF | float |
- |
Adjusted Alt allele frequency (DP >= 10 & GQ >= 20) in African & African American ExAC_nonpsych samples
|
 |
[0, 1] |
|
| ExAC_nonpsych_AMR_AC | int |
- |
Adjusted Alt allele counts (DP >= 10 & GQ >= 20) in American ExAC_nonpsych samples
|
 |
[0, 1.16e+04] |
|
| ExAC_nonpsych_AMR_AF | float |
- |
Adjusted Alt allele frequency (DP >= 10 & GQ >= 20) in American ExAC_nonpsych samples
|
 |
[0, 1] |
|
| ExAC_nonpsych_EAS_AC | int |
- |
Adjusted Alt allele counts (DP >= 10 & GQ >= 20) in East Asian ExAC_nonpsych samples
|
 |
[0, 5.64e+03] |
|
| ExAC_nonpsych_EAS_AF | float |
- |
Adjusted Alt allele frequency (DP >= 10 & GQ >= 20) in East Asian ExAC_nonpsych samples
|
 |
[0, 1] |
|
| ExAC_nonpsych_FIN_AC | int |
- |
Adjusted Alt allele counts (DP >= 10 & GQ >= 20) in Finnish ExAC_nonpsych samples
|
 |
[0, 3.8e+03] |
|
| ExAC_nonpsych_FIN_AF | float |
- |
Adjusted Alt allele frequency (DP >= 10 & GQ >= 20) in Finnish ExAC_nonpsych samples
|
 |
[0, 1] |
|
| ExAC_nonpsych_NFE_AC | int |
- |
Adjusted Alt allele counts (DP >= 10 & GQ >= 20) in Non-Finnish European ExAC_nonpsych samples
|
 |
[0, 4.21e+04] |
|
| ExAC_nonpsych_NFE_AF | float |
- |
Adjusted Alt allele frequency (DP >= 10 & GQ >= 20) in Non-Finnish European ExAC_nonpsych samples
|
 |
[0, 1] |
|
| ExAC_nonpsych_SAS_AC | int |
- |
Adjusted Alt allele counts (DP >= 10 & GQ >= 20) in South Asian ExAC_nonpsych samples
|
 |
[0, 1.65e+04] |
|
| ExAC_nonpsych_SAS_AF | float |
- |
Adjusted Alt allele frequency (DP >= 10 & GQ >= 20) in South Asian ExAC_nonpsych samples
|
 |
[0, 1] |
|
| gnomAD_exomes_flag | str |
- |
information from gnomAD exome data indicating whether the variant falling within low-complexity (lcr) or segmental duplication (segdup) or decoy regions. The flag can be either "." for high-quality PASS or not reported/polymorphic in gnomAD exomes, "lcr" for within lcr, "segdup" for within segdup, or "decoy" for with decoy region.
|
 |
., segdup, lcr, lcr;segdup | |
| gnomAD_exomes_AC | int |
- |
Alternative allele count in the whole gnomAD exome samples v4.0.0
|
 |
[1, 1.46e+06] |
|
| gnomAD_exomes_AN | int |
- |
Total allele count in the whole gnomAD exome samples v4.0.0
|
 |
[1, 1.46e+06] |
|
| gnomAD_exomes_AF | float |
- |
Alternative allele frequency in the whole gnomAD exome samples v4.0.0
|
 |
[6.84e-07, 1] |
|
| gnomAD_exomes_nhomalt | int |
- |
Count of individuals with homozygous alternative allele in the whole gnomAD exome samples v4.0.0
|
 |
[0, 7.31e+05] |
|
| gnomAD_exomes_POPMAX_AC | int |
- |
Allele count in the population with the maximum AF
|
 |
[0, 1.11e+06] |
|
| gnomAD_exomes_POPMAX_AN | int |
- |
Total number of alleles in the population with the maximum AF
|
 |
[1, 1.11e+06] |
|
| gnomAD_exomes_POPMAX_AF | float |
- |
Maximum allele frequency across populations (excluding samples of Ashkenazi, Finnish, and indeterminate ancestry)
|
 |
[0, 1] |
|
| gnomAD_exomes_POPMAX_nhomalt | int |
- |
Count of homozygous individuals in the population with the maximum allele frequency
|
 |
[0, 5.56e+05] |
|
| gnomAD_exomes_AFR_AC | int |
- |
Alternative allele count in the African/African American gnomAD exome samples v4.0.0
|
 |
[0, 3.35e+04] |
|
| gnomAD_exomes_AFR_AN | int |
- |
Total allele count in the African/African American gnomAD exome samples v4.0.0
|
 |
[0, 3.35e+04] |
|
| gnomAD_exomes_AFR_AF | float |
- |
Alternative allele frequency in the African/African American gnomAD exome samples v4.0.0
|
 |
[0, 1] |
|
| gnomAD_exomes_AFR_nhomalt | int |
- |
Count of individuals with homozygous alternative allele in the African/African American gnomAD exome samples v4.0.0
|
 |
[0, 1.67e+04] |
|
| gnomAD_exomes_AMR_AC | int |
- |
Alternative allele count in the Latino gnomAD exome samples v4.0.0
|
 |
[0, 4.47e+04] |
|
| gnomAD_exomes_AMR_AN | int |
- |
Total allele count in the Latino gnomAD exome samples v4.0.0
|
 |
[0, 4.47e+04] |
|
| gnomAD_exomes_AMR_AF | float |
- |
Alternative allele frequency in the Latino gnomAD exome samples v4.0.0
|
 |
[0, 1] |
|
| gnomAD_exomes_AMR_nhomalt | int |
- |
Count of individuals with homozygous alternative allele in the Latino gnomAD exome samples v4.0.0
|
 |
[0, 2.24e+04] |
|
| gnomAD_exomes_ASJ_AC | int |
- |
Alternative allele count in the Ashkenazi Jewish gnomAD exome samples v4.0.0
|
 |
[0, 2.61e+04] |
|
| gnomAD_exomes_ASJ_AN | int |
- |
Total allele count in the Ashkenazi Jewish gnomAD exome samples v4.0.0
|
 |
[0, 2.61e+04] |
|
| gnomAD_exomes_ASJ_AF | float |
- |
Alternative allele frequency in the Ashkenazi Jewish gnomAD exome samples v4.0.0
|
 |
[0, 1] |
|
| gnomAD_exomes_ASJ_nhomalt | int |
- |
Count of individuals with homozygous alternative allele in the Ashkenazi Jewish gnomAD exome samples v4.0.0
|
 |
[0, 1.31e+04] |
|
| gnomAD_exomes_EAS_AC | int |
- |
Alternative allele count in the East Asian gnomAD exome samples v4.0.0
|
 |
[0, 3.97e+04] |
|
| gnomAD_exomes_EAS_AN | int |
- |
Total allele count in the East Asian gnomAD exome samples v4.0.0
|
 |
[0, 3.97e+04] |
|
| gnomAD_exomes_EAS_AF | float |
- |
Alternative allele frequency in the East Asian gnomAD exome samples v4.0.0
|
 |
[0, 1] |
|
| gnomAD_exomes_EAS_nhomalt | int |
- |
Count of individuals with homozygous alternative allele in the East Asian gnomAD exome samples v4.0.0
|
 |
[0, 1.98e+04] |
|
| gnomAD_exomes_FIN_AC | int |
- |
Alternative allele count in the Finnish gnomAD exome samples v4.0.0
|
 |
[0, 5.34e+04] |
|
| gnomAD_exomes_FIN_AN | int |
- |
Total allele count in the Finnish gnomAD exome samples v4.0.0
|
 |
[0, 5.34e+04] |
|
| gnomAD_exomes_FIN_AF | float |
- |
Alternative allele frequency in the Finnish gnomAD exome samples v4.0.0
|
 |
[0, 1] |
|
| gnomAD_exomes_FIN_nhomalt | int |
- |
Count of individuals with homozygous alternative allele in the Finnish gnomAD exome samples v4.0.0
|
 |
[0, 2.67e+04] |
|
| gnomAD_exomes_MID_AC | int |
- |
Alternative allele count in the Middle Eastern gnomAD exome samples v4.0.0
|
 |
[0, 5.77e+03] |
|
| gnomAD_exomes_MID_AN | int |
- |
Total allele count in the Middle Eastern gnomAD exome samples v4.0.0
|
 |
[0, 5.77e+03] |
|
| gnomAD_exomes_MID_AF | float |
- |
Alternative allele frequency in the Middle Eastern gnomAD exome samples v4.0.0
|
 |
[0, 1] |
|
| gnomAD_exomes_MID_nhomalt | int |
- |
Count of individuals with homozygous alternative allele in the Middle Eastern gnomAD exome samples v4.0.0
|
 |
[0, 2.88e+03] |
|
| gnomAD_exomes_NFE_AC | int |
- |
Alternative allele count in the Non-Finnish European gnomAD exome samples v4.0.0
|
 |
[0, 1.11e+06] |
|
| gnomAD_exomes_NFE_AN | int |
- |
Total allele count in the Non-Finnish European gnomAD exome samples v4.0.0
|
 |
[0, 1.11e+06] |
|
| gnomAD_exomes_NFE_AF | float |
- |
Alternative allele frequency in the Non-Finnish European gnomAD exome samples v4.0.0
|
 |
[0, 1] |
|
| gnomAD_exomes_NFE_nhomalt | int |
- |
Count of individuals with homozygous alternative allele in the Non-Finnish European gnomAD exome samples v4.0.0
|
 |
[0, 5.56e+05] |
|
| gnomAD_exomes_SAS_AC | int |
- |
Alternative allele count in the South Asian gnomAD exome samples v4.0.0
|
 |
[0, 8.63e+04] |
|
| gnomAD_exomes_SAS_AN | int |
- |
Total allele count in the South Asian gnomAD exome samples v4.0.0
|
 |
[0, 8.63e+04] |
|
| gnomAD_exomes_SAS_AF | float |
- |
Alternative allele frequency in the South Asian gnomAD exome samples v4.0.0
|
 |
[0, 1] |
|
| gnomAD_exomes_SAS_nhomalt | int |
- |
Count of individuals with homozygous alternative allele in the South Asian gnomAD exome samples v4.0.0
|
 |
[0, 4.31e+04] |
|
| gnomAD_exomes_non_ukb_AC | int |
- |
Alternative allele count in the non-UKBiobank subset of whole gnomAD exome samples v4.0.0
|
 |
[0, 6.29e+05] |
|
| gnomAD_exomes_non_ukb_AN | int |
- |
Total allele count in the non-UKBiobank subset of whole gnomAD exome samples v4.0.0
|
 |
[0, 6.29e+05] |
|
| gnomAD_exomes_non_ukb_AF | float |
- |
Alternative allele frequency in the non-UKBiobank subset of whole gnomAD exome samples v4.0.0
|
 |
[0, 1] |
|
| gnomAD_exomes_non_ukb_nhomalt | int |
- |
Count of individuals with homozygous alternative allele in the non-UKBiobank subset of whole gnomAD exome samples v4.0.0
|
 |
[0, 3.14e+05] |
|
| gnomAD_exomes_non_ukb_AFR_AC | int |
- |
Alternative allele count in the non-UKBiobank subset of African/African American gnomAD exome samples v4.0.0
|
 |
[0, 1.77e+04] |
|
| gnomAD_exomes_non_ukb_AFR_AN | int |
- |
Total allele count in the non-UKBiobank subset of African/African American gnomAD exome samples v4.0.0
|
 |
[0, 1.77e+04] |
|
| gnomAD_exomes_non_ukb_AFR_AF | float |
- |
Alternative allele frequency in the non-UKBiobank subset of African/African American gnomAD exome samples v4.0.0
|
 |
[0, 1] |
|
| gnomAD_exomes_non_ukb_AFR_nhomalt | int |
- |
Count of individuals with homozygous alternative allele in the non-UKBiobank subset of African/African American gnomAD exome samples v4.0.0
|
 |
[0, 8.85e+03] |
|
| gnomAD_exomes_non_ukb_AMR_AC | int |
- |
Alternative allele count in the non-UKBiobank subset of Latino gnomAD exome samples v4.0.0
|
 |
[0, 4.37e+04] |
|
| gnomAD_exomes_non_ukb_AMR_AN | int |
- |
Total allele count in the non-UKBiobank subset of Latino gnomAD exome samples v4.0.0
|
 |
[0, 4.37e+04] |
|
| gnomAD_exomes_non_ukb_AMR_AF | float |
- |
Alternative allele frequency in the non-UKBiobank subset of Latino gnomAD exome samples v4.0.0
|
 |
[0, 1] |
|
| gnomAD_exomes_non_ukb_AMR_nhomalt | int |
- |
Count of individuals with homozygous alternative allele in the non-UKBiobank subset of Latino gnomAD exome samples v4.0.0
|
 |
[0, 2.19e+04] |
|
| gnomAD_exomes_non_ukb_ASJ_AC | int |
- |
Alternative allele count in the non-UKBiobank subset of Ashkenazi Jewish gnomAD exome samples v4.0.0
|
 |
[0, 2.1e+04] |
|
| gnomAD_exomes_non_ukb_ASJ_AN | int |
- |
Total allele count in the non-UKBiobank subset of Ashkenazi Jewish gnomAD exome samples v4.0.0
|
 |
[0, 2.1e+04] |
|
| gnomAD_exomes_non_ukb_ASJ_AF | float |
- |
Alternative allele frequency in the non-UKBiobank subset of Ashkenazi Jewish gnomAD exome samples v4.0.0
|
 |
[0, 1] |
|
| gnomAD_exomes_non_ukb_ASJ_nhomalt | int |
- |
Count of individuals with homozygous alternative allele in the non-UKBiobank subset of Ashkenazi Jewish gnomAD exome samples v4.0.0
|
 |
[0, 1.05e+04] |
|
| gnomAD_exomes_non_ukb_EAS_AC | int |
- |
Alternative allele count in the non-UKBiobank subset of East Asian gnomAD exome samples v4.0.0
|
 |
[0, 3.61e+04] |
|
| gnomAD_exomes_non_ukb_EAS_AN | int |
- |
Total allele count in the non-UKBiobank subset of East Asian gnomAD exome samples v4.0.0
|
 |
[0, 3.61e+04] |
|
| gnomAD_exomes_non_ukb_EAS_AF | float |
- |
Alternative allele frequency in the non-UKBiobank subset of East Asian gnomAD exome samples v4.0.0
|
 |
[0, 1] |
|
| gnomAD_exomes_non_ukb_EAS_nhomalt | int |
- |
Count of individuals with homozygous alternative allele in the non-UKBiobank subset of East Asian gnomAD exome samples v4.0.0
|
 |
[0, 1.8e+04] |
|
| gnomAD_exomes_non_ukb_FIN_AC | int |
- |
Alternative allele count in the non-UKBiobank subset of Finnish gnomAD exome samples v4.0.0
|
 |
[0, 5.31e+04] |
|
| gnomAD_exomes_non_ukb_FIN_AN | int |
- |
Total allele count in the non-UKBiobank subset of Finnish gnomAD exome samples v4.0.0
|
 |
[0, 5.31e+04] |
|
| gnomAD_exomes_non_ukb_FIN_AF | float |
- |
Alternative allele frequency in the non-UKBiobank subset of Finnish gnomAD exome samples v4.0.0
|
 |
[0, 1] |
|
| gnomAD_exomes_non_ukb_FIN_nhomalt | int |
- |
Count of individuals with homozygous alternative allele in the non-UKBiobank subset of Finnish gnomAD exome samples v4.0.0
|
 |
[0, 2.66e+04] |
|
| gnomAD_exomes_non_ukb_MID_AC | int |
- |
Alternative allele count in the non-UKBiobank subset of Middle Eastern gnomAD exome samples v4.0.0
|
 |
[0, 4.15e+03] |
|
| gnomAD_exomes_non_ukb_MID_AN | int |
- |
Total allele count in the non-UKBiobank subset of Middle Eastern gnomAD exome samples v4.0.0
|
 |
[0, 4.15e+03] |
|
| gnomAD_exomes_non_ukb_MID_AF | float |
- |
Alternative allele frequency in the non-UKBiobank subset of Middle Eastern gnomAD exome samples v4.0.0
|
 |
[0, 1] |
|
| gnomAD_exomes_non_ukb_MID_nhomalt | int |
- |
Count of individuals with homozygous alternative allele in the non-UKBiobank subset of Middle Eastern gnomAD exome samples v4.0.0
|
 |
[0, 2.07e+03] |
|
| gnomAD_exomes_non_ukb_NFE_AC | int |
- |
Alternative allele count in the non-UKBiobank subset of Non-Finnish European gnomAD exome samples v4.0.0
|
 |
[0, 3.5e+05] |
|
| gnomAD_exomes_non_ukb_NFE_AN | int |
- |
Total allele count in the non-UKBiobank subset of Non-Finnish European gnomAD exome samples v4.0.0
|
 |
[0, 3.5e+05] |
|
| gnomAD_exomes_non_ukb_NFE_AF | float |
- |
Alternative allele frequency in the non-UKBiobank subset of Non-Finnish European gnomAD exome samples v4.0.0
|
 |
[0, 1] |
|
| gnomAD_exomes_non_ukb_NFE_nhomalt | int |
- |
Count of individuals with homozygous alternative allele in the non-UKBiobank subset of Non-Finnish European gnomAD exome samples v4.0.0
|
 |
[0, 1.75e+05] |
|
| gnomAD_exomes_non_ukb_SAS_AC | int |
- |
Alternative allele count in the non-UKBiobank subset of South Asian gnomAD exome samples v4.0.0
|
 |
[0, 6.98e+04] |
|
| gnomAD_exomes_non_ukb_SAS_AN | int |
- |
Total allele count in the non-UKBiobank subset of South Asian gnomAD exome samples v4.0.0
|
 |
[0, 6.98e+04] |
|
| gnomAD_exomes_non_ukb_SAS_AF | float |
- |
Alternative allele frequency in the non-UKBiobank subset of South Asian gnomAD exome samples v4.0.0
|
 |
[0, 1] |
|
| gnomAD_exomes_non_ukb_SAS_nhomalt | int |
- |
Count of individuals with homozygous alternative allele in the non-UKBiobank subset of South Asian gnomAD exome samples v4.0.0
|
 |
[0, 3.49e+04] |
|
| gnomAD_genomes_flag | str |
- |
information from gnomAD genome data indicating whether the variant falling within low-complexity (lcr) or segmental duplication (segdup) or decoy regions. The flag can be either "." for high-quality PASS or not reported/polymorphic in gnomAD exomes, "lcr" for within lcr, "segdup" for within segdup, or "decoy" for with decoy region.
|
 |
., segdup, lcr, lcr;segdup | |
| gnomAD_genomes_AC | int |
- |
Alternative allele count in the whole gnomAD genome samples v4.0.0 For mtDNA, this is sum of AC_hom ("Allele count restricted to variants with a heteroplasmy level >= 0.95") and AC_het ("Allele count restricted to variants with a heteroplasmy level >= 0.10 and < 0.95")
|
 |
[1, 1.52e+05] |
|
| gnomAD_genomes_AN | int |
- |
Total allele count in the whole gnomAD genome samples v4.0.0
|
 |
[4, 1.52e+05] |
|
| gnomAD_genomes_AF | float |
- |
Alternative allele frequency in the whole gnomAD genome samples v4.0.0 For mtDNA, this is sum of AF_hom ("Allele frequency restricted to variants with a heteroplasmy level >= 0.95") and AF_het ("Allele frequency restricted to variants with a heteroplasmy level >= 0.10 and < 0.95")
|
 |
[6.56e-06, 1] |
|
| gnomAD_genomes_nhomalt | int |
- |
Count of individuals with homozygous alternative allele in the whole gnomAD genome samples v4.0.0 For mtDNA, this is AC_hom ("Allele count restricted to variants with a heteroplasmy level >= 0.95")
|
 |
[0, 7.62e+04] |
|
| gnomAD_genomes_POPMAX_AC | int |
- |
Allele count in the population with the maximum AF
|
 |
[0, 6.76e+04] |
|
| gnomAD_genomes_POPMAX_AN | int |
- |
Total number of alleles in the population with the maximum AF
|
 |
[2, 6.81e+04] |
|
| gnomAD_genomes_POPMAX_AF | float |
- |
Maximum allele frequency across populations (excluding samples of Ashkenazi, Finnish, and indeterminate ancestry)
|
 |
[0, 1] |
|
| gnomAD_genomes_POPMAX_nhomalt | int |
- |
Count of homozygous individuals in the population with the maximum allele frequency
|
 |
[0, 3.36e+04] |
|
| gnomAD_genomes_AFR_AC | int |
- |
Alternative allele count in the African/African American gnomAD genome samples v4.0.0 For mtDNA, this is sum of AC_hom ("Allele count restricted to variants with a heteroplasmy level >= 0.95") and AC_het ("Allele count restricted to variants with a heteroplasmy level >= 0.10 and < 0.95")
|
 |
[0, 4.16e+04] |
|
| gnomAD_genomes_AFR_AN | int |
- |
Total allele count in the African/African American gnomAD genome samples v4.0.0
|
 |
[0, 4.16e+04] |
|
| gnomAD_genomes_AFR_AF | float |
- |
Alternative allele frequency in the African/African American gnomAD genome samples v4.0.0 For mtDNA, this is sum of AF_hom ("Allele frequency restricted to variants with a heteroplasmy level >= 0.95") and AF_het ("Allele frequency restricted to variants with a heteroplasmy level >= 0.10 and < 0.95")
|
 |
[0, 1] |
|
| gnomAD_genomes_AFR_nhomalt | int |
- |
Count of individuals with homozygous alternative allele in the African/African American gnomAD genome samples v4.0.0 For mtDNA, this is AC_hom ("Allele count restricted to variants with a heteroplasmy level >= 0.95")
|
 |
[0, 2.08e+04] |
|
| gnomAD_genomes_AMI_AC | int |
- |
Alternative allele count in the Amish gnomAD genome samples v4.0.0 For mtDNA, this is sum of AC_hom ("Allele count restricted to variants with a heteroplasmy level >= 0.95") and AC_het ("Allele count restricted to variants with a heteroplasmy level >= 0.10 and < 0.95")
|
 |
[0, 912] |
|
| gnomAD_genomes_AMI_AN | int |
- |
Total allele count in the Amish gnomAD genome samples v4.0.0
|
 |
[0, 912] |
|
| gnomAD_genomes_AMI_AF | float |
- |
Alternative allele frequency in the Amish gnomAD genome samples v4.0.0 For mtDNA, this is sum of AF_hom ("Allele frequency restricted to variants with a heteroplasmy level >= 0.95") and AF_het ("Allele frequency restricted to variants with a heteroplasmy level >= 0.10 and < 0.95")
|
 |
[0, 1] |
|
| gnomAD_genomes_AMI_nhomalt | int |
- |
Count of individuals with homozygous alternative allele in the Amish gnomAD genome samples v4.0.0 For mtDNA, this is AC_hom ("Allele count restricted to variants with a heteroplasmy level >= 0.95")
|
 |
[0, 456] |
|
| gnomAD_genomes_AMR_AC | int |
- |
Alternative allele count in the Latino gnomAD genome samples v4.0.0 For mtDNA, this is sum of AC_hom ("Allele count restricted to variants with a heteroplasmy level >= 0.95") and AC_het ("Allele count restricted to variants with a heteroplasmy level >= 0.10 and < 0.95")
|
 |
[0, 1.53e+04] |
|
| gnomAD_genomes_AMR_AN | int |
- |
Total allele count in the Latino gnomAD genome samples v4.0.0
|
 |
[0, 1.53e+04] |
|
| gnomAD_genomes_AMR_AF | float |
- |
Alternative allele frequency in the Latino gnomAD genome samples v4.0.0 For mtDNA, this is sum of AF_hom ("Allele frequency restricted to variants with a heteroplasmy level >= 0.95") and AF_het ("Allele frequency restricted to variants with a heteroplasmy level >= 0.10 and < 0.95")
|
 |
[0, 1] |
|
| gnomAD_genomes_AMR_nhomalt | int |
- |
Count of individuals with homozygous alternative allele in the Latino gnomAD genome samples v4.0.0 For mtDNA, this is AC_hom ("Allele count restricted to variants with a heteroplasmy level >= 0.95")
|
 |
[0, 7.66e+03] |
|
| gnomAD_genomes_ASJ_AC | int |
- |
Alternative allele count in the Ashkenazi Jewish gnomAD genome samples v4.0.0 For mtDNA, this is sum of AC_hom ("Allele count restricted to variants with a heteroplasmy level >= 0.95") and AC_het ("Allele count restricted to variants with a heteroplasmy level >= 0.10 and < 0.95")
|
 |
[0, 3.47e+03] |
|
| gnomAD_genomes_ASJ_AN | int |
- |
Total allele count in the Ashkenazi Jewish gnomAD genome samples v4.0.0
|
 |
[0, 3.47e+03] |
|
| gnomAD_genomes_ASJ_AF | float |
- |
Alternative allele frequency in the Ashkenazi Jewish gnomAD genome samples v4.0.0 For mtDNA, this is sum of AF_hom ("Allele frequency restricted to variants with a heteroplasmy level >= 0.95") and AF_het ("Allele frequency restricted to variants with a heteroplasmy level >= 0.10 and < 0.95")
|
 |
[0, 1] |
|
| gnomAD_genomes_ASJ_nhomalt | int |
- |
Count of individuals with homozygous alternative allele in the Ashkenazi Jewish gnomAD genome samples v4.0.0 For mtDNA, this is AC_hom ("Allele count restricted to variants with a heteroplasmy level >= 0.95")
|
 |
[0, 1.74e+03] |
|
| gnomAD_genomes_EAS_AC | int |
- |
Alternative allele count in the East Asian gnomAD genome samples v4.0.0 For mtDNA, this is sum of AC_hom ("Allele count restricted to variants with a heteroplasmy level >= 0.95") and AC_het ("Allele count restricted to variants with a heteroplasmy level >= 0.10 and < 0.95")
|
 |
[0, 5.2e+03] |
|
| gnomAD_genomes_EAS_AN | int |
- |
Total allele count in the East Asian gnomAD genome samples v4.0.0
|
 |
[0, 5.21e+03] |
|
| gnomAD_genomes_EAS_AF | float |
- |
Alternative allele frequency in the East Asian gnomAD genome samples v4.0.0 For mtDNA, this is sum of AF_hom ("Allele frequency restricted to variants with a heteroplasmy level >= 0.95") and AF_het ("Allele frequency restricted to variants with a heteroplasmy level >= 0.10 and < 0.95")
|
 |
[0, 1] |
|
| gnomAD_genomes_EAS_nhomalt | int |
- |
Count of individuals with homozygous alternative allele in the East Asian gnomAD genome samples v4.0.0 For mtDNA, this is AC_hom ("Allele count restricted to variants with a heteroplasmy level >= 0.95")
|
 |
[0, 2.6e+03] |
|
| gnomAD_genomes_FIN_AC | int |
- |
Alternative allele count in the Finnish gnomAD genome samples v4.0.0 For mtDNA, this is sum of AC_hom ("Allele count restricted to variants with a heteroplasmy level >= 0.95") and AC_het ("Allele count restricted to variants with a heteroplasmy level >= 0.10 and < 0.95")
|
 |
[0, 1.06e+04] |
|
| gnomAD_genomes_FIN_AN | int |
- |
Total allele count in the Finnish gnomAD genome samples v4.0.0
|
 |
[0, 1.06e+04] |
|
| gnomAD_genomes_FIN_AF | float |
- |
Alternative allele frequency in the Finnish gnomAD genome samples v4.0.0 For mtDNA, this is sum of AF_hom ("Allele frequency restricted to variants with a heteroplasmy level >= 0.95") and AF_het ("Allele frequency restricted to variants with a heteroplasmy level >= 0.10 and < 0.95")
|
 |
[0, 1] |
|
| gnomAD_genomes_FIN_nhomalt | int |
- |
Count of individuals with homozygous alternative allele in the Finnish gnomAD genome samples v4.0.0 For mtDNA, this is AC_hom ("Allele count restricted to variants with a heteroplasmy level >= 0.95")
|
 |
[0, 5.32e+03] |
|
| gnomAD_genomes_MID_AC | int |
- |
Alternative allele count in the Middle Eastern gnomAD genome samples v4.0.0 For mtDNA, this is sum of AC_hom ("Allele count restricted to variants with a heteroplasmy level >= 0.95") and AC_het ("Allele count restricted to variants with a heteroplasmy level >= 0.10 and < 0.95")
|
 |
[0, 294] |
|
| gnomAD_genomes_MID_AN | int |
- |
Total allele count in the Middle Eastern gnomAD genome samples v4.0.0
|
 |
[0, 316] |
|
| gnomAD_genomes_MID_AF | float |
- |
Alternative allele frequency in the Middle Eastern gnomAD genome samples v4.0.0 For mtDNA, this is sum of AF_hom ("Allele frequency restricted to variants with a heteroplasmy level >= 0.95") and AF_het ("Allele frequency restricted to variants with a heteroplasmy level >= 0.10 and < 0.95")
|
 |
[0, 1] |
|
| gnomAD_genomes_MID_nhomalt | int |
- |
Count of individuals with homozygous alternative allele in the Middle Eastern gnomAD genome samples v4.0.0 For mtDNA, this is AC_hom ("Allele count restricted to variants with a heteroplasmy level >= 0.95")
|
 |
[0, 147] |
|
| gnomAD_genomes_NFE_AC | int |
- |
Alternative allele count in the Non-Finnish European gnomAD genome samples v4.0.0 For mtDNA, this is sum of AC_hom ("Allele count restricted to variants with a heteroplasmy level >= 0.95") and AC_het ("Allele count restricted to variants with a heteroplasmy level >= 0.10 and < 0.95")
|
 |
[0, 6.8e+04] |
|
| gnomAD_genomes_NFE_AN | int |
- |
Total allele count in the Non-Finnish European gnomAD genome samples v4.0.0
|
 |
[2, 6.81e+04] |
|
| gnomAD_genomes_NFE_AF | float |
- |
Alternative allele frequency in the Non-Finnish European gnomAD genome samples v4.0.0 For mtDNA, this is sum of AF_hom ("Allele frequency restricted to variants with a heteroplasmy level >= 0.95") and AF_het ("Allele frequency restricted to variants with a heteroplasmy level >= 0.10 and < 0.95")
|
 |
[0, 1] |
|
| gnomAD_genomes_NFE_nhomalt | int |
- |
Count of individuals with homozygous alternative allele in the Non-Finnish European gnomAD genome samples v4.0.0 For mtDNA, this is AC_hom ("Allele count restricted to variants with a heteroplasmy level >= 0.95")
|
 |
[0, 3.4e+04] |
|
| gnomAD_genomes_SAS_AC | int |
- |
Alternative allele count in the South Asian gnomAD genome samples v4.0.0 For mtDNA, this is sum of AC_hom ("Allele count restricted to variants with a heteroplasmy level >= 0.95") and AC_het ("Allele count restricted to variants with a heteroplasmy level >= 0.10 and < 0.95")
|
 |
[0, 4.83e+03] |
|
| gnomAD_genomes_SAS_AN | int |
- |
Total allele count in the South Asian gnomAD genome samples v4.0.0
|
 |
[0, 4.84e+03] |
|
| gnomAD_genomes_SAS_AF | float |
- |
Alternative allele frequency in the South Asian gnomAD genome samples v4.0.0 For mtDNA, this is sum of AF_hom ("Allele frequency restricted to variants with a heteroplasmy level >= 0.95") and AF_het ("Allele frequency restricted to variants with a heteroplasmy level >= 0.10 and < 0.95")
|
 |
[0, 1] |
|
| gnomAD_genomes_SAS_nhomalt | int |
- |
Count of individuals with homozygous alternative allele in the South Asian gnomAD genome samples v4.0.0 For mtDNA, this is AC_hom ("Allele count restricted to variants with a heteroplasmy level >= 0.95")
|
 |
[0, 2.42e+03] |
|
| ALFA_European_AC | int |
- |
Alternative allele count of the European samples in the Allele Frequency Aggregator
|
 |
[0, 3.07e+05] |
|
| ALFA_European_AN | int |
- |
Total allele count of the European samples in the Allele Frequency Aggregator
|
 |
[0, 3.26e+05] |
|
| ALFA_European_AF | float |
- |
Alternative allele frequency of the European samples in the Allele Frequency Aggregator
|
 |
[0, 1] |
|
| ALFA_African_Others_AC | int |
- |
Alternative allele count of the individuals with African ancestry in the Allele Frequency Aggregator
|
 |
[0, 420] |
|
| ALFA_African_Others_AN | int |
- |
Total allele count of the individuals with African ancestry in the Allele Frequency Aggregator
|
 |
[0, 422] |
|
| ALFA_African_Others_AF | float |
- |
Alternative allele frequency of the individuals with African ancestry in the Allele Frequency Aggregator
|
 |
[0, 1] |
|
| ALFA_East_Asian_AC | int |
- |
Alternative allele count of the East Asian samples in the Allele Frequency Aggregator
|
 |
[0, 5.03e+03] |
|
| ALFA_East_Asian_AN | int |
- |
Total allele count of the East Asian samples in the Allele Frequency Aggregator
|
 |
[0, 5.03e+03] |
|
| ALFA_East_Asian_AF | float |
- |
Alternative allele frequency of the East Asian samples in the Allele Frequency Aggregator
|
 |
[0, 1] |
|
| ALFA_African_American_AC | int |
- |
Alternative allele count of the African American samples in the Allele Frequency Aggregator
|
 |
[0, 1.17e+04] |
|
| ALFA_African_American_AN | int |
- |
Total allele count of the African American samples in the Allele Frequency Aggregator
|
 |
[0, 1.2e+04] |
|
| ALFA_African_American_AF | float |
- |
Alternative allele frequency of the African American samples in the Allele Frequency Aggregator
|
 |
[0, 1] |
|
| ALFA_Latin_American_1_AC | int |
- |
Alternative allele count of the Latin American individiuals with Afro-Caribbean ancestry in the Allele Frequency Aggregator
|
 |
[0, 1.55e+03] |
|
| ALFA_Latin_American_1_AN | int |
- |
Total allele count of the Latin American individiuals with Afro-Caribbean ancestry in the Allele Frequency Aggregator
|
 |
[0, 1.63e+03] |
|
| ALFA_Latin_American_1_AF | float |
- |
Alternative allele frequency of the Latin American individiuals with Afro-Caribbean ancestry in the Allele Frequency Aggregator
|
 |
[0, 1] |
|
| ALFA_Latin_American_2_AC | int |
- |
Alternative allele count of the Latin American individiuals with mostly European and Native American Ancestry in the Allele Frequency Aggregator
|
 |
[0, 8.95e+03] |
|
| ALFA_Latin_American_2_AN | int |
- |
Total allele count of the Latin American individiuals with mostly European and Native American Ancestry in the Allele Frequency Aggregator
|
 |
[0, 9.41e+03] |
|
| ALFA_Latin_American_2_AF | float |
- |
Alternative allele frequency of the Latin American individiuals with mostly European and Native American Ancestry in the Allele Frequency Aggregator
|
 |
[0, 1] |
|
| ALFA_Other_Asian_AC | int |
- |
Alternative allele count of the Asian individiuals excluding South or East Asian in the Allele Frequency Aggregator
|
 |
[0, 2e+03] |
|
| ALFA_Other_Asian_AN | int |
- |
Total allele count of the Asian individiuals excluding South or East Asian in the Allele Frequency Aggregator
|
 |
[0, 2e+03] |
|
| ALFA_Other_Asian_AF | float |
- |
Alternative allele frequency of the Asian individiuals excluding South or East Asian in the Allele Frequency Aggregator
|
 |
[0, 1] |
|
| ALFA_South_Asian_AC | int |
- |
Alternative allele count of the South Asian samples in the Allele Frequency Aggregator
|
 |
[0, 5.22e+03] |
|
| ALFA_South_Asian_AN | int |
- |
Total allele count of the South Asian samples in the Allele Frequency Aggregator
|
 |
[0, 5.24e+03] |
|
| ALFA_South_Asian_AF | float |
- |
Alternative allele frequency of the South Asian samples in the Allele Frequency Aggregator
|
 |
[0, 1] |
|
| ALFA_Other_AC | int |
- |
Alternative allele count of the samples whose self-reported population is inconsistent with the GRAF-assigned population in the Allele Frequency Aggregator
|
 |
[0, 2.2e+04] |
|
| ALFA_Other_AN | int |
- |
Total allele count of the samples whose self-reported population is inconsistent with the GRAF-assigned population in the Allele Frequency Aggregator
|
 |
[0, 2.33e+04] |
|
| ALFA_Other_AF | float |
- |
Alternative allele frequency of the samples whose self-reported population is inconsistent with the GRAF-assigned population in the Allele Frequency Aggregator
|
 |
[0, 1] |
|
| ALFA_African_AC | int |
- |
Alternative allele count of the all African samples (African_Others and African_American) in the Allele Frequency Aggregator
|
 |
[0, 1.21e+04] |
|
| ALFA_African_AN | int |
- |
Total allele count of the all African samples (African_Others and African_American) in the Allele Frequency Aggregator
|
 |
[0, 1.24e+04] |
|
| ALFA_African_AF | float |
- |
Alternative allele frequency of the all African samples (African_Others and African_American) in the Allele Frequency Aggregator
|
 |
[0, 1] |
|
| ALFA_Asian_AC | int |
- |
Alternative allele count of the all Asian individuals (East_Asian and Other_Asian, excluding South_Asian) in the Allele Frequency Aggregator
|
 |
[0, 7.03e+03] |
|
| ALFA_Asian_AN | int |
- |
Total allele count of the all Asian individuals (East_Asian and Other_Asian, excluding South_Asian) in the Allele Frequency Aggregator
|
 |
[0, 7.03e+03] |
|
| ALFA_Asian_AF | float |
- |
Alternative allele frequency of the all Asian individuals (East_Asian and Other_Asian, excluding South_Asian) in the Allele Frequency Aggregator
|
 |
[0, 1] |
|
| ALFA_Total_AC | int |
- |
Alternative allele count of the total samples in the Allele Frequency Aggregator
|
 |
[0, 3.59e+05] |
|
| ALFA_Total_AN | int |
- |
Total allele count of the total samples in the Allele Frequency Aggregator
|
 |
[0, 3.85e+05] |
|
| ALFA_Total_AF | float |
- |
Alternative allele frequency of the total samples in the Allele Frequency Aggregator
|
 |
[0, 1] |
|
| clinvar_id | int |
- |
clinvar variation ID
|
 |
[4, 3.26e+06] |
|
| clinvar_clnsig | str |
- |
clinical significance by clinvar Possible values: Benign, Likely_benign, Likely_pathogenic, Pathogenic, drug_response, histocompatibility. A negative score means the score is for the ref allele
|
 |
., Uncertain_significance, Conflicting_classifications_of_pathogenicity, Likely_benign, Pathogenic, Likely_pathogenic, Benign, Pathogenic/Likely_pathogenic, Benign/Likely_benign, not_provided, other, drug_response, no_classification_for_the_single_variant, risk_factor, Uncertain_significance/Uncertain_risk_allele, association, Affects, Likely_risk_allele, Pathogenic|other, Pathogenic|drug_response, Other | |
| clinvar_trait | str |
- |
the trait/disease the clinvar_clnsig referring to
|
No histogram: Too many unique values 101 for categorical histogram. |
NO DOMAIN | |
| clinvar_review | str |
- |
ClinVar Review Status summary Possible values: no assertion criteria provided, criteria provided, single submitter, criteria provided, multiple submitters, no conflicts, reviewed by expert panel, practice guideline
|
 |
., criteria_provided,_single_submitter, criteria_provided,_multiple_submitters,_no_conflicts, criteria_provided,_conflicting_classifications, no_assertion_criteria_provided, reviewed_by_expert_panel, no_classification_provided, no_classification_for_the_single_variant, no_classifications_from_unflagged_records, practice_guideline | |
| clinvar_hgvs | str |
- |
variant in HGVS format
|
No histogram: Too many unique values 101 for categorical histogram. |
NO DOMAIN | |
| clinvar_var_source | str |
- |
source of the variant
|
No histogram: Too many unique values 101 for categorical histogram. |
NO DOMAIN | |
| clinvar_MedGen_id | str |
- |
MedGen ID of the trait/disease the clinvar_trait referring to
|
No histogram: Too many unique values 101 for categorical histogram. |
NO DOMAIN | |
| clinvar_OMIM_id | str |
- |
OMIM ID of the trait/disease the clinvar_trait referring to
|
No histogram: Too many unique values 101 for categorical histogram. |
NO DOMAIN | |
| clinvar_Orphanet_id | str |
- |
Orphanet ID of the trait/disease the clinvar_trait referring to
|
No histogram: Too many unique values 101 for categorical histogram. |
NO DOMAIN | |
| Interpro_domain | str |
- |
domain or conserved site on which the variant locates. Domain annotations come from Interpro database. The number in the brackets following a specific domain is the count of times Interpro assigns the variant position to that domain, typically coming from different predicting databases. Multiple entries separated by ";".
|
No histogram: Too many unique values 101 for categorical histogram. |
NO DOMAIN | |
| GTEx_V8_eQTL_gene | str |
- |
target gene of the (significant) eQTL SNP
|
No histogram: Too many unique values 101 for categorical histogram. |
NO DOMAIN | |
| GTEx_V8_eQTL_tissue | str |
- |
tissue type of the expression data with which the eQTL/gene pair is detected
|
No histogram: Too many unique values 101 for categorical histogram. |
NO DOMAIN | |
| GTEx_V8_sQTL_gene | str |
- |
target gene of the (significant) sQTL SNP
|
No histogram: Too many unique values 101 for categorical histogram. |
NO DOMAIN | |
| GTEx_V8_sQTL_tissue | str |
- |
tissue type of the expression data with which the sQTL/gene pair is detected
|
No histogram: Too many unique values 101 for categorical histogram. |
NO DOMAIN | |
| eQTLGen_snp_id | str |
- |
id of the eQTL SNP
|
No histogram: Too many unique values 101 for categorical histogram. |
NO DOMAIN | |
| eQTLGen_gene_id | str |
- |
id of the target gene of the (significant) eQTL SNP
|
No histogram: Too many unique values 101 for categorical histogram. |
NO DOMAIN | |
| eQTLGen_gene_symbol | str |
- |
symbol of the target gene of the (significant) eQTL SNP
|
No histogram: Too many unique values 101 for categorical histogram. |
NO DOMAIN | |
| eQTLGen_cis_or_trans | str |
- |
eQTL type, cis or trans
|
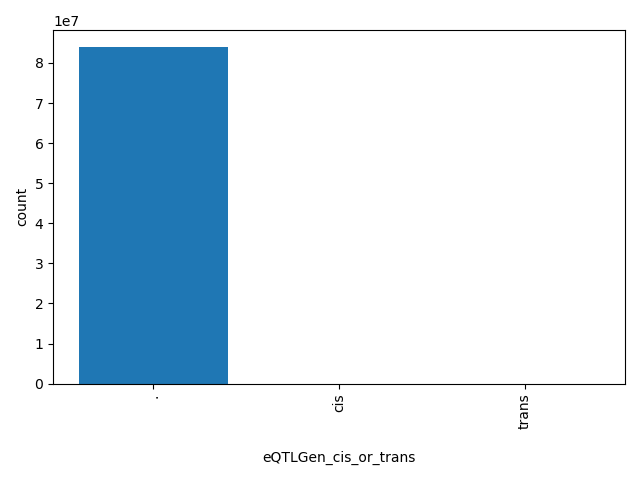 |
., cis, trans | |
| Geuvadis_eQTL_target_gene | str |
- |
Ensembl gene ID of the eQTL associated with, from the Geuvadis project Note 1: Missing data is designated as '.'. Columns of dbNSFP_gene: Gene_name: Gene symbol from HGNC Ensembl_gene: Ensembl gene id (from HGNC) chr: Chromosome number (from HGNC)
|
No histogram: Can not merge categorical histograms; too many unique values 127 |
NO DOMAIN |
n counts alleles; sd is the population standard deviation.
Alleles
| Chromosome | Alleles | substitution % | insertion % | deletion % | complex % | other % |
|---|---|---|---|---|---|---|
| all chromosomes | 84013093 | 100.00% | 0.00% | 0.00% | 0.00% | 0.00% |
| chr1 | 8538792 | 100.00% | 0.00% | 0.00% | 0.00% | 0.00% |
| chr2 | 6189596 | 100.00% | 0.00% | 0.00% | 0.00% | 0.00% |
| chr3 | 4809268 | 100.00% | 0.00% | 0.00% | 0.00% | 0.00% |
| chr4 | 3377635 | 100.00% | 0.00% | 0.00% | 0.00% | 0.00% |
| chr5 | 3850961 | 100.00% | 0.00% | 0.00% | 0.00% | 0.00% |
| chr6 | 4258345 | 100.00% | 0.00% | 0.00% | 0.00% | 0.00% |
| chr7 | 3944518 | 100.00% | 0.00% | 0.00% | 0.00% | 0.00% |
| chr8 | 2850700 | 100.00% | 0.00% | 0.00% | 0.00% | 0.00% |
| chr9 | 3388601 | 100.00% | 0.00% | 0.00% | 0.00% | 0.00% |
| chr10 | 3278725 | 100.00% | 0.00% | 0.00% | 0.00% | 0.00% |
| chr11 | 4936502 | 100.00% | 0.00% | 0.00% | 0.00% | 0.00% |
| chr12 | 4394901 | 100.00% | 0.00% | 0.00% | 0.00% | 0.00% |
| chr13 | 1529171 | 100.00% | 0.00% | 0.00% | 0.00% | 0.00% |
| chr14 | 2637188 | 100.00% | 0.00% | 0.00% | 0.00% | 0.00% |
| chr15 | 2910583 | 100.00% | 0.00% | 0.00% | 0.00% | 0.00% |
| chr16 | 3539430 | 100.00% | 0.00% | 0.00% | 0.00% | 0.00% |
| chr17 | 4807812 | 100.00% | 0.00% | 0.00% | 0.00% | 0.00% |
| chr18 | 1333140 | 100.00% | 0.00% | 0.00% | 0.00% | 0.00% |
| chr19 | 5520493 | 100.00% | 0.00% | 0.00% | 0.00% | 0.00% |
| chr20 | 1989000 | 100.00% | 0.00% | 0.00% | 0.00% | 0.00% |
| chr21 | 838536 | 100.00% | 0.00% | 0.00% | 0.00% | 0.00% |
| chr22 | 1731139 | 100.00% | 0.00% | 0.00% | 0.00% | 0.00% |
| chrM | 22931 | 100.00% | 0.00% | 0.00% | 0.00% | 0.00% |
| chrX | 3168153 | 100.00% | 0.00% | 0.00% | 0.00% | 0.00% |
| chrY | 166973 | 100.00% | 0.00% | 0.00% | 0.00% | 0.00% |
Substitution matrix
| ref → alt | A | C | G | T |
|---|---|---|---|---|
| A | 0 0.00% | 7208104 8.58% | 6050195 7.20% | 7263235 8.65% |
| C | 7657876 9.12% | 0 0.00% | 7876037 9.37% | 5971903 7.11% |
| G | 5959819 7.09% | 7851070 9.35% | 0 0.00% | 7636918 9.09% |
| T | 7271238 8.65% | 6048998 7.20% | 7217700 8.59% | 0 0.00% |
Indel lengths
| alleles | min | max | mean | median | |
|---|---|---|---|---|---|
| insertions | 0 | ||||
| deletions | 0 |
no insertions
no deletions
Complex alleles
no complex alleles
Files
| Filename | Size | md5 |
|---|---|---|
| PrepGenRes.py | 8.21 KB | 26b99e8483a09bc171254e1043048492 |
| build.sh | 1.23 KB | 8ad4c1155b0fe337499fe9607a23070d |
| dbNSFP4.9a.gz | 36.79 GB | 1f3e8e14b401b05cf61b25decdaa8692 |
| dbNSFP4.9a.gz.tbi | 843.0 KB | 4d7b91406fd25a7e2b1dc76e7d9645f5 |
| dbNSFP4.9a.readme.txt | 129.93 KB | 0024508a2ed89eed969d799a40620105 |
| genomic_resource.yaml | 109.45 KB | 7b0987c5acf1e00f52bf7ff5368f13e4 |
| statistics/ |