The purpose of this lab is to introduce students to the laboratory setting (including safety) and learn the process of observation, instrument usage and data recording. In the laboratory environment, you will encounter many different types of instruments and equipment. In this lab you will learn how balances are used to measure the mass of an object (weight is the effect of gravity on the mass of an object). You will use a thermometer to measure temperature. A metric ruler (commonly referred to as a meter stick) will be used to measure distances that may be the length, height or width of some object. Finally, graduated cylinders will be used to measure volumes of liquids.
Scientists, nurses and employees in the health care industry must have the skills to carry out laboratory procedures, take measurements, and report results accurately and clearly. How well they do these things can determine the success of an experiment and even life or death of a patient. The system of measurement used in science, hospitals, and clinics around the world is the metric system. The metric system is a decimal system in which measurements of each type are related by factors of 10. For example, you use a decimal system when you change U.S. money 1 dime is the same as 10 cents or one cent is 1/10 of a dime. A dime and a cent are related by a factor of 10 as is the relationship between a dime and a dollar.
Most of the rest of the world uses the metric system only. The most common metric units are listed in Table LM.1.
|
Measurement |
Metric Unit |
Symbol |
|---|---|---|
|
Length |
meter, centimeter or millimeter |
m, cm or mm |
|
Mass |
kilogram or gram |
kg or g |
|
Volume |
liter or milliliter |
L or mL |
|
Temperature |
Celsius or Kelvin |
|
|
Time |
second |
s |
A unit must always be included when reporting a measurement. For example, 5.0 m indicates a quantity of 5.0 meters. Without the unit, we would not know the system of measurement used to obtain the number 5.0. It could have been 5.0 feet, 5.0 kilometers, or 5.0 inches. Thus, a unit is required to complete the measurement reported. For larger and/or smaller measurements, prefixes are attached in front of the standard unit. Some prefixes such as kilo are used for larger quantities; other prefixes such as milli are used for smaller quantities. The most common prefixes are listed in Table LM.2.
|
Prefix |
Symbol |
Factor multiplied by the basic unit |
|---|---|---|
|
kilo |
k |
1000 or |
|
deci |
d |
0.1 or 1/10 or |
|
centi |
c |
0.01 or 1/100 or |
|
milli |
m |
0.001 or 1/1000 or |
|
micro |
|
0.000001 or 1/1,000,000 or |
Using Table LM.2, if you have measured 5.0 g, then the number of kilograms measured is:
When we measure the length, volume, or mass of an object, the numbers we report are called measured numbers. Suppose you stepped on a scale this morning and noted you weighed 145 lb. Your scale is a measuring tool and your weight is a measured number. Each time we use a measuring tool to determine a quantity; the result is a measured number.
Exact numbers are obtained when we count objects. Suppose you counted 5 beakers in your laboratory drawer. The number 5 is an exact number. You did not use a measuring tool to obtain the number. Exact numbers are also found in the numbers that define a relationship between two metric units or between two U.S. units. For example, the numbers in the following definitions are exact: 1 meter is equal to 100 cm; 1 foot has 12 inches. See Table LM.3.
|
Example |
Solution |
|---|---|
|
14 inches |
measured |
|
14 pencils |
exact |
|
60 minutes in 1 hour |
exact (definition) |
|
7.5 kg |
measured |
In measured numbers, all the reported figures are called significant figures. The first significant figure is the first nonzero digit. The last significant figure is always the estimated digit. Zeros between other digits or at the end of a decimal number are counted as significant figures. However, leading zeros are not significant; they are placeholders. Zeros are not significant in large numbers with no decimal points; they are placeholders needed to express the magnitude of the number. When a number is written in scientific notation, all the figures in the coefficient are significant.
|
Example |
Solution |
Explanation |
|---|---|---|
|
455.2 cm |
4 |
All nonzero digits are significant. |
|
0.80 m |
2 |
Trailing zeros in a decimal number are significant. |
|
50.2 L |
3 |
A zero between nonzero digits is significant. |
|
0.0005 lb |
1 |
Leading zeros are not significant. |
|
25,000 ft |
2 |
Placeholder zeros are not significant. |
|
0.00580 m |
3 |
Leading zeros are not significant; trailing zeros in a decimal number are significant |
Calculations involving measurements must reflect the certainty of the measurements themselves. This means the calculated result must follow specific significant figure rules:
The calculated result must have the same number of significant figures as the measurement with the least number of significant figures.
Example: When multiplying a length of 15 m by a width of 200 m to obtain an area.
We cannot leave the resulting area as 4,625 m
The calculated result must have the same number of decimal places as the measurement with the least number of decimal places.
Example: When adding two masses (25.0 g and 38.2 g) together to calculate a total mass.
This is the correct answer because both 75.0 g and 38.2 g have one decimal place. So the final answer will also have one decimal place.
Exact numbers are considered to have an infinite number of significant figures because they are not measurements. This means when you perform a calculation like Equation LM.1 to convert 5.0 g to kilograms, the 1 kg/1000 g does not impact the final result because the conversion factor contains exact numbers. The measurement, 5.0 g, has two significant figures and therefore the final answer should also have 2 significant figures: 0.0050 kg.
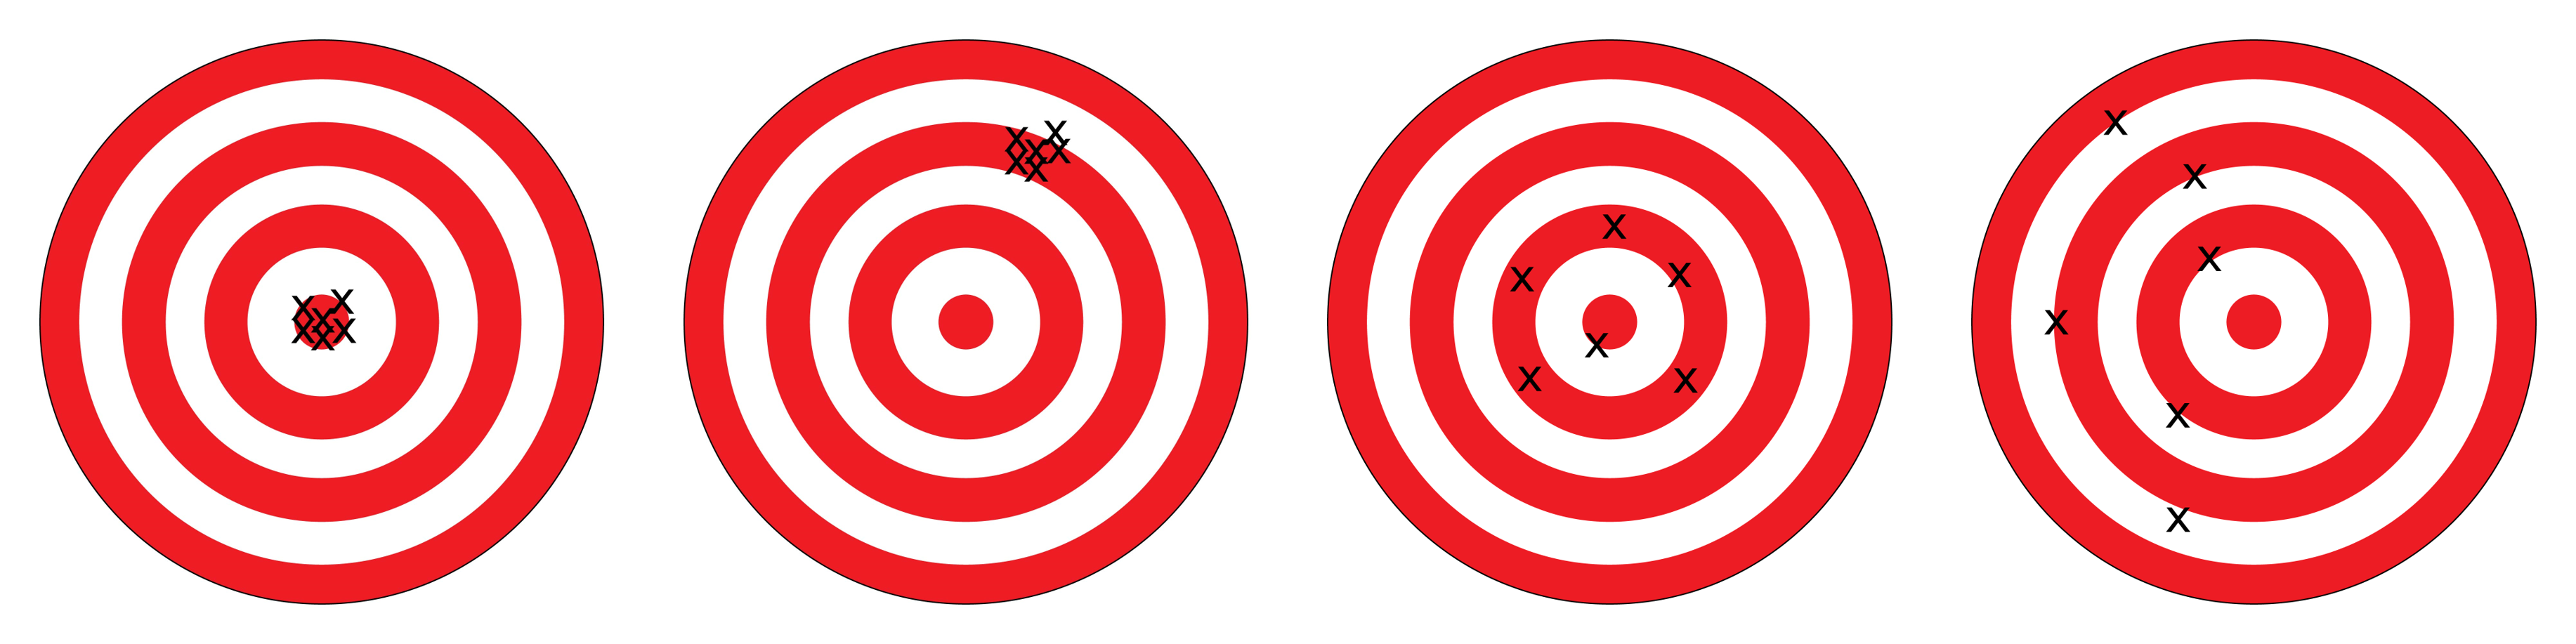
Accuracy is a measure of how close a value is to an expected or intended value. Precision is a measure of how close values are to one another. These concepts can be illustrated using the Bullseye target shown in Figure LM.1. The goal is to have as many attempts (shown as arrows) hit the center of the target. The closer the attempts are to the target, the better the accuracy. The closer the attempts are to one another, the greater the precision.
The first image shows the best accuracy and precision because the attempts are all clustered close to one another at the center. The second image shows good precision because they are all close to one another, but the accuracy is poor because the cluster is far from the center. The third image is accuracy because the attempts, on average, are around the Bullseye but the precision is poor because they are not clustered close together. The last image is neither accuracy nor precision because the attempts are far from the center and are not close together.
Some instruments are digital, which means the measurement is provided as a readout that you record. The balances you will be using in the lab is an example of a digital instrument, and all digits in the readout must be recorded (including any zeros at the end). A calibrated instrument has markings for determining measurements. When using a calibrated instrument, pay attention to the calibration marks or lines on the device. Each line or division is a unit of measure, and these divisions may have subdivisions to more accurately determine the measured value. It is a good rule of thumb to note that the finer the subdivisions, the more precise the instrument and typically the more expensive the instrument. When taking a reading of a graduated instrument, the user should be able to estimate one digit or decimal place past the smallest calibration mark.
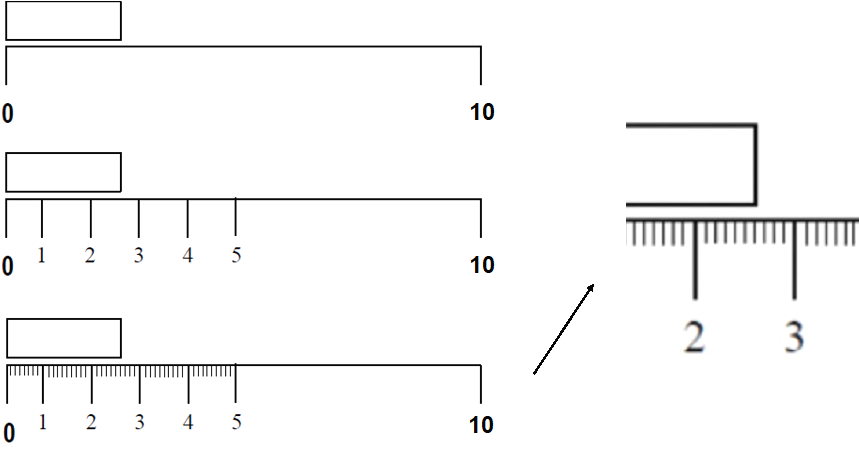
The relationship between the number of subdivisions and the different precisions associated with calibration marks is made clearer by looking at examples of a ruler, shown in Figure LM.2. Using the first (top) ruler, which is calibrated from 0 to 10 cm, the length of the box above the ruler is not 0 cm nor is it 10 cm; it falls somewhere in-between. The length of the box is less than half the distance to 10 cm, so the length should be recorded less than 5 cm. A reasonable recording would be 2 or 3 cm. The second (middle) ruler is calibrated to the nearest 1 cm, and now it can be clearly seen that the length of the box falls between 2 and 3 cm. It can also be seen that the length is a little more than half-way between 2 and 3 cm, and therefore a reasonable recording could be 2.6 or 2.7 cm. The last ruler (bottom), with a magnified view on the far-right is calibrated to the nearest tenth (1/10) of a cm (or 1 mm). The length of the box now appears to be somewhere between 2.6 and 2.7 cm and appears to be a little closer to 2.6 cm. A reasonable recording of the length of the box using the third ruler could be 2.61 or 2.62 cm.
All of these ruler examples require that the last recorded digit of the measurement be estimated. The certainty of the measurement increases as the device offers more subdivisions in the calibration marks.
In the laboratory we measure in degrees Celsius (° C), which is based on the freezing point and boiling point of pure water,
Volume of a rectangular container (i.e., box) is the length x width x height of the given space. If each distance is measured in meters (m), then the resultant volume is in cubic meters or m
|
0.0 |
0.1 |
0.2 |
0.3 |
0.4 |
0.5 |
0.6 |
0.7 |
0.8 |
0.9 |
|
|---|---|---|---|---|---|---|---|---|---|---|
|
15 |
0.9991016 |
0.9990864 |
0.9990712 |
0.9990558 |
0.9990403 |
0.9990247 |
0.9990090 |
0.9989932 |
0.9989772 |
0.9989612 |
|
16 |
0.9989450 |
0.9989287 |
0.9989123 |
0.9988957 |
0.9988791 |
0.9988623 |
0.9988455 |
0.9988285 |
0.9988114 |
0.9987942 |
|
17 |
0.9987769 |
0.9987595 |
0.9987419 |
0.9987243 |
0.9987065 |
0.9986886 |
0.9986706 |
0.9986525 |
0.9986343 |
0.9986160 |
|
18 |
0.9985976 |
0.9985790 |
0.9985604 |
0.9985416 |
0.9985228 |
0.9985038 |
0.9984847 |
0.9984655 |
0.9984462 |
0.9984268 |
|
19 |
0.9984073 |
0.9983877 |
0.9983680 |
0.9983481 |
0.9983282 |
0.9983081 |
0.9982880 |
0.9982677 |
0.9982474 |
0.9982269 |
|
20 |
0.9982063 |
0.9981856 |
0.9981649 |
0.9981440 |
0.9981230 |
0.9981019 |
0.9980807 |
0.9980594 |
0.9980380 |
0.9980164 |
|
21 |
0.9979948 |
0.9979731 |
0.9979513 |
0.9979294 |
0.9979073 |
0.9978852 |
0.9978630 |
0.9978406 |
0.9978182 |
0.9977957 |
|
22 |
0.9977730 |
0.9977503 |
0.9977275 |
0.9977045 |
0.9976815 |
0.9976584 |
0.9976351 |
0.9976118 |
0.9975883 |
0.9975648 |
|
23 |
0.9975412 |
0.9975174 |
0.9974936 |
0.9974697 |
0.9974456 |
0.9974215 |
0.9973973 |
0.9973730 |
0.9973485 |
0.9973240 |
|
24 |
0.9972994 |
0.9972747 |
0.9972499 |
0.9972250 |
0.9972000 |
0.9971749 |
0.9971497 |
0.9971244 |
0.9970990 |
0.9970735 |
|
25 |
0.9970480 |
0.9970223 |
0.9969965 |
0.9969707 |
0.9969447 |
0.9969186 |
0.9968925 |
0.9968663 |
0.9968399 |
0.9968135 |
|
26 |
0.9967870 |
0.9967604 |
0.9967337 |
0.9967069 |
0.9966800 |
0.9966530 |
0.9966259 |
0.9965987 |
0.9965714 |
0.9965441 |
|
27 |
0.9965166 |
0.9964891 |
0.9964615 |
0.9964337 |
0.9964059 |
0.9963780 |
0.9963500 |
0.9963219 |
0.9962938 |
0.9962655 |
|
28 |
0.9962371 |
0.9962087 |
0.9961801 |
0.9961515 |
0.9961228 |
0.9960940 |
0.9960651 |
0.9960361 |
0.9960070 |
0.9959778 |
|
29 |
0.9959486 |
0.9959192 |
0.9958898 |
0.9958603 |
0.9958306 |
0.9958009 |
0.9957712 |
0.9957413 |
0.9957113 |
0.9956813 |
|
30 |
0.9956511 |
0.9956209 |
0.9955906 |
0.9955602 |
0.9955297 |
0.9954991 |
0.9954685 |
0.9954377 |
0.9954069 |
0.9953760 |
a Source: Handbook of Chemistry and Physics, 90th Edition, p. 6-4,5
Note:
You may hold the graduated cylinder at a 45 degree to aid in adding the metal to the liquid.