
MIDI

MIDI
MIDI
MIDI
MIDI
MIDI
MIDI

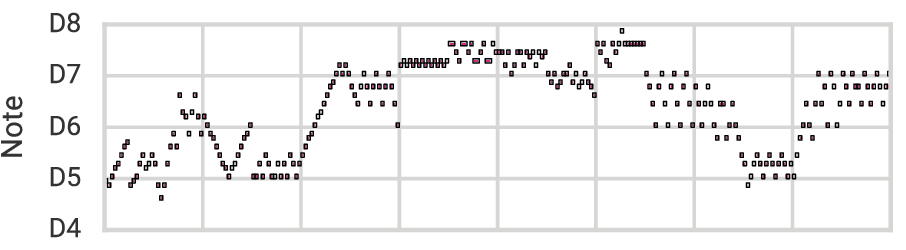
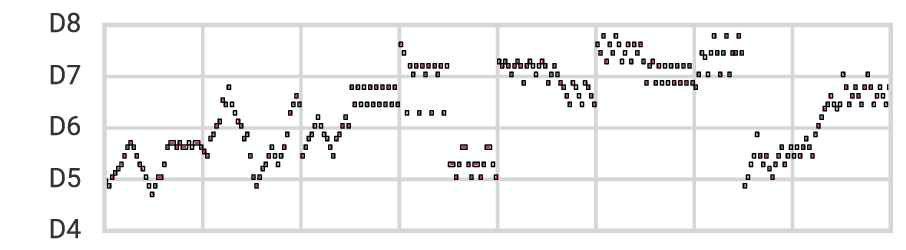
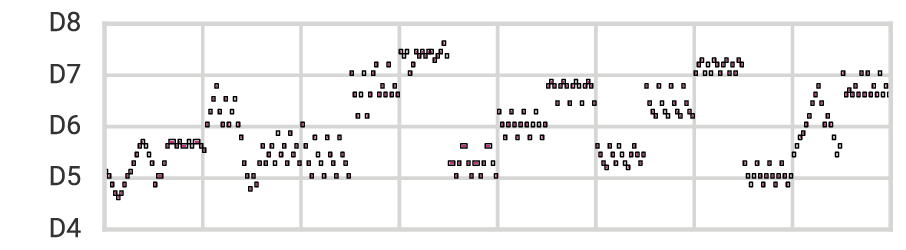
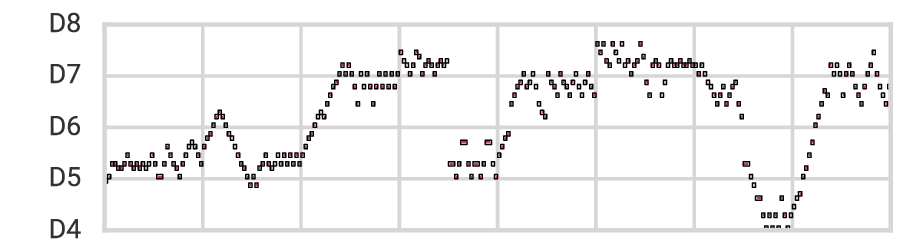
Selected example 16-bar trio samples.
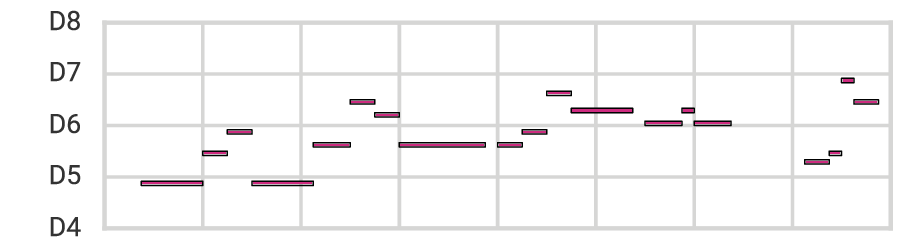
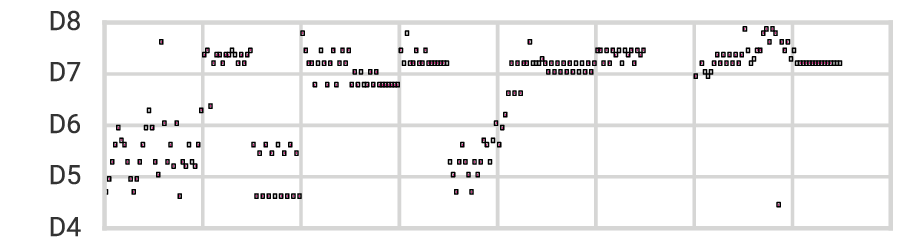
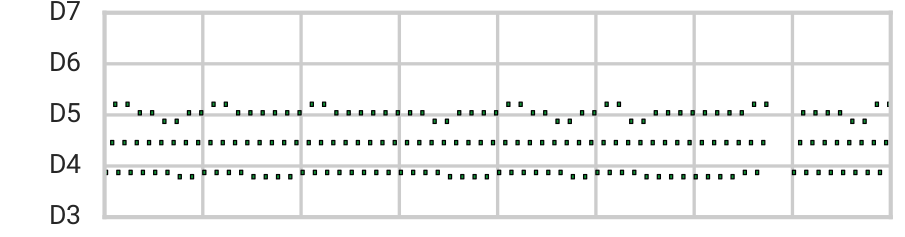
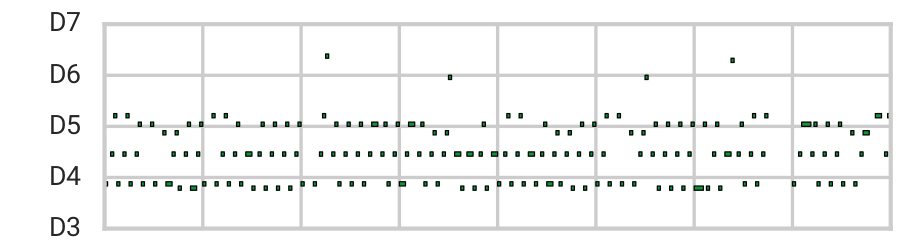
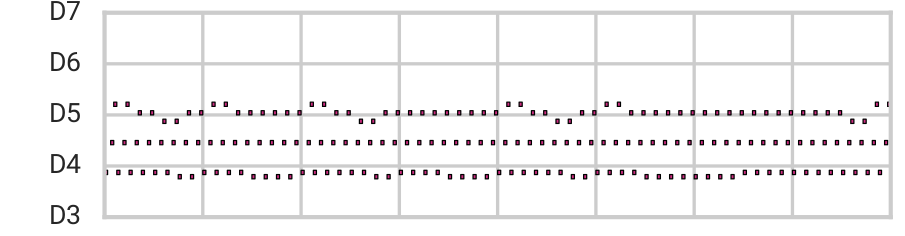
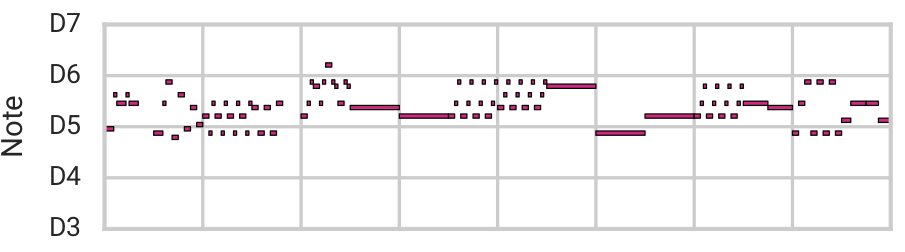
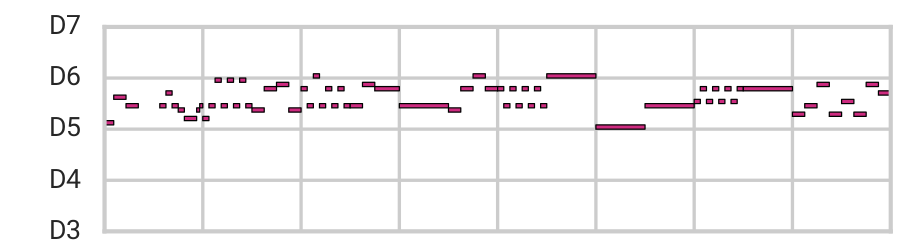
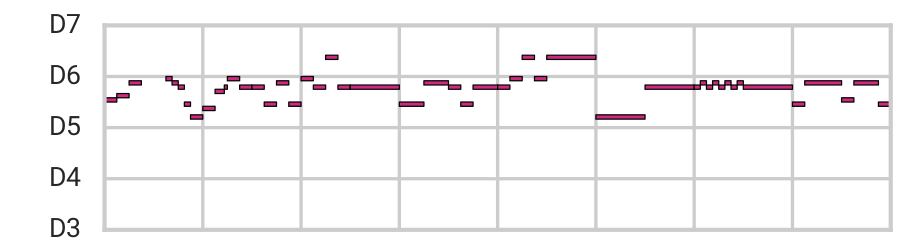
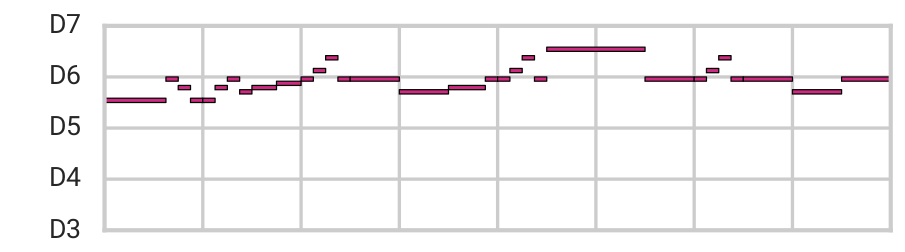
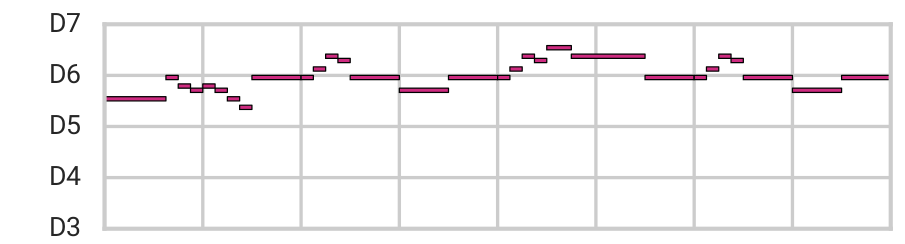
Varying the amount of the “Note Density” attribute vector. The amount varies from -1.5 to 1.5 in steps of 0.5, with the middle sequence corresponding to no attribute vector.
|
|
MIDI |
|
|
MIDI |
|
|
MIDI |
|
|
MIDI |
|
|
MIDI |
|
|
MIDI |
|
|
MIDI |
|
|
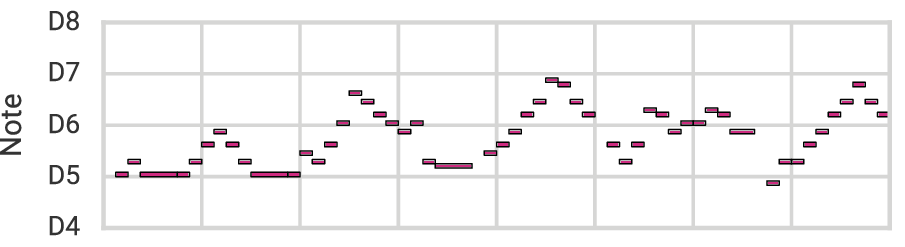
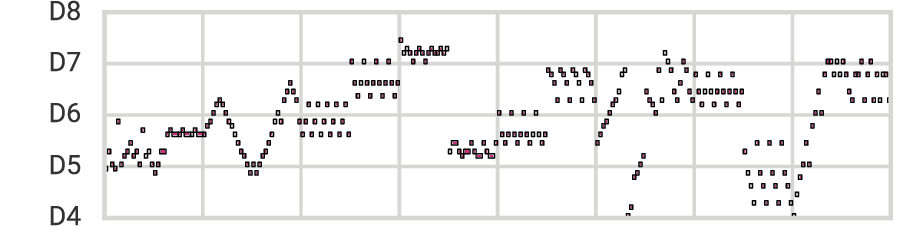
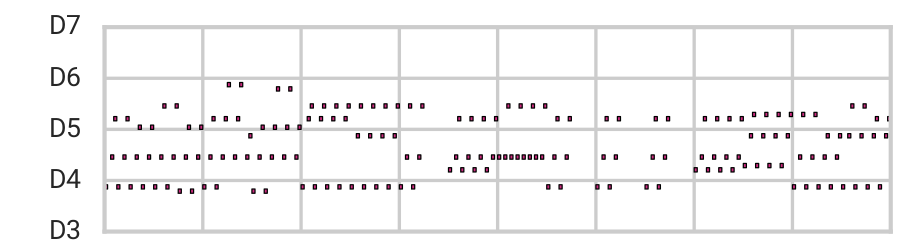
Additional resamplings of the same latent code (corresponding to the second-to-the-bottom in Fig. 6). While semantically similar, the specific notes vary due to the sampling in the autoregressive decoder.
|
MIDI |
|
MIDI |
|
MIDI |
|
MIDI |
|
MIDI |
|
MIDI |
|
MIDI |

|
Subtracting (top) and adding (bottom) the “C Diatonic” attribute vector from the note sequence in the middle. For ease of interpretation, notes in the C diatonic scale are shown in white and notes outside the scale are shown in black.

|
MIDI |

|
MIDI |

|
MIDI |

|
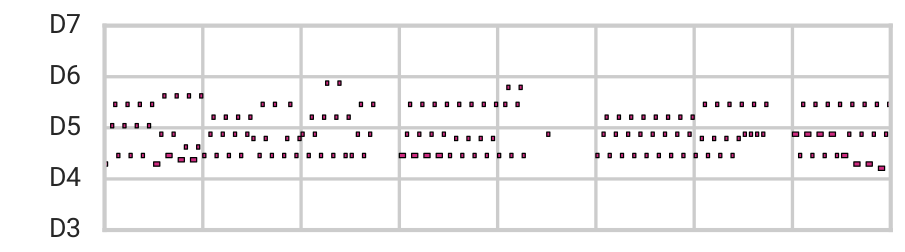
Subtracting (top) and adding (bottom) the “Average Interval” attribute vector from the note sequence shown in the middle.

|
MIDI |

|
MIDI |

|
MIDI |

|
Subtracting (top) and adding (bottom) the “16th Note Syncopation” attribute vector from the note sequence in the middle. For ease of interpretation, only the first 2 of each sequence’s 16 bars are shown. Vertical lines indicate 8th note boundaries. White and black indicate syncopated and non-syncopated notes, respectively

|
MIDI |

|
MIDI |

|
MIDI |

|
Subtracting (top) and adding (bottom) the “8th Note Syncopation” attribute vector from the note sequence in the middle. For ease of interpretation, only the first 4 of each sequence’s 16 bars are shown. Vertical lines indicate quarter note boundaries. White and black indicate syncopated and non-syncopated notes,respectively.

|
MIDI |

|
MIDI |

|
MIDI |

|
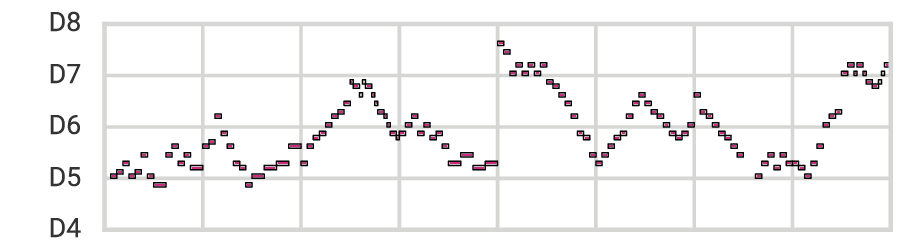
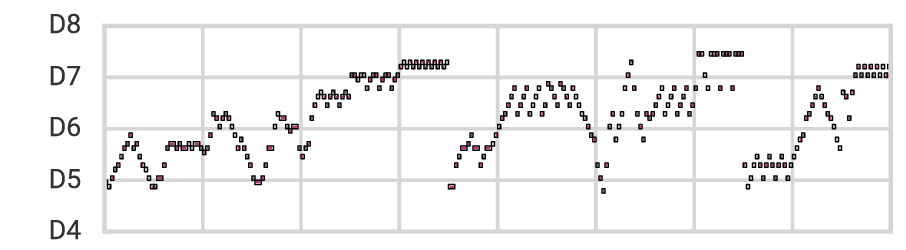
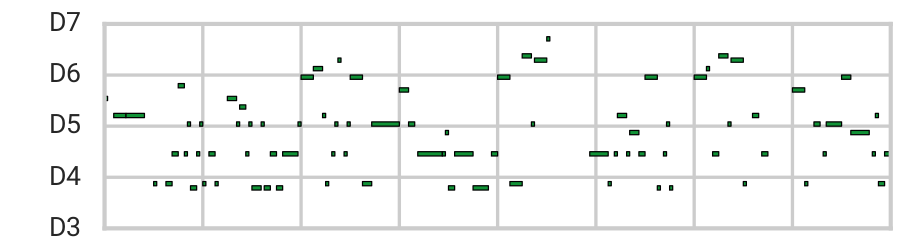
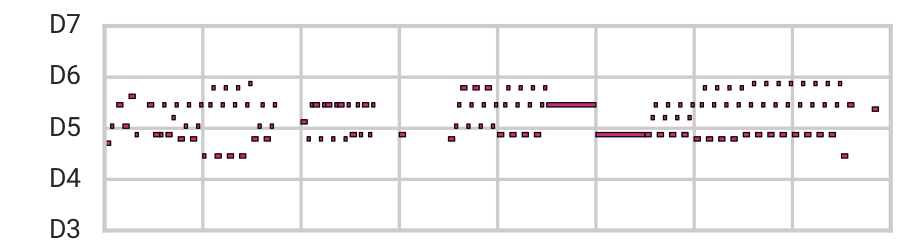
Interpolating between the top and bottom sequence in data space.
|
MIDI |
|
MIDI |

|
MIDI |

|
MIDI |

|
MIDI |
|
MIDI |

|
MIDI |

|
MIDI |
|
MIDI |

|
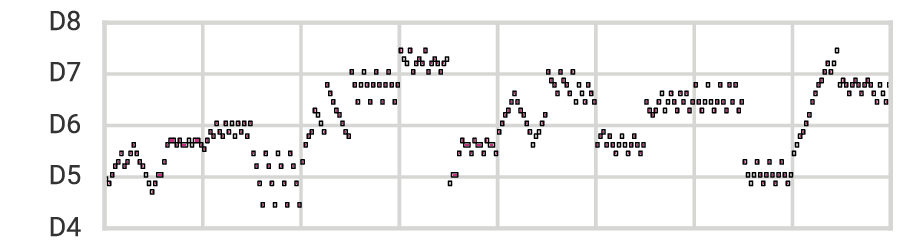
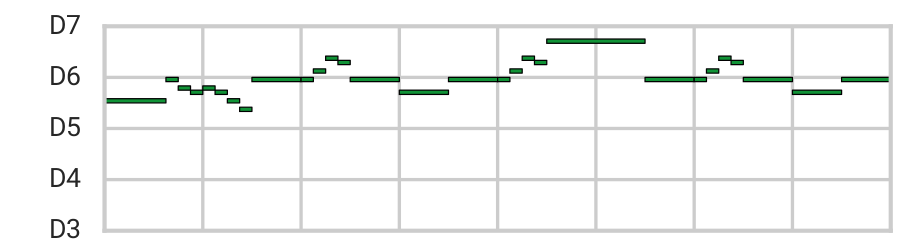
Interpolating between the top and bottom sequence (same as Fig. 12) in MusicVAE’s latent space.
|
MIDI |
|
MIDI |
|
MIDI |
|
MIDI |
|
MIDI |
|
MIDI |
|
MIDI |
|
MIDI |
|
MIDI |

|
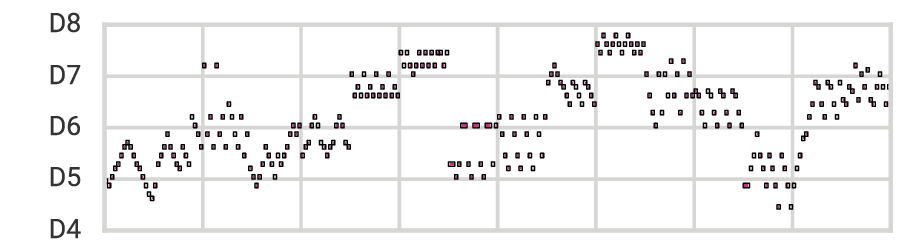
Example interpolation in the 2-bar melody MusicVAE latent space. Vertical axis is pitch (from A3 to C8) and horizontal axis is time. We sampled 13 interpolated sequences between two test-set sequences on the left and right ends. Each 2-bar sample is shown with a different background color.
Flat
Hierarchical
Real Data
Flat
Hierarchical
Real Data
Flat
Hierarchical
Real Data