Project overview: miniz
High level conclusions
Reachability and coverage overview
Warning:
The number of runtime covered functions are larger than the
number of reachable functions. This means that Fuzz Introspector found
there are more functions covered at runtime than what is considered
reachable based on the static analysis. This is a limitation in the
analysis as anything covered at runtime is by definition reachable by the
fuzzers.
This is likely due to a limitation in the static analysis. In this case, the
count of functions covered at runtime is the true value, which means this
is what should be considered "achieved" by the fuzzer.
Use the project functions table below to query all functions that were not covered at runtime.
Project functions overview
The following table shows data about each function in the project. The functions included in this table correspond to all functions that exist in the executables of the fuzzers. As such, there may be functions that are from third-party libraries.
For further technical details on the meaning of columns in the below table, please see the Glossary .
| Func name | Functions filename | Args | Function call depth | Reached by Fuzzers | Runtime reached by Fuzzers | Combined reached by Fuzzers | Fuzzers runtime hit | Func lines hit % | I Count | BB Count | Cyclomatic complexity | Functions reached | Reached by functions | Accumulated cyclomatic complexity | Undiscovered complexity |
|---|
Fuzzer details
Fuzzer: uncompress2_fuzzer
Call tree
The calltree shows the control flow of the fuzzer. This is overlaid with coverage information to display how much of the potential code a fuzzer can reach is in fact covered at runtime. In the following there is a link to a detailed calltree visualisation as well as a bitmap showing a high-level view of the calltree. For further information about these topics please see the glossary for full calltree and calltree overview
Call tree overview bitmap:

The distribution of callsites in terms of coloring is
| Color | Runtime hitcount | Callsite count | Percentage |
|---|---|---|---|
| red | 0 | 1 | 9.09% |
| gold | [1:9] | 1 | 9.09% |
| yellow | [10:29] | 0 | 0.0% |
| greenyellow | [30:49] | 0 | 0.0% |
| lawngreen | 50+ | 9 | 81.8% |
| All colors | 11 | 100 |
Fuzz blockers
The following nodes represent call sites where fuzz blockers occur.
| Amount of callsites blocked | Calltree index | Parent function | Callsite | Largest blocked function |
|---|---|---|---|---|
| 1 | 7 | tinfl_decompress | call site: 00007 | tinfl_decompress |
Runtime coverage analysis
| Function name | source code lines | source lines hit | percentage hit |
|---|
Files reached
| filename | functions hit |
|---|---|
| inspector/light/source_filesminiz/tests/uncompress2_fuzzer.c | 1 |
| miniz/build/amalgamation/miniz.h | 1 |
| miniz/build/amalgamation/miniz.c | 7 |
Fuzzer: zip_fuzzer
Call tree
The calltree shows the control flow of the fuzzer. This is overlaid with coverage information to display how much of the potential code a fuzzer can reach is in fact covered at runtime. In the following there is a link to a detailed calltree visualisation as well as a bitmap showing a high-level view of the calltree. For further information about these topics please see the glossary for full calltree and calltree overview
Call tree overview bitmap:
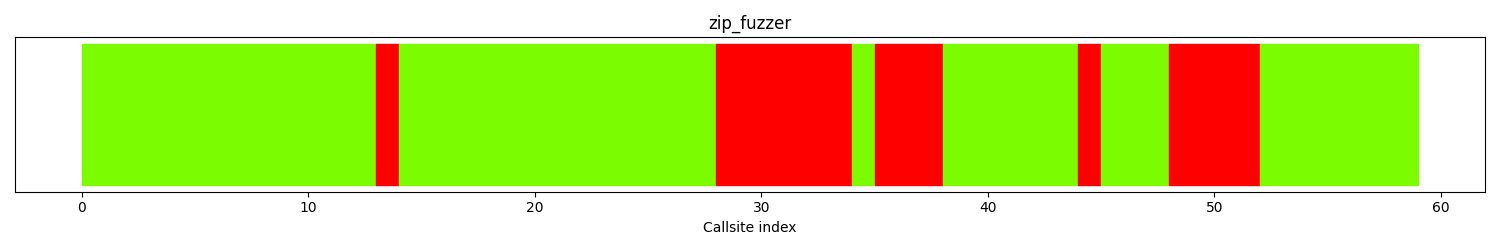
The distribution of callsites in terms of coloring is
| Color | Runtime hitcount | Callsite count | Percentage |
|---|---|---|---|
| red | 0 | 15 | 25.4% |
| gold | [1:9] | 0 | 0.0% |
| yellow | [10:29] | 0 | 0.0% |
| greenyellow | [30:49] | 0 | 0.0% |
| lawngreen | 50+ | 44 | 74.5% |
| All colors | 59 | 100 |
Fuzz blockers
The following nodes represent call sites where fuzz blockers occur.
| Amount of callsites blocked | Calltree index | Parent function | Callsite | Largest blocked function |
|---|---|---|---|---|
| 6 | 27 | mz_zip_validate_file | call site: 00027 | mz_zip_reader_extract_to_callback |
| 4 | 47 | mz_zip_locate_file_binary_search | call site: 00047 | strlen |
| 3 | 34 | tinfl_decompress | call site: 00034 | mz_zip_compute_crc32_callback |
| 1 | 12 | mz_zip_reader_init_mem | call site: 00012 | fclose |
| 1 | 43 | LLVMFuzzerTestOneInput | call site: 00043 | mz_zip_reader_extract_file_to_mem_no_alloc |
Runtime coverage analysis
| Function name | source code lines | source lines hit | percentage hit |
|---|
Files reached
| filename | functions hit |
|---|---|
| inspector/light/source_filesminiz/tests/zip_fuzzer.c | 1 |
| miniz/build/amalgamation/miniz.c | 32 |
Fuzzer: large_fuzzer
Call tree
The calltree shows the control flow of the fuzzer. This is overlaid with coverage information to display how much of the potential code a fuzzer can reach is in fact covered at runtime. In the following there is a link to a detailed calltree visualisation as well as a bitmap showing a high-level view of the calltree. For further information about these topics please see the glossary for full calltree and calltree overview
Call tree overview bitmap:
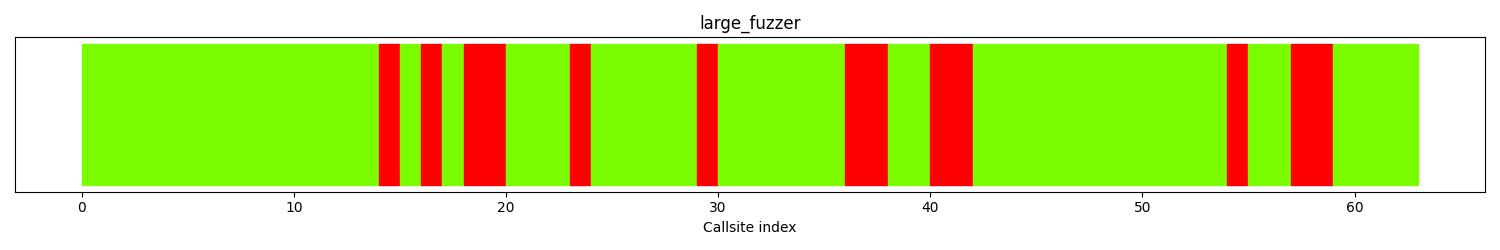
The distribution of callsites in terms of coloring is
| Color | Runtime hitcount | Callsite count | Percentage |
|---|---|---|---|
| red | 0 | 13 | 20.6% |
| gold | [1:9] | 0 | 0.0% |
| yellow | [10:29] | 0 | 0.0% |
| greenyellow | [30:49] | 0 | 0.0% |
| lawngreen | 50+ | 50 | 79.3% |
| All colors | 63 | 100 |
Fuzz blockers
The following nodes represent call sites where fuzz blockers occur.
| Amount of callsites blocked | Calltree index | Parent function | Callsite | Largest blocked function |
|---|---|---|---|---|
| 2 | 17 | tdefl_flush_block | call site: 00017 | tdefl_start_static_block |
| 2 | 35 | test_large_deflate | call site: 00035 | fprintf |
| 2 | 39 | test_large_deflate | call site: 00039 | fprintf |
| 2 | 56 | mz_inflate | call site: 00056 | fprintf |
| 1 | 13 | mz_deflate | call site: 00013 | tdefl_flush_output_buffer |
| 1 | 15 | tdefl_compress | call site: 00015 | tdefl_flush_block |
| 1 | 22 | tdefl_optimize_huffman_table | call site: 00022 | tdefl_optimize_huffman_table |
| 1 | 28 | tdefl_compress_block | call site: 00028 | tdefl_compress_block |
| 1 | 53 | inflate | call site: 00053 | tinfl_decompress |
Runtime coverage analysis
| Function name | source code lines | source lines hit | percentage hit |
|---|
Files reached
| filename | functions hit |
|---|---|
| inspector/light/source_filesminiz/tests/large_fuzzer.c | 3 |
| miniz/build/amalgamation/miniz.h | 6 |
| miniz/build/amalgamation/miniz.c | 26 |
Fuzzer: checksum_fuzzer
Call tree
The calltree shows the control flow of the fuzzer. This is overlaid with coverage information to display how much of the potential code a fuzzer can reach is in fact covered at runtime. In the following there is a link to a detailed calltree visualisation as well as a bitmap showing a high-level view of the calltree. For further information about these topics please see the glossary for full calltree and calltree overview
Call tree overview bitmap:
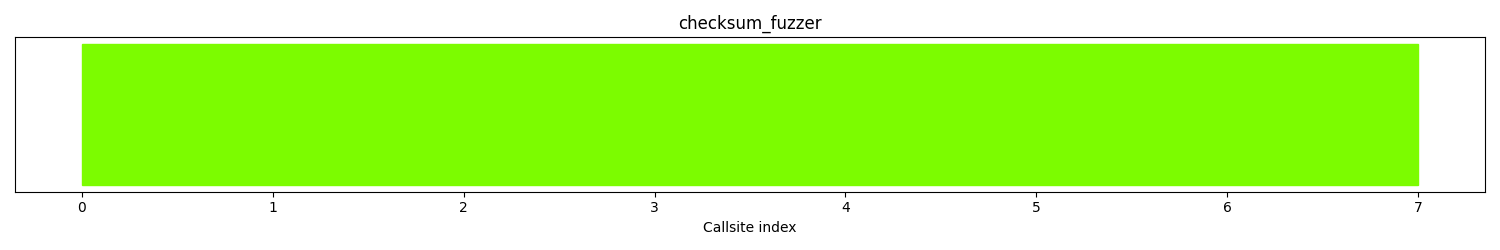
The distribution of callsites in terms of coloring is
| Color | Runtime hitcount | Callsite count | Percentage |
|---|---|---|---|
| red | 0 | 0 | 0.0% |
| gold | [1:9] | 0 | 0.0% |
| yellow | [10:29] | 0 | 0.0% |
| greenyellow | [30:49] | 0 | 0.0% |
| lawngreen | 50+ | 7 | 100.% |
| All colors | 7 | 100 |
Runtime coverage analysis
| Function name | source code lines | source lines hit | percentage hit |
|---|
Files reached
| filename | functions hit |
|---|---|
| inspector/light/source_filesminiz/tests/checksum_fuzzer.c | 1 |
| miniz/build/amalgamation/miniz.h | 2 |
| miniz/build/amalgamation/miniz.c | 2 |
Fuzzer: add_in_place_fuzzer
Call tree
The calltree shows the control flow of the fuzzer. This is overlaid with coverage information to display how much of the potential code a fuzzer can reach is in fact covered at runtime. In the following there is a link to a detailed calltree visualisation as well as a bitmap showing a high-level view of the calltree. For further information about these topics please see the glossary for full calltree and calltree overview
Call tree overview bitmap:
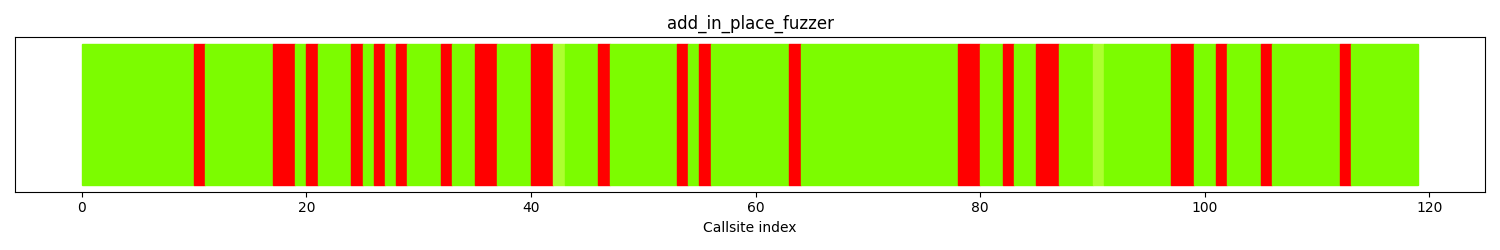
The distribution of callsites in terms of coloring is
| Color | Runtime hitcount | Callsite count | Percentage |
|---|---|---|---|
| red | 0 | 26 | 21.8% |
| gold | [1:9] | 0 | 0.0% |
| yellow | [10:29] | 0 | 0.0% |
| greenyellow | [30:49] | 2 | 1.68% |
| lawngreen | 50+ | 91 | 76.4% |
| All colors | 119 | 100 |
Fuzz blockers
The following nodes represent call sites where fuzz blockers occur.
| Amount of callsites blocked | Calltree index | Parent function | Callsite | Largest blocked function |
|---|---|---|---|---|
| 2 | 16 | mz_zip_writer_init_file_v2 | call site: 00016 | mz_zip_writer_end |
| 2 | 34 | mz_zip_reader_read_central_dir | call site: 00034 | mz_zip_reader_sort_central_dir_offsets_by_filename |
| 2 | 39 | mz_zip_add_mem_to_archive_file_in_place_v2 | call site: 00039 | mz_zip_reader_end_internal |
| 2 | 77 | tdefl_compress_block | call site: 00077 | tdefl_compress_block |
| 2 | 84 | mz_zip_writer_add_to_central_dir | call site: 00084 | mz_zip_array_ensure_capacity |
| 2 | 96 | mz_zip_extract_archive_file_to_heap_v2 | call site: 00096 | mz_zip_locate_file_binary_search |
| 1 | 9 | LLVMFuzzerTestOneInput | call site: 00009 | mz_zip_add_mem_to_archive_file_in_place_v2 |
| 1 | 19 | mz_zip_writer_end_internal | call site: 00019 | mz_zip_writer_end |
| 1 | 23 | mz_zip_reader_init_file_v2 | call site: 00023 | fclose |
| 1 | 25 | mz_zip_reader_init_file_v2 | call site: 00025 | fclose |
| 1 | 27 | mz_zip_reader_init_file_v2 | call site: 00027 | fclose |
| 1 | 31 | mz_zip_reader_read_central_dir | call site: 00031 | mz_zip_reader_eocd64_valid |
Runtime coverage analysis
| Function name | source code lines | source lines hit | percentage hit |
|---|
Files reached
| filename | functions hit |
|---|---|
| inspector/light/source_filesminiz/tests/add_in_place_fuzzer.c | 4 |
| miniz/build/amalgamation/miniz.c | 60 |
Fuzzer: inspector/source-codeminiz/tests/checksum_fuzzer.c
Call tree
The calltree shows the control flow of the fuzzer. This is overlaid with coverage information to display how much of the potential code a fuzzer can reach is in fact covered at runtime. In the following there is a link to a detailed calltree visualisation as well as a bitmap showing a high-level view of the calltree. For further information about these topics please see the glossary for full calltree and calltree overview
Call tree overview bitmap:
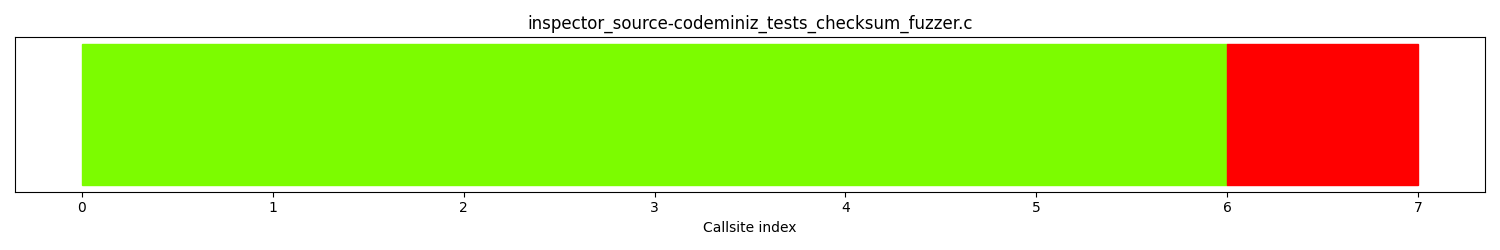
The distribution of callsites in terms of coloring is
| Color | Runtime hitcount | Callsite count | Percentage |
|---|---|---|---|
| red | 0 | 1 | 14.2% |
| gold | [1:9] | 0 | 0.0% |
| yellow | [10:29] | 0 | 0.0% |
| greenyellow | [30:49] | 0 | 0.0% |
| lawngreen | 50+ | 6 | 85.7% |
| All colors | 7 | 100 |
Fuzz blockers
The following nodes represent call sites where fuzz blockers occur.
| Amount of callsites blocked | Calltree index | Parent function | Callsite | Largest blocked function |
|---|---|---|---|---|
| 1 | 5 | LLVMFuzzerTestOneInput | call site: 00005 | adler32 |
Runtime coverage analysis
| Function name | source code lines | source lines hit | percentage hit |
|---|
Files reached
| filename | functions hit |
|---|---|
| inspector/source-codeminiz/tests/checksum_fuzzer.c | 1 |
| miniz/build/amalgamation/miniz.h | 2 |
| miniz/build/amalgamation/miniz.c | 2 |
Fuzzer: miniz/tests/add_in_place_fuzzer.c
Call tree
The calltree shows the control flow of the fuzzer. This is overlaid with coverage information to display how much of the potential code a fuzzer can reach is in fact covered at runtime. In the following there is a link to a detailed calltree visualisation as well as a bitmap showing a high-level view of the calltree. For further information about these topics please see the glossary for full calltree and calltree overview
Call tree overview bitmap:
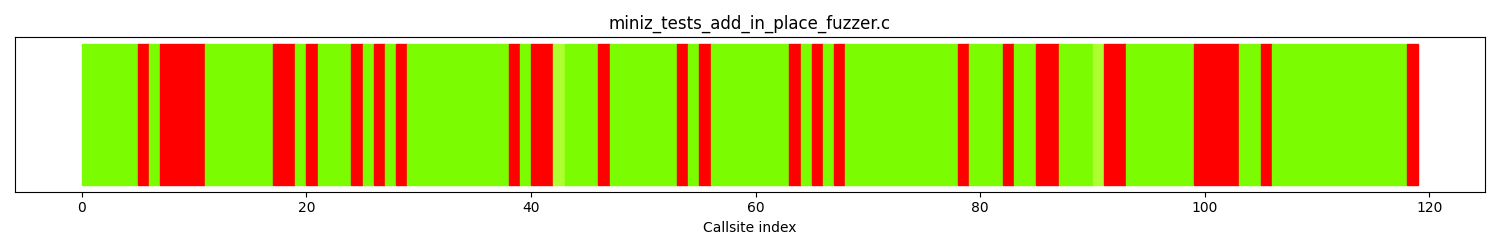
The distribution of callsites in terms of coloring is
| Color | Runtime hitcount | Callsite count | Percentage |
|---|---|---|---|
| red | 0 | 32 | 26.8% |
| gold | [1:9] | 0 | 0.0% |
| yellow | [10:29] | 0 | 0.0% |
| greenyellow | [30:49] | 2 | 1.68% |
| lawngreen | 50+ | 85 | 71.4% |
| All colors | 119 | 100 |
Fuzz blockers
The following nodes represent call sites where fuzz blockers occur.
| Amount of callsites blocked | Calltree index | Parent function | Callsite | Largest blocked function |
|---|---|---|---|---|
| 4 | 6 | read_buffer | call site: 00006 | mz_zip_add_mem_to_archive_file_in_place |
| 4 | 98 | mz_zip_locate_file_binary_search | call site: 00098 | strlen |
| 2 | 16 | mz_zip_writer_init_file_v2 | call site: 00016 | mz_zip_writer_end |
| 2 | 39 | mz_zip_add_mem_to_archive_file_in_place_v2 | call site: 00039 | mz_zip_reader_end_internal |
| 2 | 84 | mz_zip_writer_add_to_central_dir | call site: 00084 | mz_zip_array_ensure_capacity |
| 2 | 90 | mz_zip_add_mem_to_archive_file_in_place_v2 | call site: 00090 | mz_zip_extract_archive_file_to_heap |
| 1 | 4 | read_string | call site: 00004 | read_buffer |
| 1 | 19 | mz_zip_writer_end_internal | call site: 00019 | mz_zip_writer_end |
| 1 | 23 | mz_zip_reader_init_file_v2 | call site: 00023 | fclose |
| 1 | 25 | mz_zip_reader_init_file_v2 | call site: 00025 | fclose |
| 1 | 27 | mz_zip_reader_init_file_v2 | call site: 00027 | fclose |
| 1 | 37 | mz_zip_reader_init_file_v2 | call site: 00037 | fclose |
Runtime coverage analysis
| Function name | source code lines | source lines hit | percentage hit |
|---|
Files reached
| filename | functions hit |
|---|---|
| miniz/tests/add_in_place_fuzzer.c | 4 |
| miniz/build/amalgamation/miniz.c | 60 |
Fuzzer: inspector/source-codeminiz/tests/large_fuzzer.c
Call tree
The calltree shows the control flow of the fuzzer. This is overlaid with coverage information to display how much of the potential code a fuzzer can reach is in fact covered at runtime. In the following there is a link to a detailed calltree visualisation as well as a bitmap showing a high-level view of the calltree. For further information about these topics please see the glossary for full calltree and calltree overview
Call tree overview bitmap:
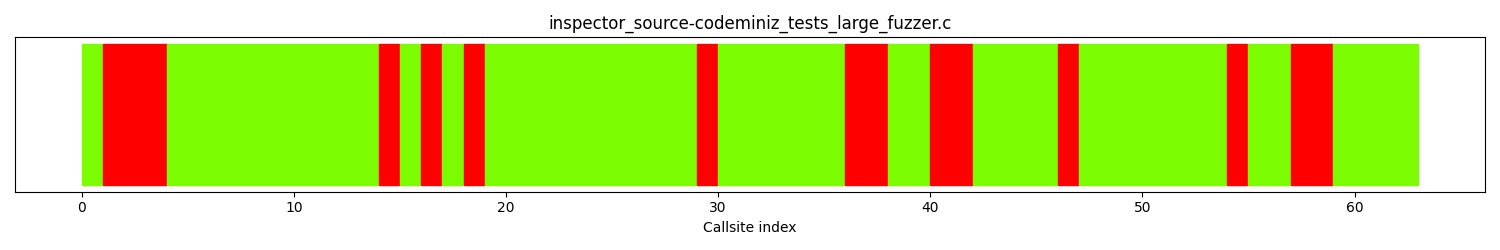
The distribution of callsites in terms of coloring is
| Color | Runtime hitcount | Callsite count | Percentage |
|---|---|---|---|
| red | 0 | 15 | 23.8% |
| gold | [1:9] | 0 | 0.0% |
| yellow | [10:29] | 0 | 0.0% |
| greenyellow | [30:49] | 0 | 0.0% |
| lawngreen | 50+ | 48 | 76.1% |
| All colors | 63 | 100 |
Fuzz blockers
The following nodes represent call sites where fuzz blockers occur.
| Amount of callsites blocked | Calltree index | Parent function | Callsite | Largest blocked function |
|---|---|---|---|---|
| 3 | 0 | EP | call site: 00000 | test_large_deflate |
| 2 | 35 | test_large_deflate | call site: 00035 | fprintf |
| 2 | 39 | test_large_deflate | call site: 00039 | fprintf |
| 2 | 56 | mz_inflate | call site: 00056 | fprintf |
| 1 | 13 | mz_deflate | call site: 00013 | tdefl_flush_output_buffer |
| 1 | 15 | tdefl_compress | call site: 00015 | tdefl_flush_block |
| 1 | 17 | tdefl_flush_block | call site: 00017 | tdefl_start_static_block |
| 1 | 28 | tdefl_compress_block | call site: 00028 | tdefl_compress_block |
| 1 | 45 | test_large_deflate | call site: 00045 | test_large_inflate |
| 1 | 53 | inflate | call site: 00053 | tinfl_decompress |
Runtime coverage analysis
| Function name | source code lines | source lines hit | percentage hit |
|---|
Files reached
| filename | functions hit |
|---|---|
| inspector/source-codeminiz/tests/large_fuzzer.c | 3 |
| miniz/build/amalgamation/miniz.h | 6 |
| miniz/build/amalgamation/miniz.c | 26 |
Fuzzer: miniz/tests/uncompress_fuzzer.c
Call tree
The calltree shows the control flow of the fuzzer. This is overlaid with coverage information to display how much of the potential code a fuzzer can reach is in fact covered at runtime. In the following there is a link to a detailed calltree visualisation as well as a bitmap showing a high-level view of the calltree. For further information about these topics please see the glossary for full calltree and calltree overview
Call tree overview bitmap:
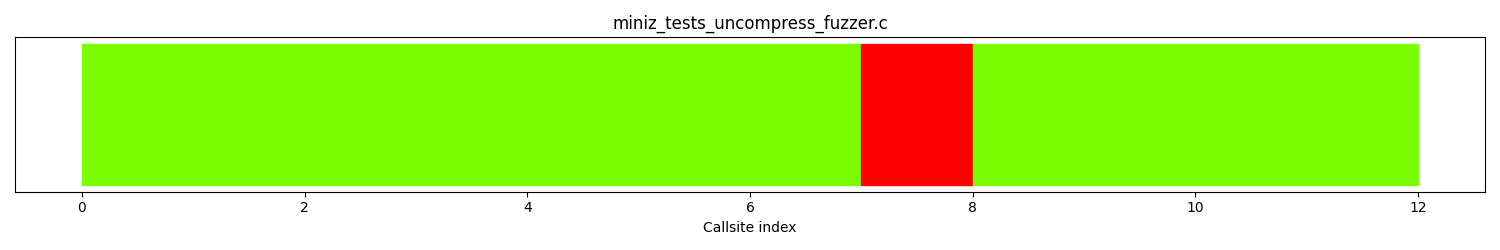
The distribution of callsites in terms of coloring is
| Color | Runtime hitcount | Callsite count | Percentage |
|---|---|---|---|
| red | 0 | 1 | 8.33% |
| gold | [1:9] | 0 | 0.0% |
| yellow | [10:29] | 0 | 0.0% |
| greenyellow | [30:49] | 0 | 0.0% |
| lawngreen | 50+ | 11 | 91.6% |
| All colors | 12 | 100 |
Fuzz blockers
The following nodes represent call sites where fuzz blockers occur.
| Amount of callsites blocked | Calltree index | Parent function | Callsite | Largest blocked function |
|---|---|---|---|---|
| 1 | 6 | mz_uncompress2 | call site: 00006 | tinfl_decompress |
Runtime coverage analysis
| Function name | source code lines | source lines hit | percentage hit |
|---|
Files reached
| filename | functions hit |
|---|---|
| miniz/tests/uncompress_fuzzer.c | 1 |
| miniz/build/amalgamation/miniz.h | 1 |
| miniz/build/amalgamation/miniz.c | 8 |
Fuzzer: inspector/source-codeminiz/tests/compress_fuzzer.c
Call tree
The calltree shows the control flow of the fuzzer. This is overlaid with coverage information to display how much of the potential code a fuzzer can reach is in fact covered at runtime. In the following there is a link to a detailed calltree visualisation as well as a bitmap showing a high-level view of the calltree. For further information about these topics please see the glossary for full calltree and calltree overview
Call tree overview bitmap:
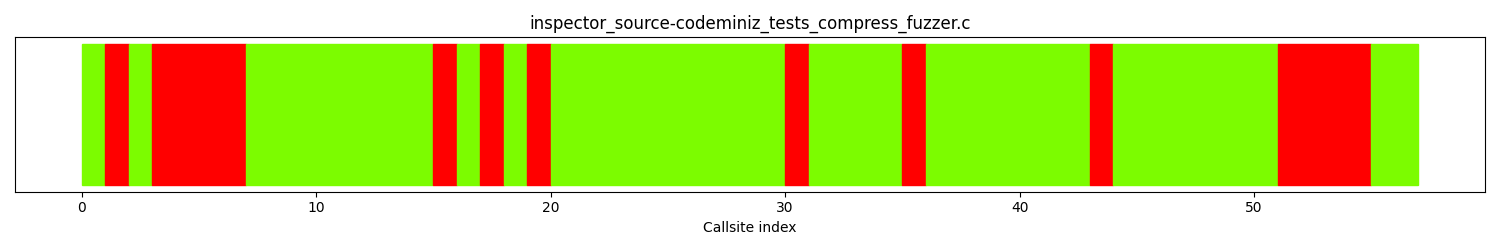
The distribution of callsites in terms of coloring is
| Color | Runtime hitcount | Callsite count | Percentage |
|---|---|---|---|
| red | 0 | 15 | 26.3% |
| gold | [1:9] | 0 | 0.0% |
| yellow | [10:29] | 0 | 0.0% |
| greenyellow | [30:49] | 0 | 0.0% |
| lawngreen | 50+ | 42 | 73.6% |
| All colors | 57 | 100 |
Fuzz blockers
The following nodes represent call sites where fuzz blockers occur.
| Amount of callsites blocked | Calltree index | Parent function | Callsite | Largest blocked function |
|---|---|---|---|---|
| 4 | 2 | compressBound | call site: 00002 | check_compress_level |
| 4 | 50 | check_compress_level | call site: 00050 | check_compress_level |
| 1 | 0 | EP | call site: 00000 | compressBound |
| 1 | 14 | mz_deflate | call site: 00014 | tdefl_flush_output_buffer |
| 1 | 16 | tdefl_compress | call site: 00016 | tdefl_flush_block |
| 1 | 18 | tdefl_flush_block | call site: 00018 | tdefl_start_static_block |
| 1 | 29 | tdefl_compress_block | call site: 00029 | tdefl_compress_block |
| 1 | 34 | mz_deflate | call site: 00034 | mz_deflateEnd |
| 1 | 42 | mz_uncompress2 | call site: 00042 | tinfl_decompress |
Runtime coverage analysis
| Function name | source code lines | source lines hit | percentage hit |
|---|
Files reached
| filename | functions hit |
|---|---|
| inspector/source-codeminiz/tests/compress_fuzzer.c | 4 |
| miniz/build/amalgamation/miniz.h | 3 |
| miniz/build/amalgamation/miniz.c | 31 |
Fuzzer: miniz/tests/checksum_fuzzer.c
Call tree
The calltree shows the control flow of the fuzzer. This is overlaid with coverage information to display how much of the potential code a fuzzer can reach is in fact covered at runtime. In the following there is a link to a detailed calltree visualisation as well as a bitmap showing a high-level view of the calltree. For further information about these topics please see the glossary for full calltree and calltree overview
Call tree overview bitmap:
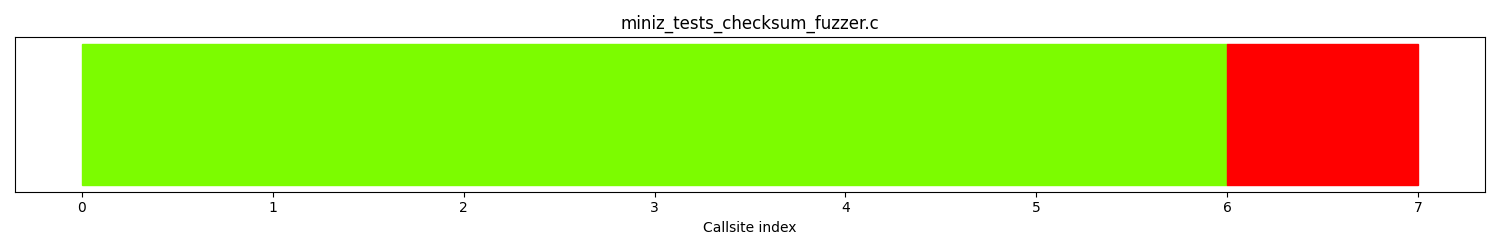
The distribution of callsites in terms of coloring is
| Color | Runtime hitcount | Callsite count | Percentage |
|---|---|---|---|
| red | 0 | 1 | 14.2% |
| gold | [1:9] | 0 | 0.0% |
| yellow | [10:29] | 0 | 0.0% |
| greenyellow | [30:49] | 0 | 0.0% |
| lawngreen | 50+ | 6 | 85.7% |
| All colors | 7 | 100 |
Fuzz blockers
The following nodes represent call sites where fuzz blockers occur.
| Amount of callsites blocked | Calltree index | Parent function | Callsite | Largest blocked function |
|---|---|---|---|---|
| 1 | 5 | LLVMFuzzerTestOneInput | call site: 00005 | adler32 |
Runtime coverage analysis
| Function name | source code lines | source lines hit | percentage hit |
|---|
Files reached
| filename | functions hit |
|---|---|
| miniz/tests/checksum_fuzzer.c | 1 |
| miniz/build/amalgamation/miniz.h | 2 |
| miniz/build/amalgamation/miniz.c | 2 |
Fuzzer: miniz/tests/small_fuzzer.c
Call tree
The calltree shows the control flow of the fuzzer. This is overlaid with coverage information to display how much of the potential code a fuzzer can reach is in fact covered at runtime. In the following there is a link to a detailed calltree visualisation as well as a bitmap showing a high-level view of the calltree. For further information about these topics please see the glossary for full calltree and calltree overview
Call tree overview bitmap:
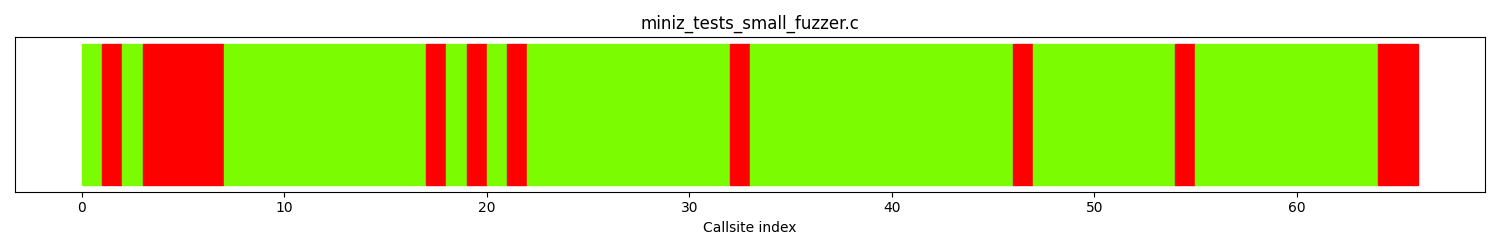
The distribution of callsites in terms of coloring is
| Color | Runtime hitcount | Callsite count | Percentage |
|---|---|---|---|
| red | 0 | 13 | 19.6% |
| gold | [1:9] | 0 | 0.0% |
| yellow | [10:29] | 0 | 0.0% |
| greenyellow | [30:49] | 0 | 0.0% |
| lawngreen | 50+ | 53 | 80.3% |
| All colors | 66 | 100 |
Fuzz blockers
The following nodes represent call sites where fuzz blockers occur.
| Amount of callsites blocked | Calltree index | Parent function | Callsite | Largest blocked function |
|---|---|---|---|---|
| 4 | 2 | compressBound | call site: 00002 | test_deflate |
| 2 | 63 | test_inflate | call site: 00063 | fprintf |
| 1 | 0 | EP | call site: 00000 | compressBound |
| 1 | 16 | mz_deflate | call site: 00016 | tdefl_flush_output_buffer |
| 1 | 18 | tdefl_compress | call site: 00018 | tdefl_flush_block |
| 1 | 20 | tdefl_flush_block | call site: 00020 | tdefl_start_static_block |
| 1 | 31 | tdefl_compress_block | call site: 00031 | tdefl_compress_block |
| 1 | 45 | test_deflate | call site: 00045 | test_inflate |
| 1 | 53 | inflate | call site: 00053 | tinfl_decompress |
Runtime coverage analysis
| Function name | source code lines | source lines hit | percentage hit |
|---|
Files reached
| filename | functions hit |
|---|---|
| miniz/tests/small_fuzzer.c | 3 |
| miniz/build/amalgamation/miniz.h | 7 |
| miniz/build/amalgamation/miniz.c | 28 |
Fuzzer: inspector/source-codeminiz/tests/zip_fuzzer.c
Call tree
The calltree shows the control flow of the fuzzer. This is overlaid with coverage information to display how much of the potential code a fuzzer can reach is in fact covered at runtime. In the following there is a link to a detailed calltree visualisation as well as a bitmap showing a high-level view of the calltree. For further information about these topics please see the glossary for full calltree and calltree overview
Call tree overview bitmap:
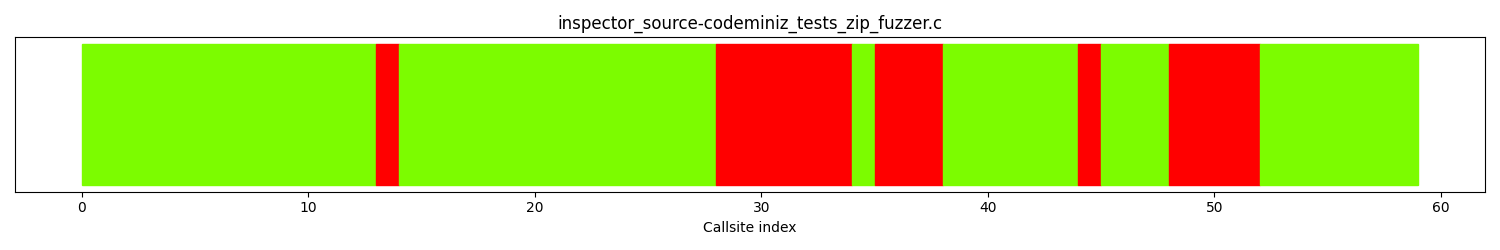
The distribution of callsites in terms of coloring is
| Color | Runtime hitcount | Callsite count | Percentage |
|---|---|---|---|
| red | 0 | 15 | 25.4% |
| gold | [1:9] | 0 | 0.0% |
| yellow | [10:29] | 0 | 0.0% |
| greenyellow | [30:49] | 0 | 0.0% |
| lawngreen | 50+ | 44 | 74.5% |
| All colors | 59 | 100 |
Fuzz blockers
The following nodes represent call sites where fuzz blockers occur.
| Amount of callsites blocked | Calltree index | Parent function | Callsite | Largest blocked function |
|---|---|---|---|---|
| 6 | 27 | mz_zip_validate_file | call site: 00027 | mz_zip_reader_extract_to_callback |
| 4 | 47 | mz_zip_locate_file_binary_search | call site: 00047 | strlen |
| 3 | 34 | tinfl_decompress | call site: 00034 | mz_zip_compute_crc32_callback |
| 1 | 12 | mz_zip_reader_init_mem | call site: 00012 | fclose |
| 1 | 43 | LLVMFuzzerTestOneInput | call site: 00043 | mz_zip_reader_extract_file_to_mem_no_alloc |
Runtime coverage analysis
| Function name | source code lines | source lines hit | percentage hit |
|---|
Files reached
| filename | functions hit |
|---|---|
| inspector/source-codeminiz/tests/zip_fuzzer.c | 1 |
| miniz/build/amalgamation/miniz.c | 32 |
Fuzzer: flush_fuzzer
Call tree
The calltree shows the control flow of the fuzzer. This is overlaid with coverage information to display how much of the potential code a fuzzer can reach is in fact covered at runtime. In the following there is a link to a detailed calltree visualisation as well as a bitmap showing a high-level view of the calltree. For further information about these topics please see the glossary for full calltree and calltree overview
Call tree overview bitmap:
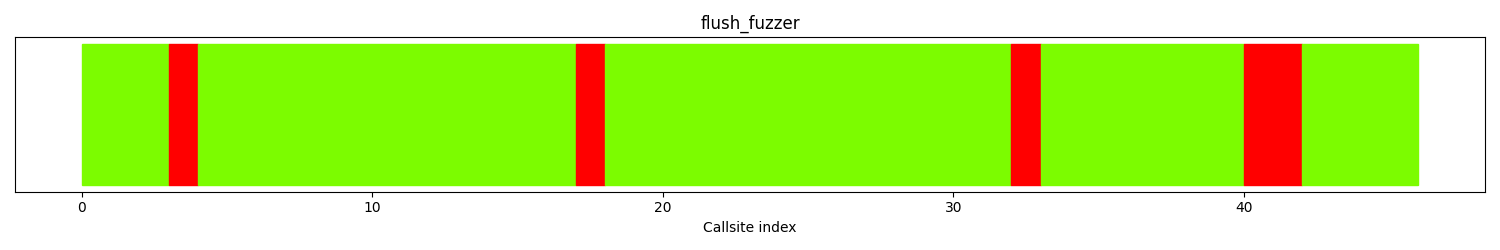
The distribution of callsites in terms of coloring is
| Color | Runtime hitcount | Callsite count | Percentage |
|---|---|---|---|
| red | 0 | 5 | 10.8% |
| gold | [1:9] | 0 | 0.0% |
| yellow | [10:29] | 0 | 0.0% |
| greenyellow | [30:49] | 0 | 0.0% |
| lawngreen | 50+ | 41 | 89.1% |
| All colors | 46 | 100 |
Fuzz blockers
The following nodes represent call sites where fuzz blockers occur.
| Amount of callsites blocked | Calltree index | Parent function | Callsite | Largest blocked function |
|---|---|---|---|---|
| 2 | 39 | test_flush | call site: 00039 | fprintf |
| 1 | 2 | compressBound | call site: 00002 | mz_deflateBound |
| 1 | 16 | mz_deflate | call site: 00016 | tdefl_flush_output_buffer |
| 1 | 31 | tdefl_compress_block | call site: 00031 | tdefl_compress_block |
Runtime coverage analysis
| Function name | source code lines | source lines hit | percentage hit |
|---|
Files reached
| filename | functions hit |
|---|---|
| inspector/light/source_filesminiz/tests/flush_fuzzer.c | 2 |
| miniz/build/amalgamation/miniz.h | 4 |
| miniz/build/amalgamation/miniz.c | 22 |
Fuzzer: inspector/source-codeminiz/tests/small_fuzzer.c
Call tree
The calltree shows the control flow of the fuzzer. This is overlaid with coverage information to display how much of the potential code a fuzzer can reach is in fact covered at runtime. In the following there is a link to a detailed calltree visualisation as well as a bitmap showing a high-level view of the calltree. For further information about these topics please see the glossary for full calltree and calltree overview
Call tree overview bitmap:
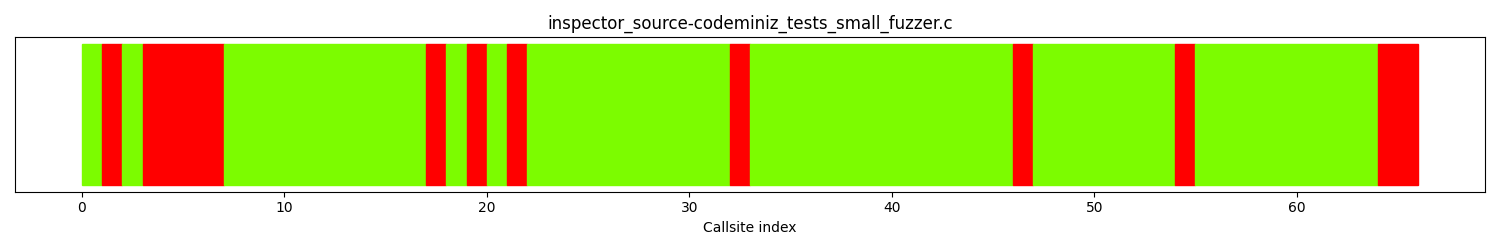
The distribution of callsites in terms of coloring is
| Color | Runtime hitcount | Callsite count | Percentage |
|---|---|---|---|
| red | 0 | 13 | 19.6% |
| gold | [1:9] | 0 | 0.0% |
| yellow | [10:29] | 0 | 0.0% |
| greenyellow | [30:49] | 0 | 0.0% |
| lawngreen | 50+ | 53 | 80.3% |
| All colors | 66 | 100 |
Fuzz blockers
The following nodes represent call sites where fuzz blockers occur.
| Amount of callsites blocked | Calltree index | Parent function | Callsite | Largest blocked function |
|---|---|---|---|---|
| 4 | 2 | compressBound | call site: 00002 | test_deflate |
| 2 | 63 | test_inflate | call site: 00063 | fprintf |
| 1 | 0 | EP | call site: 00000 | compressBound |
| 1 | 16 | mz_deflate | call site: 00016 | tdefl_flush_output_buffer |
| 1 | 18 | tdefl_compress | call site: 00018 | tdefl_flush_block |
| 1 | 20 | tdefl_flush_block | call site: 00020 | tdefl_start_static_block |
| 1 | 31 | tdefl_compress_block | call site: 00031 | tdefl_compress_block |
| 1 | 45 | test_deflate | call site: 00045 | test_inflate |
| 1 | 53 | inflate | call site: 00053 | tinfl_decompress |
Runtime coverage analysis
| Function name | source code lines | source lines hit | percentage hit |
|---|
Files reached
| filename | functions hit |
|---|---|
| inspector/source-codeminiz/tests/small_fuzzer.c | 3 |
| miniz/build/amalgamation/miniz.h | 7 |
| miniz/build/amalgamation/miniz.c | 28 |
Fuzzer: inspector/source-codeminiz/tests/uncompress_fuzzer.c
Call tree
The calltree shows the control flow of the fuzzer. This is overlaid with coverage information to display how much of the potential code a fuzzer can reach is in fact covered at runtime. In the following there is a link to a detailed calltree visualisation as well as a bitmap showing a high-level view of the calltree. For further information about these topics please see the glossary for full calltree and calltree overview
Call tree overview bitmap:
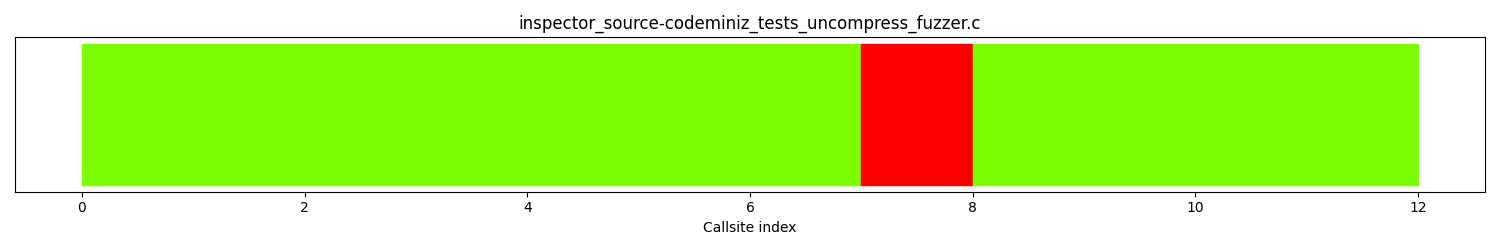
The distribution of callsites in terms of coloring is
| Color | Runtime hitcount | Callsite count | Percentage |
|---|---|---|---|
| red | 0 | 1 | 8.33% |
| gold | [1:9] | 0 | 0.0% |
| yellow | [10:29] | 0 | 0.0% |
| greenyellow | [30:49] | 0 | 0.0% |
| lawngreen | 50+ | 11 | 91.6% |
| All colors | 12 | 100 |
Fuzz blockers
The following nodes represent call sites where fuzz blockers occur.
| Amount of callsites blocked | Calltree index | Parent function | Callsite | Largest blocked function |
|---|---|---|---|---|
| 1 | 6 | mz_uncompress2 | call site: 00006 | tinfl_decompress |
Runtime coverage analysis
| Function name | source code lines | source lines hit | percentage hit |
|---|
Files reached
| filename | functions hit |
|---|---|
| inspector/source-codeminiz/tests/uncompress_fuzzer.c | 1 |
| miniz/build/amalgamation/miniz.h | 1 |
| miniz/build/amalgamation/miniz.c | 8 |
Fuzzer: uncompress_fuzzer
Call tree
The calltree shows the control flow of the fuzzer. This is overlaid with coverage information to display how much of the potential code a fuzzer can reach is in fact covered at runtime. In the following there is a link to a detailed calltree visualisation as well as a bitmap showing a high-level view of the calltree. For further information about these topics please see the glossary for full calltree and calltree overview
Call tree overview bitmap:
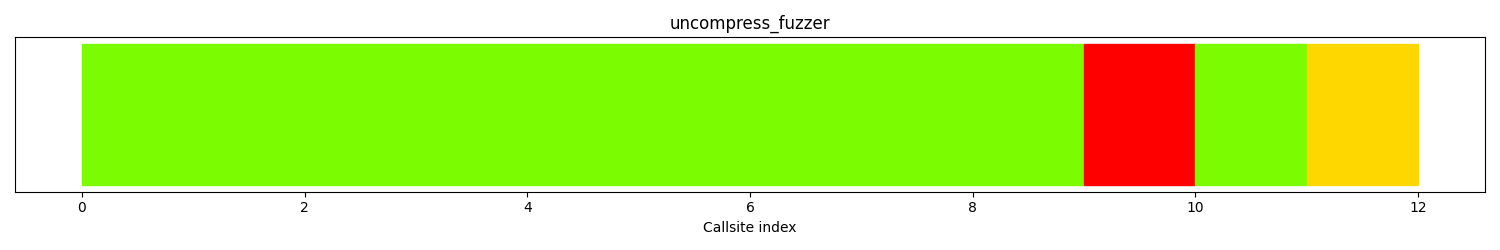
The distribution of callsites in terms of coloring is
| Color | Runtime hitcount | Callsite count | Percentage |
|---|---|---|---|
| red | 0 | 1 | 8.33% |
| gold | [1:9] | 1 | 8.33% |
| yellow | [10:29] | 0 | 0.0% |
| greenyellow | [30:49] | 0 | 0.0% |
| lawngreen | 50+ | 10 | 83.3% |
| All colors | 12 | 100 |
Fuzz blockers
The following nodes represent call sites where fuzz blockers occur.
| Amount of callsites blocked | Calltree index | Parent function | Callsite | Largest blocked function |
|---|---|---|---|---|
| 1 | 8 | tinfl_decompress | call site: 00008 | tinfl_decompress |
Runtime coverage analysis
| Function name | source code lines | source lines hit | percentage hit |
|---|
Files reached
| filename | functions hit |
|---|---|
| inspector/light/source_filesminiz/tests/uncompress_fuzzer.c | 1 |
| miniz/build/amalgamation/miniz.h | 1 |
| miniz/build/amalgamation/miniz.c | 8 |
Fuzzer: small_fuzzer
Call tree
The calltree shows the control flow of the fuzzer. This is overlaid with coverage information to display how much of the potential code a fuzzer can reach is in fact covered at runtime. In the following there is a link to a detailed calltree visualisation as well as a bitmap showing a high-level view of the calltree. For further information about these topics please see the glossary for full calltree and calltree overview
Call tree overview bitmap:
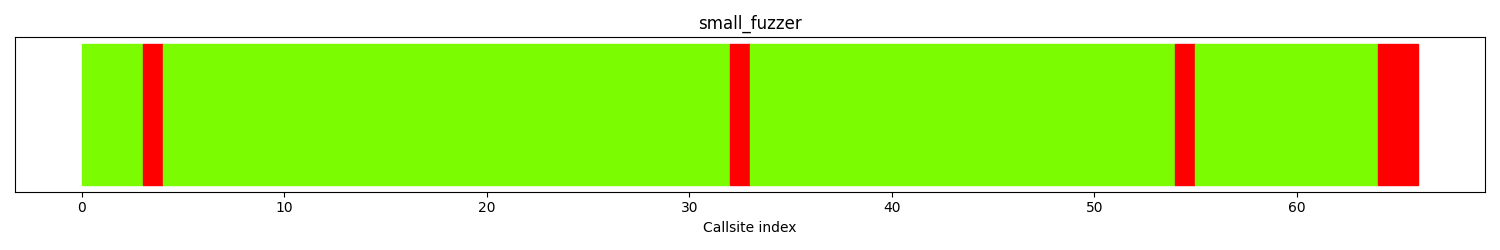
The distribution of callsites in terms of coloring is
| Color | Runtime hitcount | Callsite count | Percentage |
|---|---|---|---|
| red | 0 | 5 | 7.57% |
| gold | [1:9] | 0 | 0.0% |
| yellow | [10:29] | 0 | 0.0% |
| greenyellow | [30:49] | 0 | 0.0% |
| lawngreen | 50+ | 61 | 92.4% |
| All colors | 66 | 100 |
Fuzz blockers
The following nodes represent call sites where fuzz blockers occur.
| Amount of callsites blocked | Calltree index | Parent function | Callsite | Largest blocked function |
|---|---|---|---|---|
| 2 | 63 | test_inflate | call site: 00063 | fprintf |
| 1 | 2 | compressBound | call site: 00002 | mz_deflateBound |
| 1 | 31 | tdefl_compress_block | call site: 00031 | tdefl_compress_block |
| 1 | 53 | inflate | call site: 00053 | tinfl_decompress |
Runtime coverage analysis
| Function name | source code lines | source lines hit | percentage hit |
|---|
Files reached
| filename | functions hit |
|---|---|
| inspector/light/source_filesminiz/tests/small_fuzzer.c | 3 |
| miniz/build/amalgamation/miniz.h | 7 |
| miniz/build/amalgamation/miniz.c | 28 |
Fuzzer: compress_fuzzer
Call tree
The calltree shows the control flow of the fuzzer. This is overlaid with coverage information to display how much of the potential code a fuzzer can reach is in fact covered at runtime. In the following there is a link to a detailed calltree visualisation as well as a bitmap showing a high-level view of the calltree. For further information about these topics please see the glossary for full calltree and calltree overview
Call tree overview bitmap:

The distribution of callsites in terms of coloring is
| Color | Runtime hitcount | Callsite count | Percentage |
|---|---|---|---|
| red | 0 | 5 | 8.77% |
| gold | [1:9] | 0 | 0.0% |
| yellow | [10:29] | 0 | 0.0% |
| greenyellow | [30:49] | 0 | 0.0% |
| lawngreen | 50+ | 52 | 91.2% |
| All colors | 57 | 100 |
Fuzz blockers
The following nodes represent call sites where fuzz blockers occur.
| Amount of callsites blocked | Calltree index | Parent function | Callsite | Largest blocked function |
|---|---|---|---|---|
| 1 | 2 | compressBound | call site: 00002 | mz_deflateBound |
| 1 | 14 | mz_deflate | call site: 00014 | tdefl_flush_output_buffer |
| 1 | 29 | tdefl_compress_block | call site: 00029 | tdefl_compress_block |
| 1 | 34 | mz_deflate | call site: 00034 | mz_deflateEnd |
| 1 | 44 | tinfl_decompress | call site: 00044 | tinfl_decompress |
Runtime coverage analysis
| Function name | source code lines | source lines hit | percentage hit |
|---|
Files reached
| filename | functions hit |
|---|---|
| inspector/light/source_filesminiz/tests/compress_fuzzer.c | 4 |
| miniz/build/amalgamation/miniz.h | 3 |
| miniz/build/amalgamation/miniz.c | 31 |
Fuzzer: inspector/source-codeminiz/tests/uncompress2_fuzzer.c
Call tree
The calltree shows the control flow of the fuzzer. This is overlaid with coverage information to display how much of the potential code a fuzzer can reach is in fact covered at runtime. In the following there is a link to a detailed calltree visualisation as well as a bitmap showing a high-level view of the calltree. For further information about these topics please see the glossary for full calltree and calltree overview
Call tree overview bitmap:
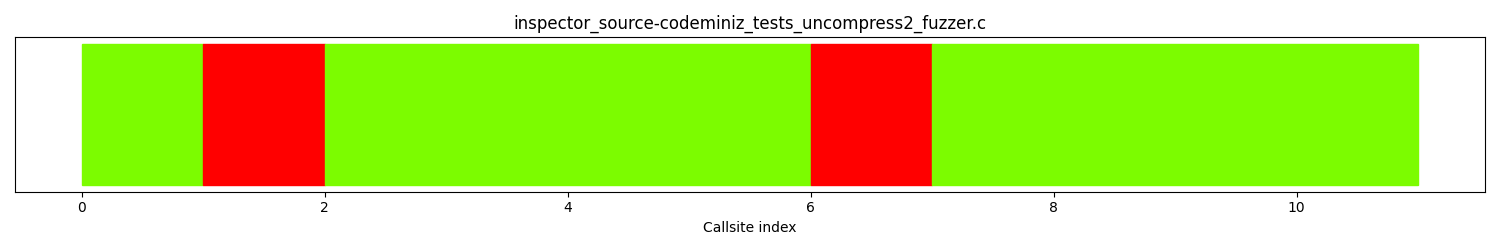
The distribution of callsites in terms of coloring is
| Color | Runtime hitcount | Callsite count | Percentage |
|---|---|---|---|
| red | 0 | 2 | 18.1% |
| gold | [1:9] | 0 | 0.0% |
| yellow | [10:29] | 0 | 0.0% |
| greenyellow | [30:49] | 0 | 0.0% |
| lawngreen | 50+ | 9 | 81.8% |
| All colors | 11 | 100 |
Fuzz blockers
The following nodes represent call sites where fuzz blockers occur.
| Amount of callsites blocked | Calltree index | Parent function | Callsite | Largest blocked function |
|---|---|---|---|---|
| 1 | 0 | EP | call site: 00000 | uncompress2 |
| 1 | 5 | mz_uncompress2 | call site: 00005 | tinfl_decompress |
Runtime coverage analysis
| Function name | source code lines | source lines hit | percentage hit |
|---|
Files reached
| filename | functions hit |
|---|---|
| inspector/source-codeminiz/tests/uncompress2_fuzzer.c | 1 |
| miniz/build/amalgamation/miniz.h | 1 |
| miniz/build/amalgamation/miniz.c | 7 |
Fuzzer: miniz/tests/large_fuzzer.c
Call tree
The calltree shows the control flow of the fuzzer. This is overlaid with coverage information to display how much of the potential code a fuzzer can reach is in fact covered at runtime. In the following there is a link to a detailed calltree visualisation as well as a bitmap showing a high-level view of the calltree. For further information about these topics please see the glossary for full calltree and calltree overview
Call tree overview bitmap:
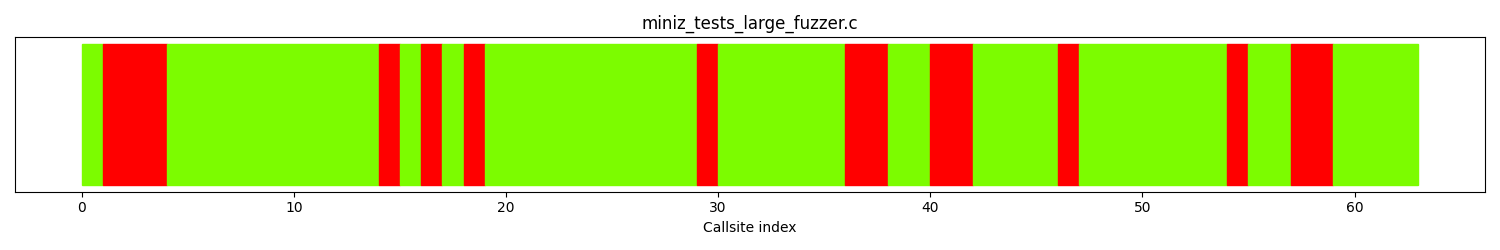
The distribution of callsites in terms of coloring is
| Color | Runtime hitcount | Callsite count | Percentage |
|---|---|---|---|
| red | 0 | 15 | 23.8% |
| gold | [1:9] | 0 | 0.0% |
| yellow | [10:29] | 0 | 0.0% |
| greenyellow | [30:49] | 0 | 0.0% |
| lawngreen | 50+ | 48 | 76.1% |
| All colors | 63 | 100 |
Fuzz blockers
The following nodes represent call sites where fuzz blockers occur.
| Amount of callsites blocked | Calltree index | Parent function | Callsite | Largest blocked function |
|---|---|---|---|---|
| 3 | 0 | EP | call site: 00000 | test_large_deflate |
| 2 | 35 | test_large_deflate | call site: 00035 | fprintf |
| 2 | 39 | test_large_deflate | call site: 00039 | fprintf |
| 2 | 56 | mz_inflate | call site: 00056 | fprintf |
| 1 | 13 | mz_deflate | call site: 00013 | tdefl_flush_output_buffer |
| 1 | 15 | tdefl_compress | call site: 00015 | tdefl_flush_block |
| 1 | 17 | tdefl_flush_block | call site: 00017 | tdefl_start_static_block |
| 1 | 28 | tdefl_compress_block | call site: 00028 | tdefl_compress_block |
| 1 | 45 | test_large_deflate | call site: 00045 | test_large_inflate |
| 1 | 53 | inflate | call site: 00053 | tinfl_decompress |
Runtime coverage analysis
| Function name | source code lines | source lines hit | percentage hit |
|---|
Files reached
| filename | functions hit |
|---|---|
| miniz/tests/large_fuzzer.c | 3 |
| miniz/build/amalgamation/miniz.h | 6 |
| miniz/build/amalgamation/miniz.c | 26 |
Fuzzer: miniz/tests/compress_fuzzer.c
Call tree
The calltree shows the control flow of the fuzzer. This is overlaid with coverage information to display how much of the potential code a fuzzer can reach is in fact covered at runtime. In the following there is a link to a detailed calltree visualisation as well as a bitmap showing a high-level view of the calltree. For further information about these topics please see the glossary for full calltree and calltree overview
Call tree overview bitmap:

The distribution of callsites in terms of coloring is
| Color | Runtime hitcount | Callsite count | Percentage |
|---|---|---|---|
| red | 0 | 15 | 26.3% |
| gold | [1:9] | 0 | 0.0% |
| yellow | [10:29] | 0 | 0.0% |
| greenyellow | [30:49] | 0 | 0.0% |
| lawngreen | 50+ | 42 | 73.6% |
| All colors | 57 | 100 |
Fuzz blockers
The following nodes represent call sites where fuzz blockers occur.
| Amount of callsites blocked | Calltree index | Parent function | Callsite | Largest blocked function |
|---|---|---|---|---|
| 4 | 2 | compressBound | call site: 00002 | check_compress_level |
| 4 | 50 | check_compress_level | call site: 00050 | check_compress_level |
| 1 | 0 | EP | call site: 00000 | compressBound |
| 1 | 14 | mz_deflate | call site: 00014 | tdefl_flush_output_buffer |
| 1 | 16 | tdefl_compress | call site: 00016 | tdefl_flush_block |
| 1 | 18 | tdefl_flush_block | call site: 00018 | tdefl_start_static_block |
| 1 | 29 | tdefl_compress_block | call site: 00029 | tdefl_compress_block |
| 1 | 34 | mz_deflate | call site: 00034 | mz_deflateEnd |
| 1 | 42 | mz_uncompress2 | call site: 00042 | tinfl_decompress |
Runtime coverage analysis
| Function name | source code lines | source lines hit | percentage hit |
|---|
Files reached
| filename | functions hit |
|---|---|
| miniz/tests/compress_fuzzer.c | 4 |
| miniz/build/amalgamation/miniz.h | 3 |
| miniz/build/amalgamation/miniz.c | 31 |
Fuzzer: miniz/tests/uncompress2_fuzzer.c
Call tree
The calltree shows the control flow of the fuzzer. This is overlaid with coverage information to display how much of the potential code a fuzzer can reach is in fact covered at runtime. In the following there is a link to a detailed calltree visualisation as well as a bitmap showing a high-level view of the calltree. For further information about these topics please see the glossary for full calltree and calltree overview
Call tree overview bitmap:
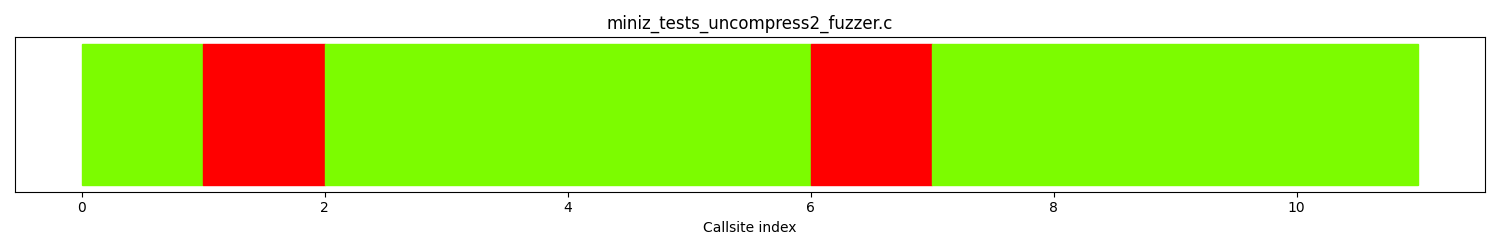
The distribution of callsites in terms of coloring is
| Color | Runtime hitcount | Callsite count | Percentage |
|---|---|---|---|
| red | 0 | 2 | 18.1% |
| gold | [1:9] | 0 | 0.0% |
| yellow | [10:29] | 0 | 0.0% |
| greenyellow | [30:49] | 0 | 0.0% |
| lawngreen | 50+ | 9 | 81.8% |
| All colors | 11 | 100 |
Fuzz blockers
The following nodes represent call sites where fuzz blockers occur.
| Amount of callsites blocked | Calltree index | Parent function | Callsite | Largest blocked function |
|---|---|---|---|---|
| 1 | 0 | EP | call site: 00000 | uncompress2 |
| 1 | 5 | mz_uncompress2 | call site: 00005 | tinfl_decompress |
Runtime coverage analysis
| Function name | source code lines | source lines hit | percentage hit |
|---|
Files reached
| filename | functions hit |
|---|---|
| miniz/tests/uncompress2_fuzzer.c | 1 |
| miniz/build/amalgamation/miniz.h | 1 |
| miniz/build/amalgamation/miniz.c | 7 |
Fuzzer: miniz/tests/zip_fuzzer.c
Call tree
The calltree shows the control flow of the fuzzer. This is overlaid with coverage information to display how much of the potential code a fuzzer can reach is in fact covered at runtime. In the following there is a link to a detailed calltree visualisation as well as a bitmap showing a high-level view of the calltree. For further information about these topics please see the glossary for full calltree and calltree overview
Call tree overview bitmap:

The distribution of callsites in terms of coloring is
| Color | Runtime hitcount | Callsite count | Percentage |
|---|---|---|---|
| red | 0 | 15 | 25.4% |
| gold | [1:9] | 0 | 0.0% |
| yellow | [10:29] | 0 | 0.0% |
| greenyellow | [30:49] | 0 | 0.0% |
| lawngreen | 50+ | 44 | 74.5% |
| All colors | 59 | 100 |
Fuzz blockers
The following nodes represent call sites where fuzz blockers occur.
| Amount of callsites blocked | Calltree index | Parent function | Callsite | Largest blocked function |
|---|---|---|---|---|
| 6 | 27 | mz_zip_validate_file | call site: 00027 | mz_zip_reader_extract_to_callback |
| 4 | 47 | mz_zip_locate_file_binary_search | call site: 00047 | strlen |
| 3 | 34 | tinfl_decompress | call site: 00034 | mz_zip_compute_crc32_callback |
| 1 | 12 | mz_zip_reader_init_mem | call site: 00012 | fclose |
| 1 | 43 | LLVMFuzzerTestOneInput | call site: 00043 | mz_zip_reader_extract_file_to_mem_no_alloc |
Runtime coverage analysis
| Function name | source code lines | source lines hit | percentage hit |
|---|
Files reached
| filename | functions hit |
|---|---|
| miniz/tests/zip_fuzzer.c | 1 |
| miniz/build/amalgamation/miniz.c | 32 |
Fuzzer: inspector/source-codeminiz/tests/flush_fuzzer.c
Call tree
The calltree shows the control flow of the fuzzer. This is overlaid with coverage information to display how much of the potential code a fuzzer can reach is in fact covered at runtime. In the following there is a link to a detailed calltree visualisation as well as a bitmap showing a high-level view of the calltree. For further information about these topics please see the glossary for full calltree and calltree overview
Call tree overview bitmap:
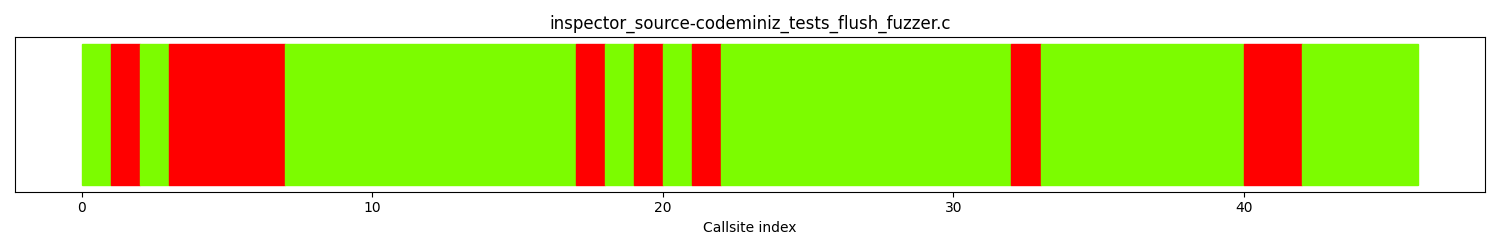
The distribution of callsites in terms of coloring is
| Color | Runtime hitcount | Callsite count | Percentage |
|---|---|---|---|
| red | 0 | 11 | 23.9% |
| gold | [1:9] | 0 | 0.0% |
| yellow | [10:29] | 0 | 0.0% |
| greenyellow | [30:49] | 0 | 0.0% |
| lawngreen | 50+ | 35 | 76.0% |
| All colors | 46 | 100 |
Fuzz blockers
The following nodes represent call sites where fuzz blockers occur.
| Amount of callsites blocked | Calltree index | Parent function | Callsite | Largest blocked function |
|---|---|---|---|---|
| 4 | 2 | compressBound | call site: 00002 | test_flush |
| 2 | 39 | test_flush | call site: 00039 | fprintf |
| 1 | 0 | EP | call site: 00000 | compressBound |
| 1 | 16 | mz_deflate | call site: 00016 | tdefl_flush_output_buffer |
| 1 | 18 | tdefl_compress | call site: 00018 | tdefl_flush_block |
| 1 | 20 | tdefl_flush_block | call site: 00020 | tdefl_start_static_block |
| 1 | 31 | tdefl_compress_block | call site: 00031 | tdefl_compress_block |
Runtime coverage analysis
| Function name | source code lines | source lines hit | percentage hit |
|---|
Files reached
| filename | functions hit |
|---|---|
| inspector/source-codeminiz/tests/flush_fuzzer.c | 2 |
| miniz/build/amalgamation/miniz.h | 4 |
| miniz/build/amalgamation/miniz.c | 22 |
Fuzzer: miniz/tests/flush_fuzzer.c
Call tree
The calltree shows the control flow of the fuzzer. This is overlaid with coverage information to display how much of the potential code a fuzzer can reach is in fact covered at runtime. In the following there is a link to a detailed calltree visualisation as well as a bitmap showing a high-level view of the calltree. For further information about these topics please see the glossary for full calltree and calltree overview
Call tree overview bitmap:
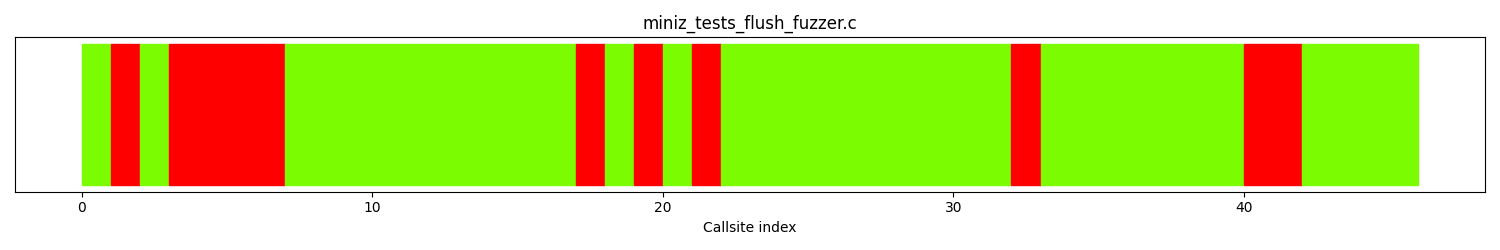
The distribution of callsites in terms of coloring is
| Color | Runtime hitcount | Callsite count | Percentage |
|---|---|---|---|
| red | 0 | 11 | 23.9% |
| gold | [1:9] | 0 | 0.0% |
| yellow | [10:29] | 0 | 0.0% |
| greenyellow | [30:49] | 0 | 0.0% |
| lawngreen | 50+ | 35 | 76.0% |
| All colors | 46 | 100 |
Fuzz blockers
The following nodes represent call sites where fuzz blockers occur.
| Amount of callsites blocked | Calltree index | Parent function | Callsite | Largest blocked function |
|---|---|---|---|---|
| 4 | 2 | compressBound | call site: 00002 | test_flush |
| 2 | 39 | test_flush | call site: 00039 | fprintf |
| 1 | 0 | EP | call site: 00000 | compressBound |
| 1 | 16 | mz_deflate | call site: 00016 | tdefl_flush_output_buffer |
| 1 | 18 | tdefl_compress | call site: 00018 | tdefl_flush_block |
| 1 | 20 | tdefl_flush_block | call site: 00020 | tdefl_start_static_block |
| 1 | 31 | tdefl_compress_block | call site: 00031 | tdefl_compress_block |
Runtime coverage analysis
| Function name | source code lines | source lines hit | percentage hit |
|---|
Files reached
| filename | functions hit |
|---|---|
| miniz/tests/flush_fuzzer.c | 2 |
| miniz/build/amalgamation/miniz.h | 4 |
| miniz/build/amalgamation/miniz.c | 22 |
Fuzzer: inspector/source-codeminiz/tests/add_in_place_fuzzer.c
Call tree
The calltree shows the control flow of the fuzzer. This is overlaid with coverage information to display how much of the potential code a fuzzer can reach is in fact covered at runtime. In the following there is a link to a detailed calltree visualisation as well as a bitmap showing a high-level view of the calltree. For further information about these topics please see the glossary for full calltree and calltree overview
Call tree overview bitmap:
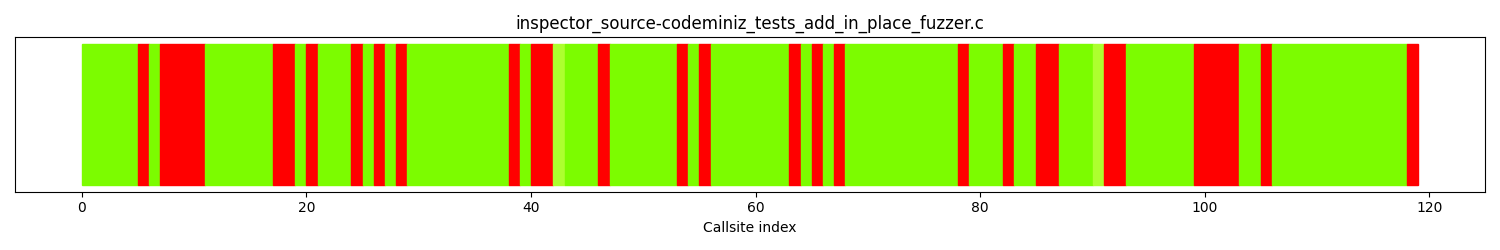
The distribution of callsites in terms of coloring is
| Color | Runtime hitcount | Callsite count | Percentage |
|---|---|---|---|
| red | 0 | 32 | 26.8% |
| gold | [1:9] | 0 | 0.0% |
| yellow | [10:29] | 0 | 0.0% |
| greenyellow | [30:49] | 2 | 1.68% |
| lawngreen | 50+ | 85 | 71.4% |
| All colors | 119 | 100 |
Fuzz blockers
The following nodes represent call sites where fuzz blockers occur.
| Amount of callsites blocked | Calltree index | Parent function | Callsite | Largest blocked function |
|---|---|---|---|---|
| 4 | 6 | read_buffer | call site: 00006 | mz_zip_add_mem_to_archive_file_in_place |
| 4 | 98 | mz_zip_locate_file_binary_search | call site: 00098 | strlen |
| 2 | 16 | mz_zip_writer_init_file_v2 | call site: 00016 | mz_zip_writer_end |
| 2 | 39 | mz_zip_add_mem_to_archive_file_in_place_v2 | call site: 00039 | mz_zip_reader_end_internal |
| 2 | 84 | mz_zip_writer_add_to_central_dir | call site: 00084 | mz_zip_array_ensure_capacity |
| 2 | 90 | mz_zip_add_mem_to_archive_file_in_place_v2 | call site: 00090 | mz_zip_extract_archive_file_to_heap |
| 1 | 4 | read_string | call site: 00004 | read_buffer |
| 1 | 19 | mz_zip_writer_end_internal | call site: 00019 | mz_zip_writer_end |
| 1 | 23 | mz_zip_reader_init_file_v2 | call site: 00023 | fclose |
| 1 | 25 | mz_zip_reader_init_file_v2 | call site: 00025 | fclose |
| 1 | 27 | mz_zip_reader_init_file_v2 | call site: 00027 | fclose |
| 1 | 37 | mz_zip_reader_init_file_v2 | call site: 00037 | fclose |
Runtime coverage analysis
| Function name | source code lines | source lines hit | percentage hit |
|---|
Files reached
| filename | functions hit |
|---|---|
| inspector/source-codeminiz/tests/add_in_place_fuzzer.c | 4 |
| miniz/build/amalgamation/miniz.c | 60 |
Analyses and suggestions
Optimal target analysis
Remaining optimal interesting functions
The following table shows a list of functions that are optimal targets. Optimal targets are identified by finding the functions that in combination, yield a high code coverage.
| Func name | Functions filename | Arg count | Args | Function depth | hitcount | instr count | bb count | cyclomatic complexity | Reachable functions | Incoming references | total cyclomatic complexity | Unreached complexity |
|---|---|---|---|---|---|---|---|---|---|---|---|---|
mz_zip_writer_add_from_zip_reader
|
/src/miniz/build/amalgamation/miniz.c | 3 | ['N/A', 'N/A', 'int'] | 3 | 0 | 1210 | 207 | 82 | 10 | 0 | 161 | 95 |
mz_zip_writer_add_file
|
/src/miniz/build/amalgamation/miniz.c | 6 | ['N/A', 'N/A', 'N/A', 'N/A', 'short', 'int'] | 9 | 0 | 56 | 12 | 6 | 39 | 0 | 652 | 92 |
Implementing fuzzers that target the above functions will improve reachability such that it becomes:
All functions overview
If you implement fuzzers for these functions, the status of all functions in the project will be:
| Func name | Functions filename | Args | Function call depth | Reached by Fuzzers | Runtime reached by Fuzzers | Combined reached by Fuzzers | Fuzzers runtime hit | Func lines hit % | I Count | BB Count | Cyclomatic complexity | Functions reached | Reached by functions | Accumulated cyclomatic complexity | Undiscovered complexity |
|---|
Fuzz engine guidance
This sections provides heuristics that can be used as input to a fuzz engine when running a given fuzz target. The current focus is on providing input that is usable by libFuzzer.
inspector/light/source_filesminiz/tests/uncompress2_fuzzer.c
Dictionary
Use this with the libFuzzer -dict=DICT.file flag
Fuzzer function priority
Use one of these functions as input to libfuzzer with flag: -focus_function name
-focus_function=['tinfl_decompress']inspector/light/source_filesminiz/tests/zip_fuzzer.c
Dictionary
Use this with the libFuzzer -dict=DICT.file flag
Fuzzer function priority
Use one of these functions as input to libfuzzer with flag: -focus_function name
-focus_function=['mz_zip_validate_file', 'mz_zip_locate_file_binary_search', 'tinfl_decompress', 'mz_zip_reader_init_mem', 'LLVMFuzzerTestOneInput']inspector/light/source_filesminiz/tests/large_fuzzer.c
Dictionary
Use this with the libFuzzer -dict=DICT.file flag
Fuzzer function priority
Use one of these functions as input to libfuzzer with flag: -focus_function name
-focus_function=['tdefl_flush_block', 'test_large_deflate', 'mz_inflate', 'mz_deflate', 'tdefl_compress', 'tdefl_optimize_huffman_table', 'tdefl_compress_block', 'inflate']inspector/light/source_filesminiz/tests/checksum_fuzzer.c
Dictionary
Use this with the libFuzzer -dict=DICT.file flag
inspector/light/source_filesminiz/tests/add_in_place_fuzzer.c
Dictionary
Use this with the libFuzzer -dict=DICT.file flag
Fuzzer function priority
Use one of these functions as input to libfuzzer with flag: -focus_function name
-focus_function=['mz_zip_writer_init_file_v2', 'mz_zip_reader_read_central_dir', 'mz_zip_add_mem_to_archive_file_in_place_v2', 'tdefl_compress_block', 'mz_zip_writer_add_to_central_dir', 'mz_zip_extract_archive_file_to_heap_v2', 'LLVMFuzzerTestOneInput', 'mz_zip_writer_end_internal', 'mz_zip_reader_init_file_v2']inspector/source-codeminiz/tests/checksum_fuzzer.c
Dictionary
Use this with the libFuzzer -dict=DICT.file flag
Fuzzer function priority
Use one of these functions as input to libfuzzer with flag: -focus_function name
-focus_function=['LLVMFuzzerTestOneInput']miniz/tests/add_in_place_fuzzer.c
Dictionary
Use this with the libFuzzer -dict=DICT.file flag
Fuzzer function priority
Use one of these functions as input to libfuzzer with flag: -focus_function name
-focus_function=['read_buffer', 'mz_zip_locate_file_binary_search', 'mz_zip_writer_init_file_v2', 'mz_zip_add_mem_to_archive_file_in_place_v2', 'mz_zip_writer_add_to_central_dir', 'read_string', 'mz_zip_writer_end_internal', 'mz_zip_reader_init_file_v2']inspector/source-codeminiz/tests/large_fuzzer.c
Dictionary
Use this with the libFuzzer -dict=DICT.file flag
Fuzzer function priority
Use one of these functions as input to libfuzzer with flag: -focus_function name
-focus_function=['test_large_deflate', 'mz_inflate', 'mz_deflate', 'tdefl_compress', 'tdefl_flush_block', 'tdefl_compress_block', 'inflate']miniz/tests/uncompress_fuzzer.c
Dictionary
Use this with the libFuzzer -dict=DICT.file flag
Fuzzer function priority
Use one of these functions as input to libfuzzer with flag: -focus_function name
-focus_function=['mz_uncompress2']inspector/source-codeminiz/tests/compress_fuzzer.c
Dictionary
Use this with the libFuzzer -dict=DICT.file flag
Fuzzer function priority
Use one of these functions as input to libfuzzer with flag: -focus_function name
-focus_function=['compressBound', 'check_compress_level', 'mz_deflate', 'tdefl_compress', 'tdefl_flush_block', 'tdefl_compress_block', 'mz_uncompress2']miniz/tests/checksum_fuzzer.c
Dictionary
Use this with the libFuzzer -dict=DICT.file flag
Fuzzer function priority
Use one of these functions as input to libfuzzer with flag: -focus_function name
-focus_function=['LLVMFuzzerTestOneInput']miniz/tests/small_fuzzer.c
Dictionary
Use this with the libFuzzer -dict=DICT.file flag
Fuzzer function priority
Use one of these functions as input to libfuzzer with flag: -focus_function name
-focus_function=['compressBound', 'test_inflate', 'mz_deflate', 'tdefl_compress', 'tdefl_flush_block', 'tdefl_compress_block', 'test_deflate', 'inflate']inspector/source-codeminiz/tests/zip_fuzzer.c
Dictionary
Use this with the libFuzzer -dict=DICT.file flag
Fuzzer function priority
Use one of these functions as input to libfuzzer with flag: -focus_function name
-focus_function=['mz_zip_validate_file', 'mz_zip_locate_file_binary_search', 'tinfl_decompress', 'mz_zip_reader_init_mem', 'LLVMFuzzerTestOneInput']inspector/light/source_filesminiz/tests/flush_fuzzer.c
Dictionary
Use this with the libFuzzer -dict=DICT.file flag
Fuzzer function priority
Use one of these functions as input to libfuzzer with flag: -focus_function name
-focus_function=['test_flush', 'compressBound', 'mz_deflate', 'tdefl_compress_block']inspector/source-codeminiz/tests/small_fuzzer.c
Dictionary
Use this with the libFuzzer -dict=DICT.file flag
Fuzzer function priority
Use one of these functions as input to libfuzzer with flag: -focus_function name
-focus_function=['compressBound', 'test_inflate', 'mz_deflate', 'tdefl_compress', 'tdefl_flush_block', 'tdefl_compress_block', 'test_deflate', 'inflate']inspector/source-codeminiz/tests/uncompress_fuzzer.c
Dictionary
Use this with the libFuzzer -dict=DICT.file flag
Fuzzer function priority
Use one of these functions as input to libfuzzer with flag: -focus_function name
-focus_function=['mz_uncompress2']inspector/light/source_filesminiz/tests/uncompress_fuzzer.c
Dictionary
Use this with the libFuzzer -dict=DICT.file flag
Fuzzer function priority
Use one of these functions as input to libfuzzer with flag: -focus_function name
-focus_function=['tinfl_decompress']inspector/light/source_filesminiz/tests/small_fuzzer.c
Dictionary
Use this with the libFuzzer -dict=DICT.file flag
Fuzzer function priority
Use one of these functions as input to libfuzzer with flag: -focus_function name
-focus_function=['test_inflate', 'compressBound', 'tdefl_compress_block', 'inflate']inspector/light/source_filesminiz/tests/compress_fuzzer.c
Dictionary
Use this with the libFuzzer -dict=DICT.file flag
Fuzzer function priority
Use one of these functions as input to libfuzzer with flag: -focus_function name
-focus_function=['compressBound', 'mz_deflate', 'tdefl_compress_block', 'tinfl_decompress']inspector/source-codeminiz/tests/uncompress2_fuzzer.c
Dictionary
Use this with the libFuzzer -dict=DICT.file flag
Fuzzer function priority
Use one of these functions as input to libfuzzer with flag: -focus_function name
-focus_function=['mz_uncompress2']miniz/tests/large_fuzzer.c
Dictionary
Use this with the libFuzzer -dict=DICT.file flag
Fuzzer function priority
Use one of these functions as input to libfuzzer with flag: -focus_function name
-focus_function=['test_large_deflate', 'mz_inflate', 'mz_deflate', 'tdefl_compress', 'tdefl_flush_block', 'tdefl_compress_block', 'inflate']miniz/tests/compress_fuzzer.c
Dictionary
Use this with the libFuzzer -dict=DICT.file flag
Fuzzer function priority
Use one of these functions as input to libfuzzer with flag: -focus_function name
-focus_function=['compressBound', 'check_compress_level', 'mz_deflate', 'tdefl_compress', 'tdefl_flush_block', 'tdefl_compress_block', 'mz_uncompress2']miniz/tests/uncompress2_fuzzer.c
Dictionary
Use this with the libFuzzer -dict=DICT.file flag
Fuzzer function priority
Use one of these functions as input to libfuzzer with flag: -focus_function name
-focus_function=['mz_uncompress2']miniz/tests/zip_fuzzer.c
Dictionary
Use this with the libFuzzer -dict=DICT.file flag
Fuzzer function priority
Use one of these functions as input to libfuzzer with flag: -focus_function name
-focus_function=['mz_zip_validate_file', 'mz_zip_locate_file_binary_search', 'tinfl_decompress', 'mz_zip_reader_init_mem', 'LLVMFuzzerTestOneInput']inspector/source-codeminiz/tests/flush_fuzzer.c
Dictionary
Use this with the libFuzzer -dict=DICT.file flag
Fuzzer function priority
Use one of these functions as input to libfuzzer with flag: -focus_function name
-focus_function=['compressBound', 'test_flush', 'mz_deflate', 'tdefl_compress', 'tdefl_flush_block', 'tdefl_compress_block']miniz/tests/flush_fuzzer.c
Dictionary
Use this with the libFuzzer -dict=DICT.file flag
Fuzzer function priority
Use one of these functions as input to libfuzzer with flag: -focus_function name
-focus_function=['compressBound', 'test_flush', 'mz_deflate', 'tdefl_compress', 'tdefl_flush_block', 'tdefl_compress_block']inspector/source-codeminiz/tests/add_in_place_fuzzer.c
Dictionary
Use this with the libFuzzer -dict=DICT.file flag
Fuzzer function priority
Use one of these functions as input to libfuzzer with flag: -focus_function name
-focus_function=['read_buffer', 'mz_zip_locate_file_binary_search', 'mz_zip_writer_init_file_v2', 'mz_zip_add_mem_to_archive_file_in_place_v2', 'mz_zip_writer_add_to_central_dir', 'read_string', 'mz_zip_writer_end_internal', 'mz_zip_reader_init_file_v2']Runtime coverage analysis
This section shows analysis of runtime coverage data.
For futher technical details on how this section is generated, please see the Glossary .
Complex functions with low coverage
| Func name | Function total lines | Lines covered at runtime | percentage covered | Reached by fuzzers |
|---|---|---|---|---|
| mz_zip_writer_init_file_v2 | 35 | 14 | 40.0% | ['/src/miniz/tests/small_fuzzer.c', '/src/inspector/source-code/src/miniz/tests/small_fuzzer.c', '/src/inspector/source-code/src/miniz/tests/compress_fuzzer.c', '/src/inspector/source-code/src/miniz/tests/large_fuzzer.c', '/src/miniz/tests/zip_fuzzer.c', '/src/inspector/source-code/src/miniz/tests/checksum_fuzzer.c', '/src/miniz/tests/uncompress_fuzzer.c', '/src/miniz/tests/add_in_place_fuzzer.c', '/src/miniz/tests/large_fuzzer.c', '/src/miniz/tests/compress_fuzzer.c', '/src/inspector/source-code/src/miniz/tests/flush_fuzzer.c', '/src/inspector/source-code/src/miniz/tests/zip_fuzzer.c', '/src/miniz/tests/flush_fuzzer.c', '/src/miniz/tests/uncompress2_fuzzer.c', '/src/inspector/source-code/src/miniz/tests/add_in_place_fuzzer.c', '/src/miniz/tests/checksum_fuzzer.c', '/src/inspector/source-code/src/miniz/tests/uncompress2_fuzzer.c', 'add_in_place_fuzzer', '/src/inspector/source-code/src/miniz/tests/uncompress_fuzzer.c'] |
Files and Directories in report
This section shows which files and directories are considered in this report. The main reason for showing this is fuzz introspector may include more code in the reasoning than is desired. This section helps identify if too many files/directories are included, e.g. third party code, which may be irrelevant for the threat model. In the event too much is included, fuzz introspector supports a configuration file that can exclude data from the report. See the following link for more information on how to create a config file: link
Files in report
| Source file | Reached by | Covered by |
|---|---|---|
| [] | [] | |
| /src/miniz/tests/small_fuzzer.c | ['miniz/tests/small_fuzzer.c'] | ['miniz/tests/small_fuzzer.c'] |
| /src/inspector/source-code/src/miniz/tests/small_fuzzer.c | ['inspector/source-codeminiz/tests/small_fuzzer.c'] | ['inspector/source-codeminiz/tests/small_fuzzer.c'] |
| /src/inspector/light/source_files/src/miniz/tests/flush_fuzzer.c | ['flush_fuzzer'] | ['flush_fuzzer'] |
| /src/inspector/source-code/src/miniz/tests/compress_fuzzer.c | ['inspector/source-codeminiz/tests/compress_fuzzer.c'] | ['inspector/source-codeminiz/tests/compress_fuzzer.c'] |
| /src/inspector/light/source_files/src/miniz/tests/add_in_place_fuzzer.c | ['add_in_place_fuzzer'] | ['add_in_place_fuzzer'] |
| /src/inspector/source-code/src/miniz/tests/large_fuzzer.c | ['inspector/source-codeminiz/tests/large_fuzzer.c'] | ['inspector/source-codeminiz/tests/large_fuzzer.c'] |
| /src/miniz/tests/zip_fuzzer.c | ['miniz/tests/zip_fuzzer.c'] | ['miniz/tests/zip_fuzzer.c'] |
| /src/inspector/light/source_files/src/miniz/tests/large_fuzzer.c | ['large_fuzzer'] | ['large_fuzzer'] |
| /src/inspector/source-code/src/miniz/tests/checksum_fuzzer.c | ['inspector/source-codeminiz/tests/checksum_fuzzer.c'] | ['inspector/source-codeminiz/tests/checksum_fuzzer.c'] |
| /src/miniz/tests/uncompress_fuzzer.c | ['miniz/tests/uncompress_fuzzer.c'] | ['miniz/tests/uncompress_fuzzer.c'] |
| /src/inspector/light/source_files/src/miniz/tests/small_fuzzer.c | ['small_fuzzer'] | ['small_fuzzer'] |
| /src/miniz/tests/add_in_place_fuzzer.c | ['miniz/tests/add_in_place_fuzzer.c'] | ['miniz/tests/add_in_place_fuzzer.c'] |
| /src/miniz/tests/large_fuzzer.c | ['miniz/tests/large_fuzzer.c'] | ['miniz/tests/large_fuzzer.c'] |
| /src/inspector/light/source_files/src/miniz/tests/zip_fuzzer.c | ['zip_fuzzer'] | ['zip_fuzzer'] |
| /src/miniz/tests/compress_fuzzer.c | ['miniz/tests/compress_fuzzer.c'] | ['miniz/tests/compress_fuzzer.c'] |
| /src/inspector/source-code/src/miniz/tests/flush_fuzzer.c | ['inspector/source-codeminiz/tests/flush_fuzzer.c'] | ['inspector/source-codeminiz/tests/flush_fuzzer.c'] |
| /src/miniz/build/amalgamation/miniz.c | ['uncompress2_fuzzer', 'zip_fuzzer', 'large_fuzzer', 'checksum_fuzzer', 'add_in_place_fuzzer', 'inspector/source-codeminiz/tests/checksum_fuzzer.c', 'miniz/tests/add_in_place_fuzzer.c', 'inspector/source-codeminiz/tests/large_fuzzer.c', 'miniz/tests/uncompress_fuzzer.c', 'inspector/source-codeminiz/tests/compress_fuzzer.c', 'miniz/tests/checksum_fuzzer.c', 'miniz/tests/small_fuzzer.c', 'inspector/source-codeminiz/tests/zip_fuzzer.c', 'flush_fuzzer', 'inspector/source-codeminiz/tests/small_fuzzer.c', 'inspector/source-codeminiz/tests/uncompress_fuzzer.c', 'uncompress_fuzzer', 'small_fuzzer', 'compress_fuzzer', 'inspector/source-codeminiz/tests/uncompress2_fuzzer.c', 'miniz/tests/large_fuzzer.c', 'miniz/tests/compress_fuzzer.c', 'miniz/tests/uncompress2_fuzzer.c', 'miniz/tests/zip_fuzzer.c', 'inspector/source-codeminiz/tests/flush_fuzzer.c', 'miniz/tests/flush_fuzzer.c', 'inspector/source-codeminiz/tests/add_in_place_fuzzer.c'] | ['uncompress2_fuzzer', 'zip_fuzzer', 'large_fuzzer', 'checksum_fuzzer', 'add_in_place_fuzzer', 'inspector/source-codeminiz/tests/checksum_fuzzer.c', 'miniz/tests/add_in_place_fuzzer.c', 'inspector/source-codeminiz/tests/large_fuzzer.c', 'miniz/tests/uncompress_fuzzer.c', 'inspector/source-codeminiz/tests/compress_fuzzer.c', 'miniz/tests/checksum_fuzzer.c', 'miniz/tests/small_fuzzer.c', 'inspector/source-codeminiz/tests/zip_fuzzer.c', 'flush_fuzzer', 'inspector/source-codeminiz/tests/small_fuzzer.c', 'inspector/source-codeminiz/tests/uncompress_fuzzer.c', 'uncompress_fuzzer', 'small_fuzzer', 'compress_fuzzer', 'inspector/source-codeminiz/tests/uncompress2_fuzzer.c', 'miniz/tests/large_fuzzer.c', 'miniz/tests/compress_fuzzer.c', 'miniz/tests/uncompress2_fuzzer.c', 'miniz/tests/zip_fuzzer.c', 'inspector/source-codeminiz/tests/flush_fuzzer.c', 'miniz/tests/flush_fuzzer.c', 'inspector/source-codeminiz/tests/add_in_place_fuzzer.c'] |
| /src/inspector/light/source_files/src/miniz/tests/uncompress2_fuzzer.c | ['uncompress2_fuzzer'] | ['uncompress2_fuzzer'] |
| /src/inspector/source-code/src/miniz/tests/zip_fuzzer.c | ['inspector/source-codeminiz/tests/zip_fuzzer.c'] | ['inspector/source-codeminiz/tests/zip_fuzzer.c'] |
| /src/miniz/tests/flush_fuzzer.c | ['miniz/tests/flush_fuzzer.c'] | ['miniz/tests/flush_fuzzer.c'] |
| /src/miniz/build/amalgamation/miniz.h | ['uncompress2_fuzzer', 'large_fuzzer', 'checksum_fuzzer', 'inspector/source-codeminiz/tests/checksum_fuzzer.c', 'inspector/source-codeminiz/tests/large_fuzzer.c', 'miniz/tests/uncompress_fuzzer.c', 'inspector/source-codeminiz/tests/compress_fuzzer.c', 'miniz/tests/checksum_fuzzer.c', 'miniz/tests/small_fuzzer.c', 'flush_fuzzer', 'inspector/source-codeminiz/tests/small_fuzzer.c', 'inspector/source-codeminiz/tests/uncompress_fuzzer.c', 'uncompress_fuzzer', 'small_fuzzer', 'compress_fuzzer', 'inspector/source-codeminiz/tests/uncompress2_fuzzer.c', 'miniz/tests/large_fuzzer.c', 'miniz/tests/compress_fuzzer.c', 'miniz/tests/uncompress2_fuzzer.c', 'inspector/source-codeminiz/tests/flush_fuzzer.c', 'miniz/tests/flush_fuzzer.c'] | ['uncompress2_fuzzer', 'large_fuzzer', 'checksum_fuzzer', 'inspector/source-codeminiz/tests/checksum_fuzzer.c', 'inspector/source-codeminiz/tests/large_fuzzer.c', 'miniz/tests/uncompress_fuzzer.c', 'inspector/source-codeminiz/tests/compress_fuzzer.c', 'miniz/tests/checksum_fuzzer.c', 'miniz/tests/small_fuzzer.c', 'flush_fuzzer', 'inspector/source-codeminiz/tests/small_fuzzer.c', 'inspector/source-codeminiz/tests/uncompress_fuzzer.c', 'uncompress_fuzzer', 'small_fuzzer', 'compress_fuzzer', 'inspector/source-codeminiz/tests/uncompress2_fuzzer.c', 'miniz/tests/large_fuzzer.c', 'miniz/tests/compress_fuzzer.c', 'miniz/tests/uncompress2_fuzzer.c', 'inspector/source-codeminiz/tests/flush_fuzzer.c', 'miniz/tests/flush_fuzzer.c'] |
| /src/miniz/tests/uncompress2_fuzzer.c | ['miniz/tests/uncompress2_fuzzer.c'] | ['miniz/tests/uncompress2_fuzzer.c'] |
| /src/inspector/source-code/src/miniz/tests/add_in_place_fuzzer.c | ['inspector/source-codeminiz/tests/add_in_place_fuzzer.c'] | ['inspector/source-codeminiz/tests/add_in_place_fuzzer.c'] |
| /src/miniz/tests/checksum_fuzzer.c | ['miniz/tests/checksum_fuzzer.c'] | ['miniz/tests/checksum_fuzzer.c'] |
| /src/inspector/source-code/src/miniz/tests/uncompress2_fuzzer.c | ['inspector/source-codeminiz/tests/uncompress2_fuzzer.c'] | ['inspector/source-codeminiz/tests/uncompress2_fuzzer.c'] |
| /src/inspector/light/source_files/src/miniz/tests/checksum_fuzzer.c | ['checksum_fuzzer'] | ['checksum_fuzzer'] |
| /src/inspector/light/source_files/src/miniz/tests/uncompress_fuzzer.c | ['uncompress_fuzzer'] | ['uncompress_fuzzer'] |
| /src/inspector/light/source_files/src/miniz/tests/compress_fuzzer.c | ['compress_fuzzer'] | ['compress_fuzzer'] |
| /src/inspector/source-code/src/miniz/tests/uncompress_fuzzer.c | ['inspector/source-codeminiz/tests/uncompress_fuzzer.c'] | ['inspector/source-codeminiz/tests/uncompress_fuzzer.c'] |
Directories in report
| Directory |
|---|
| /src/inspector/source-code/src/miniz/tests/ |
| /src/miniz/build/amalgamation/ |
| /src/miniz/tests/ |
| /src/inspector/light/source_files/src/miniz/tests/ |
Metadata section
This sections shows the raw data that is used to produce this report. This is mainly used for further processing and developer debugging.