Project overview: readstat
High level conclusions
Reachability and coverage overview
Project functions overview
The following table shows data about each function in the project. The functions included in this table correspond to all functions that exist in the executables of the fuzzers. As such, there may be functions that are from third-party libraries.
For further technical details on the meaning of columns in the below table, please see the Glossary .
| Func name | Functions filename | Args | Function call depth | Reached by Fuzzers | Fuzzers runtime hit | Func lines hit % | I Count | BB Count | Cyclomatic complexity | Functions reached | Reached by functions | Accumulated cyclomatic complexity | Undiscovered complexity |
|---|
Fuzzer details
Fuzzer: fuzz_grammar_spss_format
Call tree
The calltree shows the control flow of the fuzzer. This is overlaid with coverage information to display how much of the potential code a fuzzer can reach is in fact covered at runtime. In the following there is a link to a detailed calltree visualisation as well as a bitmap showing a high-level view of the calltree. For further information about these topics please see the glossary for full calltree and calltree overview
Call tree overview bitmap:

The distribution of callsites in terms of coloring is
| Color | Runtime hitcount | Callsite count | Percentage |
|---|---|---|---|
| red | 0 | 0 | 0.0% |
| gold | [1:9] | 0 | 0.0% |
| yellow | [10:29] | 0 | 0.0% |
| greenyellow | [30:49] | 0 | 0.0% |
| lawngreen | 50+ | 2 | 100.% |
| All colors | 2 | 100 |
Runtime coverage analysis
| Function name | source code lines | source lines hit | percentage hit |
|---|
Files reached
| filename | functions hit |
|---|---|
| fuzz/fuzz_grammar_spss_format.c | 1 |
| spss/readstat_spss_parse.rl | 1 |
Fuzzer: fuzz_format_sas_commands
Call tree
The calltree shows the control flow of the fuzzer. This is overlaid with coverage information to display how much of the potential code a fuzzer can reach is in fact covered at runtime. In the following there is a link to a detailed calltree visualisation as well as a bitmap showing a high-level view of the calltree. For further information about these topics please see the glossary for full calltree and calltree overview
Call tree overview bitmap:
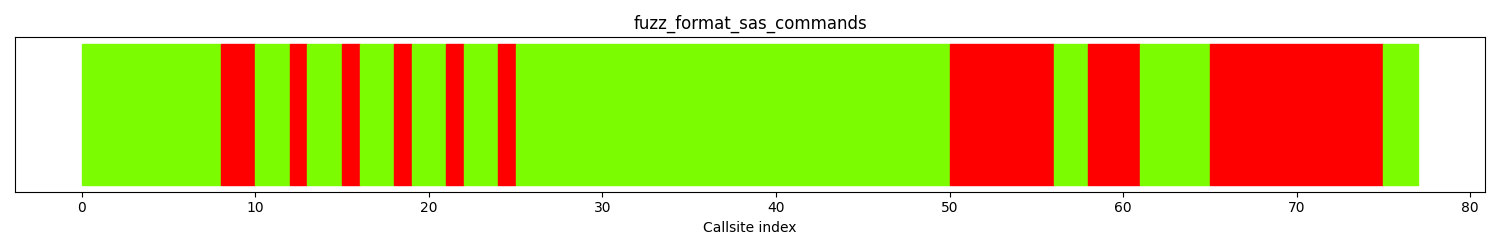
The distribution of callsites in terms of coloring is
| Color | Runtime hitcount | Callsite count | Percentage |
|---|---|---|---|
| red | 0 | 26 | 33.7% |
| gold | [1:9] | 0 | 0.0% |
| yellow | [10:29] | 0 | 0.0% |
| greenyellow | [30:49] | 0 | 0.0% |
| lawngreen | 50+ | 51 | 66.2% |
| All colors | 77 | 100 |
Fuzz blockers
The followings are the branches where fuzzer fails to bypass.
Runtime coverage analysis
| Function name | source code lines | source lines hit | percentage hit |
|---|
Files reached
| filename | functions hit |
|---|---|
| fuzz/fuzz_format_sas_commands.c | 1 |
| fuzz/fuzz_format.c | 7 |
| readstat_parser.c | 14 |
| readstat_io_unistd.c | 7 |
| test/test_buffer_io.c | 5 |
| txt/readstat_sas_commands_read.rl | 1 |
| txt/readstat_copy.c | 2 |
| txt/readstat_schema.c | 2 |
| txt/commands_util.c | 2 |
Fuzzer: fuzz_format_stata_dictionary
Call tree
The calltree shows the control flow of the fuzzer. This is overlaid with coverage information to display how much of the potential code a fuzzer can reach is in fact covered at runtime. In the following there is a link to a detailed calltree visualisation as well as a bitmap showing a high-level view of the calltree. For further information about these topics please see the glossary for full calltree and calltree overview
Call tree overview bitmap:
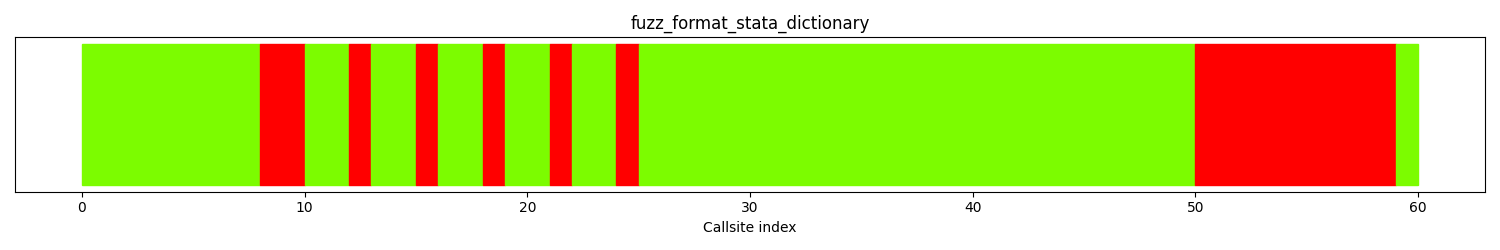
The distribution of callsites in terms of coloring is
| Color | Runtime hitcount | Callsite count | Percentage |
|---|---|---|---|
| red | 0 | 16 | 26.6% |
| gold | [1:9] | 0 | 0.0% |
| yellow | [10:29] | 0 | 0.0% |
| greenyellow | [30:49] | 0 | 0.0% |
| lawngreen | 50+ | 44 | 73.3% |
| All colors | 60 | 100 |
Fuzz blockers
The followings are the branches where fuzzer fails to bypass.
Runtime coverage analysis
| Function name | source code lines | source lines hit | percentage hit |
|---|
Files reached
| filename | functions hit |
|---|---|
| fuzz/fuzz_format_stata_dictionary.c | 1 |
| fuzz/fuzz_format.c | 7 |
| readstat_parser.c | 14 |
| readstat_io_unistd.c | 7 |
| test/test_buffer_io.c | 5 |
| txt/readstat_stata_dictionary_read.rl | 1 |
| txt/readstat_copy.c | 1 |
| txt/readstat_schema.c | 1 |
Fuzzer: fuzz_compression_sav
Call tree
The calltree shows the control flow of the fuzzer. This is overlaid with coverage information to display how much of the potential code a fuzzer can reach is in fact covered at runtime. In the following there is a link to a detailed calltree visualisation as well as a bitmap showing a high-level view of the calltree. For further information about these topics please see the glossary for full calltree and calltree overview
Call tree overview bitmap:
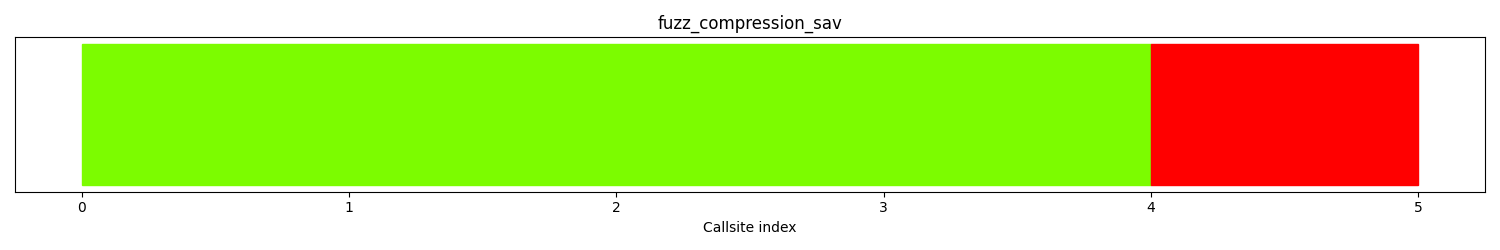
The distribution of callsites in terms of coloring is
| Color | Runtime hitcount | Callsite count | Percentage |
|---|---|---|---|
| red | 0 | 1 | 20.0% |
| gold | [1:9] | 0 | 0.0% |
| yellow | [10:29] | 0 | 0.0% |
| greenyellow | [30:49] | 0 | 0.0% |
| lawngreen | 50+ | 4 | 80.0% |
| All colors | 5 | 100 |
Fuzz blockers
The following nodes represent call sites where fuzz blockers occur.
| Amount of callsites blocked | Calltree index | Parent function | Callsite | Largest blocked function |
|---|---|---|---|---|
| 1 | 3 | sav_decompress_row | call site: 00003 | byteswap8 |
Runtime coverage analysis
| Function name | source code lines | source lines hit | percentage hit |
|---|
Files reached
| filename | functions hit |
|---|---|
| fuzz/fuzz_compression_sav.c | 1 |
| spss/readstat_sav_compress.c | 1 |
| readstat_bits.c | 2 |
Fuzzer: fuzz_format_spss_commands
Call tree
The calltree shows the control flow of the fuzzer. This is overlaid with coverage information to display how much of the potential code a fuzzer can reach is in fact covered at runtime. In the following there is a link to a detailed calltree visualisation as well as a bitmap showing a high-level view of the calltree. For further information about these topics please see the glossary for full calltree and calltree overview
Call tree overview bitmap:
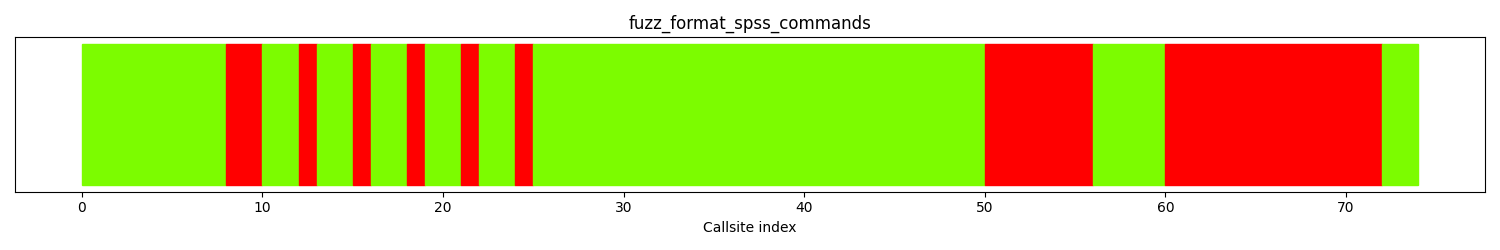
The distribution of callsites in terms of coloring is
| Color | Runtime hitcount | Callsite count | Percentage |
|---|---|---|---|
| red | 0 | 25 | 33.7% |
| gold | [1:9] | 0 | 0.0% |
| yellow | [10:29] | 0 | 0.0% |
| greenyellow | [30:49] | 0 | 0.0% |
| lawngreen | 50+ | 49 | 66.2% |
| All colors | 74 | 100 |
Fuzz blockers
The followings are the branches where fuzzer fails to bypass.
Runtime coverage analysis
| Function name | source code lines | source lines hit | percentage hit |
|---|
Files reached
| filename | functions hit |
|---|---|
| fuzz/fuzz_format_spss_commands.c | 1 |
| fuzz/fuzz_format.c | 7 |
| readstat_parser.c | 14 |
| readstat_io_unistd.c | 7 |
| test/test_buffer_io.c | 5 |
| txt/readstat_spss_commands_read.rl | 1 |
| txt/readstat_copy.c | 2 |
| txt/readstat_schema.c | 2 |
| txt/commands_util.c | 2 |
Fuzzer: fuzz_format_por
Call tree
The calltree shows the control flow of the fuzzer. This is overlaid with coverage information to display how much of the potential code a fuzzer can reach is in fact covered at runtime. In the following there is a link to a detailed calltree visualisation as well as a bitmap showing a high-level view of the calltree. For further information about these topics please see the glossary for full calltree and calltree overview
Call tree overview bitmap:
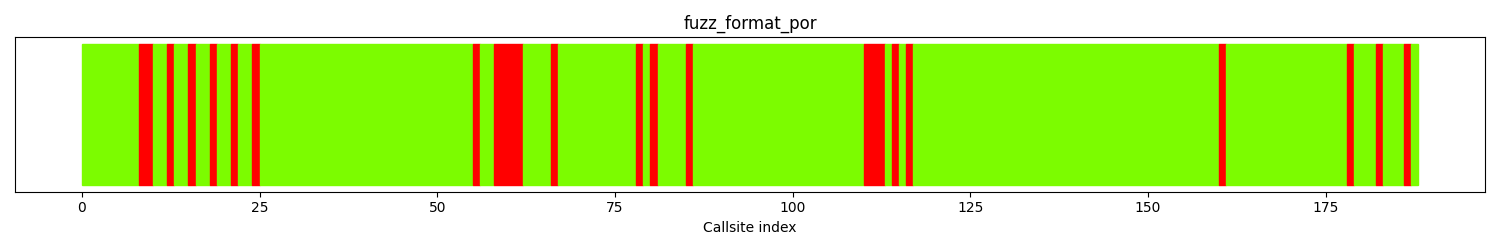
The distribution of callsites in terms of coloring is
| Color | Runtime hitcount | Callsite count | Percentage |
|---|---|---|---|
| red | 0 | 25 | 13.2% |
| gold | [1:9] | 0 | 0.0% |
| yellow | [10:29] | 0 | 0.0% |
| greenyellow | [30:49] | 0 | 0.0% |
| lawngreen | 50+ | 163 | 86.7% |
| All colors | 188 | 100 |
Fuzz blockers
The followings are the branches where fuzzer fails to bypass.
| Unique non-covered Complexity | Unique Reachable Complexities | Unique Reachable Functions | All non-covered Complexity | All Reachable Complexity | Function Name | Function Callsite | Blocked Branch |
|---|---|---|---|---|---|---|---|
| 46 | 46 |
1 :
['ck_hash_table_grow'] |
50 | 82 | ck_str_n_hash_insert | call site: 00109 | /src/readstat/src/CKHashTable.c:217 |
| 8 | 8 |
2 :
['iconv', '__errno_location'] |
8 | 8 | readstat_convert | call site: 00057 | /src/readstat/src/readstat_convert.c:15 |
| 2 | 2 |
1 :
['iconv_open'] |
4 | 1815 | readstat_parse_por | call site: 00054 | /src/readstat/src/spss/readstat_por_read.c:764 |
| 0 | 7 |
1 :
['readstat_parser_free'] |
0 | 7 | readstat_parser_init | call site: 00005 | /src/readstat/src/readstat_parser.c:9 |
| 0 | 0 | None | 6 | 1817 | readstat_parse_por | call site: 00050 | /src/readstat/src/spss/readstat_por_read.c:760 |
| 0 | 0 | None | 2 | 193 | read_por_file_data | call site: 00182 | /src/readstat/src/spss/readstat_por_read.c:647 |
| 0 | 0 | None | 2 | 49 | handle_variables | call site: 00174 | /src/readstat/src/spss/readstat_por_read.c:725 |
| 0 | 0 | None | 0 | 55 | spss_init_variable_for_info | call site: 00159 | /src/readstat/src/spss/readstat_spss.c:157 |
| 0 | 0 | None | 0 | 39 | spss_init_variable_for_info | call site: 00159 | /src/readstat/src/spss/readstat_spss.c:163 |
| 0 | 0 | None | 0 | 16 | readstat_parse_por | call site: 00055 | /src/readstat/src/spss/readstat_por_read.c:767 |
| 0 | 0 | None | 0 | 16 | readstat_parse_por | call site: 00055 | /src/readstat/src/spss/readstat_por_read.c:774 |
| 0 | 0 | None | 0 | 16 | readstat_parse_por | call site: 00055 | /src/readstat/src/spss/readstat_por_read.c:779 |
Runtime coverage analysis
| Function name | source code lines | source lines hit | percentage hit |
|---|
Files reached
| filename | functions hit |
|---|---|
| fuzz/fuzz_format_por.c | 1 |
| fuzz/fuzz_format.c | 7 |
| readstat_parser.c | 14 |
| readstat_io_unistd.c | 7 |
| test/test_buffer_io.c | 5 |
| spss/readstat_por_read.c | 24 |
| spss/readstat_por.c | 3 |
| CKHashTable.c | 11 |
| readstat_convert.c | 1 |
| spss/readstat_por_parse.rl | 1 |
| readstat_malloc.c | 1 |
| spss/readstat_spss.c | 6 |
Fuzzer: fuzz_format_xport
Call tree
The calltree shows the control flow of the fuzzer. This is overlaid with coverage information to display how much of the potential code a fuzzer can reach is in fact covered at runtime. In the following there is a link to a detailed calltree visualisation as well as a bitmap showing a high-level view of the calltree. For further information about these topics please see the glossary for full calltree and calltree overview
Call tree overview bitmap:
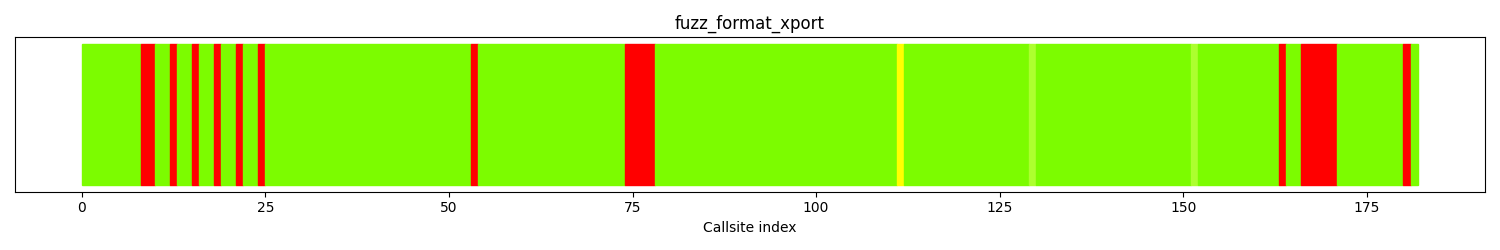
The distribution of callsites in terms of coloring is
| Color | Runtime hitcount | Callsite count | Percentage |
|---|---|---|---|
| red | 0 | 19 | 10.4% |
| gold | [1:9] | 0 | 0.0% |
| yellow | [10:29] | 1 | 0.54% |
| greenyellow | [30:49] | 2 | 1.09% |
| lawngreen | 50+ | 160 | 87.9% |
| All colors | 182 | 100 |
Fuzz blockers
The followings are the branches where fuzzer fails to bypass.
Runtime coverage analysis
| Function name | source code lines | source lines hit | percentage hit |
|---|
Files reached
| filename | functions hit |
|---|---|
| fuzz/fuzz_format_xport.c | 1 |
| fuzz/fuzz_format.c | 7 |
| readstat_parser.c | 14 |
| readstat_io_unistd.c | 7 |
| test/test_buffer_io.c | 5 |
| sas/readstat_xport_read.c | 22 |
| readstat_convert.c | 1 |
| readstat_malloc.c | 3 |
| sas/readstat_xport.c | 1 |
| readstat_bits.c | 3 |
| sas/readstat_sas.c | 1 |
| sas/ieee.c | 5 |
Fuzzer: fuzz_format_dta
Call tree
The calltree shows the control flow of the fuzzer. This is overlaid with coverage information to display how much of the potential code a fuzzer can reach is in fact covered at runtime. In the following there is a link to a detailed calltree visualisation as well as a bitmap showing a high-level view of the calltree. For further information about these topics please see the glossary for full calltree and calltree overview
Call tree overview bitmap:
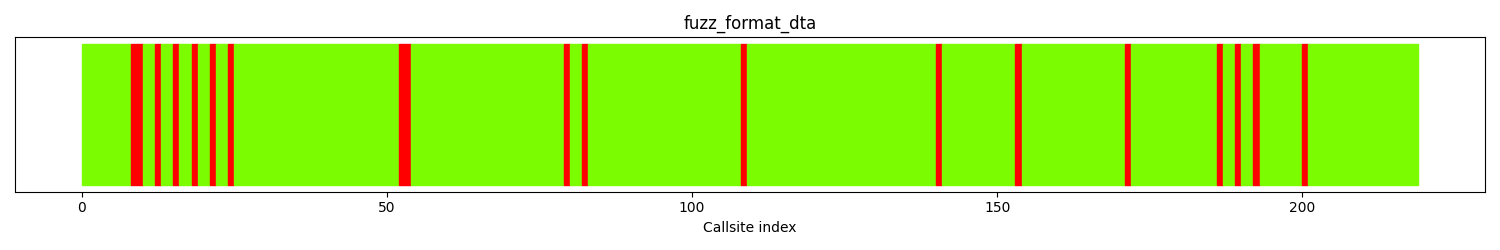
The distribution of callsites in terms of coloring is
| Color | Runtime hitcount | Callsite count | Percentage |
|---|---|---|---|
| red | 0 | 19 | 8.67% |
| gold | [1:9] | 0 | 0.0% |
| yellow | [10:29] | 0 | 0.0% |
| greenyellow | [30:49] | 0 | 0.0% |
| lawngreen | 50+ | 200 | 91.3% |
| All colors | 219 | 100 |
Fuzz blockers
The followings are the branches where fuzzer fails to bypass.
Runtime coverage analysis
| Function name | source code lines | source lines hit | percentage hit |
|---|
Files reached
| filename | functions hit |
|---|---|
| fuzz/fuzz_format_dta.c | 1 |
| fuzz/fuzz_format.c | 7 |
| readstat_parser.c | 14 |
| readstat_io_unistd.c | 7 |
| test/test_buffer_io.c | 5 |
| stata/readstat_dta_read.c | 27 |
| stata/readstat_dta.c | 4 |
| readstat_bits.c | 7 |
| readstat_malloc.c | 3 |
| readstat_convert.c | 1 |
| stata/readstat_dta_parse_timestamp.rl | 1 |
Fuzzer: fuzz_format_sas7bcat
Call tree
The calltree shows the control flow of the fuzzer. This is overlaid with coverage information to display how much of the potential code a fuzzer can reach is in fact covered at runtime. In the following there is a link to a detailed calltree visualisation as well as a bitmap showing a high-level view of the calltree. For further information about these topics please see the glossary for full calltree and calltree overview
Call tree overview bitmap:
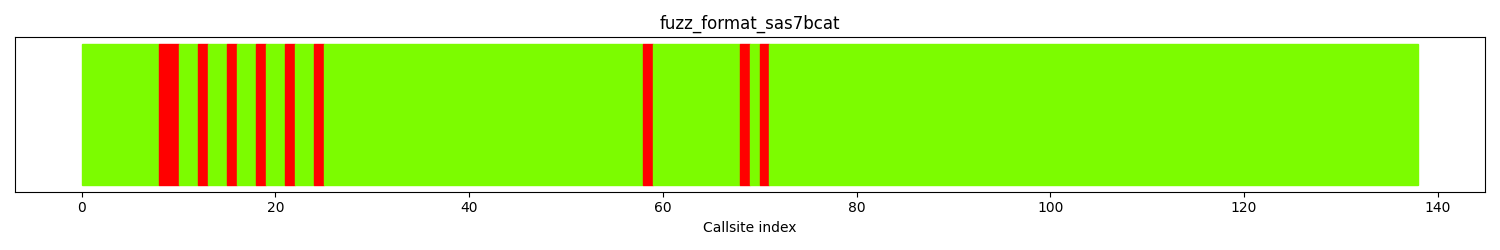
The distribution of callsites in terms of coloring is
| Color | Runtime hitcount | Callsite count | Percentage |
|---|---|---|---|
| red | 0 | 10 | 7.24% |
| gold | [1:9] | 0 | 0.0% |
| yellow | [10:29] | 0 | 0.0% |
| greenyellow | [30:49] | 0 | 0.0% |
| lawngreen | 50+ | 128 | 92.7% |
| All colors | 138 | 100 |
Fuzz blockers
The followings are the branches where fuzzer fails to bypass.
Runtime coverage analysis
| Function name | source code lines | source lines hit | percentage hit |
|---|
Files reached
| filename | functions hit |
|---|---|
| fuzz/fuzz_format_sas7bcat.c | 1 |
| fuzz/fuzz_format.c | 7 |
| readstat_parser.c | 14 |
| readstat_io_unistd.c | 7 |
| test/test_buffer_io.c | 5 |
| sas/readstat_sas7bcat_read.c | 10 |
| sas/readstat_sas.c | 8 |
| readstat_bits.c | 5 |
| readstat_convert.c | 1 |
| readstat_malloc.c | 3 |
Fuzzer: fuzz_format_sas7bdat
Call tree
The calltree shows the control flow of the fuzzer. This is overlaid with coverage information to display how much of the potential code a fuzzer can reach is in fact covered at runtime. In the following there is a link to a detailed calltree visualisation as well as a bitmap showing a high-level view of the calltree. For further information about these topics please see the glossary for full calltree and calltree overview
Call tree overview bitmap:
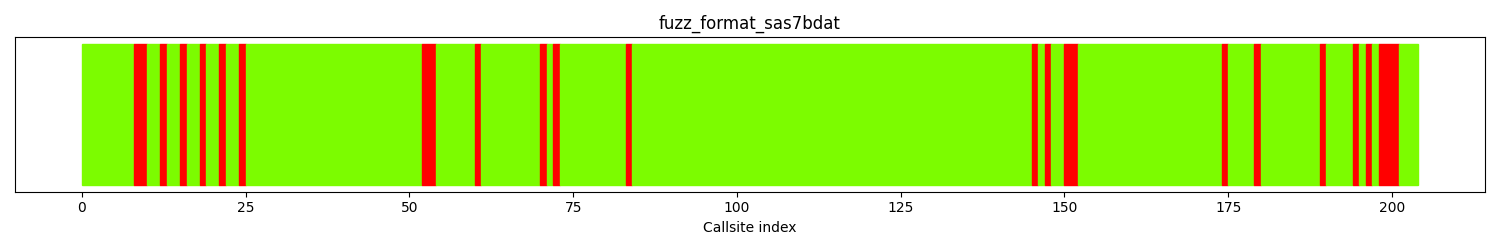
The distribution of callsites in terms of coloring is
| Color | Runtime hitcount | Callsite count | Percentage |
|---|---|---|---|
| red | 0 | 25 | 12.2% |
| gold | [1:9] | 0 | 0.0% |
| yellow | [10:29] | 0 | 0.0% |
| greenyellow | [30:49] | 0 | 0.0% |
| lawngreen | 50+ | 179 | 87.7% |
| All colors | 204 | 100 |
Fuzz blockers
The followings are the branches where fuzzer fails to bypass.
Runtime coverage analysis
| Function name | source code lines | source lines hit | percentage hit |
|---|
Files reached
| filename | functions hit |
|---|---|
| fuzz/fuzz_format_sas7bdat.c | 1 |
| fuzz/fuzz_format.c | 7 |
| readstat_parser.c | 14 |
| readstat_io_unistd.c | 7 |
| test/test_buffer_io.c | 5 |
| sas/readstat_sas7bdat_read.c | 31 |
| sas/readstat_sas.c | 9 |
| readstat_bits.c | 5 |
| readstat_malloc.c | 3 |
| readstat_convert.c | 1 |
| sas/readstat_sas_rle.c | 1 |
| readstat_error.c | 1 |
Fuzzer: fuzz_format_sav
Call tree
The calltree shows the control flow of the fuzzer. This is overlaid with coverage information to display how much of the potential code a fuzzer can reach is in fact covered at runtime. In the following there is a link to a detailed calltree visualisation as well as a bitmap showing a high-level view of the calltree. For further information about these topics please see the glossary for full calltree and calltree overview
Call tree overview bitmap:
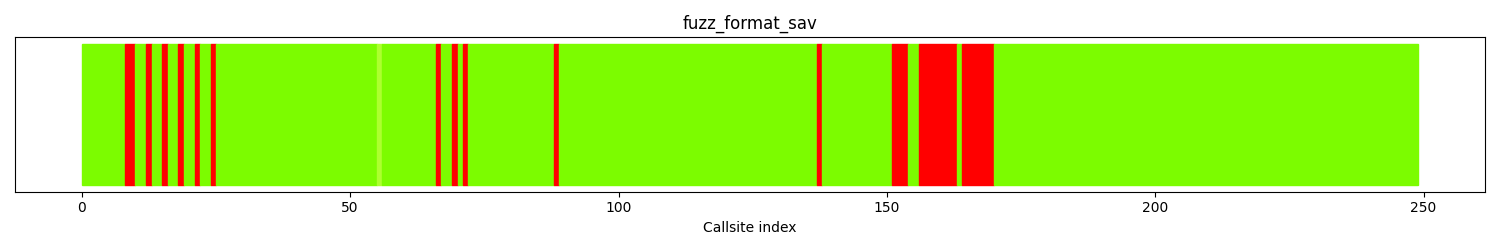
The distribution of callsites in terms of coloring is
| Color | Runtime hitcount | Callsite count | Percentage |
|---|---|---|---|
| red | 0 | 28 | 11.2% |
| gold | [1:9] | 0 | 0.0% |
| yellow | [10:29] | 0 | 0.0% |
| greenyellow | [30:49] | 1 | 0.40% |
| lawngreen | 50+ | 220 | 88.3% |
| All colors | 249 | 100 |
Fuzz blockers
The followings are the branches where fuzzer fails to bypass.
Runtime coverage analysis
| Function name | source code lines | source lines hit | percentage hit |
|---|
Files reached
| filename | functions hit |
|---|---|
| fuzz/fuzz_format_sav.c | 1 |
| fuzz/fuzz_format.c | 7 |
| readstat_parser.c | 14 |
| readstat_io_unistd.c | 7 |
| test/test_buffer_io.c | 5 |
| spss/readstat_sav_read.c | 32 |
| spss/readstat_sav.c | 2 |
| readstat_malloc.c | 3 |
| spss/readstat_spss.c | 10 |
| readstat_bits.c | 4 |
| spss/readstat_sav_parse_timestamp.rl | 2 |
| readstat_convert.c | 1 |
| spss/readstat_sav_parse.rl | 6 |
| spss/readstat_sav_compress.c | 1 |
| spss/readstat_zsav_read.c | 1 |
Analyses and suggestions
Optimal target analysis
Remaining optimal interesting functions
The following table shows a list of functions that are optimal targets. Optimal targets are identified by finding the functions that in combination, yield a high code coverage.
| Func name | Functions filename | Arg count | Args | Function depth | hitcount | instr count | bb count | cyclomatic complexity | Reachable functions | Incoming references | total cyclomatic complexity | Unreached complexity |
|---|---|---|---|---|---|---|---|---|---|---|---|---|
readstat_value_is_missing
|
/src/readstat/src/readstat_value.c | 3 | ['size_t ', 'size_t ', 'struct.readstat_variable_s *'] | 3 | 0 | 68 | 11 | 5 | 15 | 0 | 59 | 57 |
sas_rle_compressed_len
|
/src/readstat/src/sas/readstat_sas_rle.c | 2 | ['char *', 'size_t '] | 2 | 0 | 20 | 3 | 2 | 7 | 0 | 44 | 44 |
Implementing fuzzers that target the above functions will improve reachability such that it becomes:
All functions overview
If you implement fuzzers for these functions, the status of all functions in the project will be:
| Func name | Functions filename | Args | Function call depth | Reached by Fuzzers | Fuzzers runtime hit | Func lines hit % | I Count | BB Count | Cyclomatic complexity | Functions reached | Reached by functions | Accumulated cyclomatic complexity | Undiscovered complexity |
|---|
Runtime coverage analysis
This section shows analysis of runtime coverage data.
For futher technical details on how this section is generated, please see the Glossary .
Complex functions with low coverage
| Func name | Function total lines | Lines covered at runtime | percentage covered | Reached by fuzzers |
|---|---|---|---|---|
| readstat_parse_stata_dictionary | 381 | 118 | 30.97% | ['fuzz_format_stata_dictionary'] |
Files and Directories in report
This section shows which files and directories are considered in this report. The main reason for showing this is fuzz introspector may include more code in the reasoning than is desired. This section helps identify if too many files/directories are included, e.g. third party code, which may be irrelevant for the threat model. In the event too much is included, fuzz introspector supports a configuration file that can exclude data from the report. See the following link for more information on how to create a config file: link
Files in report
| Source file | Reached by | Covered by |
|---|---|---|
| /src/readstat/src/spss/readstat_spss_parse.rl | ['fuzz_grammar_spss_format'] | ['fuzz_grammar_spss_format'] |
| /src/readstat/src/test/test_buffer_io.c | ['fuzz_format_sas_commands', 'fuzz_format_stata_dictionary', 'fuzz_format_spss_commands', 'fuzz_format_por', 'fuzz_format_xport', 'fuzz_format_dta', 'fuzz_format_sas7bcat', 'fuzz_format_sas7bdat', 'fuzz_format_sav'] | ['fuzz_format_sas_commands', 'fuzz_format_stata_dictionary', 'fuzz_format_spss_commands', 'fuzz_format_por', 'fuzz_format_xport', 'fuzz_format_dta', 'fuzz_format_sas7bcat', 'fuzz_format_sas7bdat', 'fuzz_format_sav'] |
| /src/readstat/src/fuzz/fuzz_format.c | ['fuzz_format_sas_commands', 'fuzz_format_stata_dictionary', 'fuzz_format_spss_commands', 'fuzz_format_por', 'fuzz_format_xport', 'fuzz_format_dta', 'fuzz_format_sas7bcat', 'fuzz_format_sas7bdat', 'fuzz_format_sav'] | ['fuzz_format_sas_commands', 'fuzz_format_stata_dictionary', 'fuzz_format_spss_commands', 'fuzz_format_por', 'fuzz_format_xport', 'fuzz_format_dta', 'fuzz_format_sas7bcat', 'fuzz_format_sas7bdat', 'fuzz_format_sav'] |
| [] | [] | |
| /src/readstat/src/spss/readstat_por.c | ['fuzz_format_por'] | ['fuzz_format_por'] |
| /src/readstat/src/stata/readstat_dta_parse_timestamp.rl | ['fuzz_format_dta'] | ['fuzz_format_dta'] |
| /src/readstat/src/spss/readstat_zsav_read.c | ['fuzz_format_sav'] | ['fuzz_format_sav'] |
| /src/readstat/src/spss/readstat_sav.c | ['fuzz_format_sav'] | ['fuzz_format_sav'] |
| /src/readstat/src/txt/readstat_sas_commands_read.rl | ['fuzz_format_sas_commands'] | ['fuzz_format_sas_commands'] |
| /src/readstat/src/readstat_writer.c | [] | [] |
| /src/readstat/src/sas/readstat_sas7bcat_read.c | ['fuzz_format_sas7bcat'] | ['fuzz_format_sas7bcat'] |
| /src/readstat/src/txt/readstat_spss_commands_read.rl | ['fuzz_format_spss_commands'] | ['fuzz_format_spss_commands'] |
| /src/readstat/src/spss/readstat_sav_read.c | ['fuzz_format_sav'] | ['fuzz_format_sav'] |
| /src/readstat/src/txt/readstat_copy.c | ['fuzz_format_sas_commands', 'fuzz_format_stata_dictionary', 'fuzz_format_spss_commands'] | ['fuzz_format_sas_commands', 'fuzz_format_spss_commands'] |
| /src/readstat/src/fuzz/fuzz_format_xport.c | ['fuzz_format_xport'] | ['fuzz_format_xport'] |
| /src/readstat/src/spss/readstat_sav_parse.rl | ['fuzz_format_sav'] | ['fuzz_format_sav'] |
| /src/readstat/src/txt/readstat_stata_dictionary_read.rl | ['fuzz_format_stata_dictionary'] | ['fuzz_format_stata_dictionary'] |
| /src/readstat/src/readstat_value.c | [] | [] |
| /src/readstat/src/sas/readstat_sas_rle.c | ['fuzz_format_sas7bdat'] | ['fuzz_format_sas7bdat'] |
| /src/readstat/src/stata/readstat_dta_read.c | ['fuzz_format_dta'] | ['fuzz_format_dta'] |
| /src/readstat/src/readstat_error.c | ['fuzz_format_sas7bdat'] | [] |
| /src/readstat/src/fuzz/fuzz_format_sas_commands.c | ['fuzz_format_sas_commands'] | ['fuzz_format_sas_commands'] |
| /src/readstat/src/stata/readstat_dta.c | ['fuzz_format_dta'] | ['fuzz_format_dta'] |
| /src/readstat/src/spss/readstat_por_parse.rl | ['fuzz_format_por'] | ['fuzz_format_por'] |
| /src/readstat/src/sas/readstat_xport_read.c | ['fuzz_format_xport'] | ['fuzz_format_xport'] |
| /src/readstat/src/sas/ieee.c | ['fuzz_format_xport'] | ['fuzz_format_xport'] |
| /src/readstat/src/readstat_bits.c | ['fuzz_compression_sav', 'fuzz_format_xport', 'fuzz_format_dta', 'fuzz_format_sas7bcat', 'fuzz_format_sas7bdat', 'fuzz_format_sav'] | ['fuzz_format_xport', 'fuzz_format_dta', 'fuzz_format_sas7bcat', 'fuzz_format_sas7bdat', 'fuzz_format_sav'] |
| /src/readstat/src/fuzz/fuzz_compression_sav.c | ['fuzz_compression_sav'] | ['fuzz_compression_sav'] |
| /src/readstat/src/readstat_io_unistd.c | ['fuzz_format_sas_commands', 'fuzz_format_stata_dictionary', 'fuzz_format_spss_commands', 'fuzz_format_por', 'fuzz_format_xport', 'fuzz_format_dta', 'fuzz_format_sas7bcat', 'fuzz_format_sas7bdat', 'fuzz_format_sav'] | ['fuzz_format_sas_commands', 'fuzz_format_stata_dictionary', 'fuzz_format_spss_commands', 'fuzz_format_por', 'fuzz_format_xport', 'fuzz_format_dta', 'fuzz_format_sas7bcat', 'fuzz_format_sas7bdat', 'fuzz_format_sav'] |
| /src/readstat/src/CKHashTable.c | ['fuzz_format_por'] | ['fuzz_format_por'] |
| /src/readstat/src/fuzz/fuzz_format_sav.c | ['fuzz_format_sav'] | ['fuzz_format_sav'] |
| /src/readstat/src/fuzz/fuzz_format_por.c | ['fuzz_format_por'] | ['fuzz_format_por'] |
| /src/readstat/src/txt/readstat_schema.c | ['fuzz_format_sas_commands', 'fuzz_format_stata_dictionary', 'fuzz_format_spss_commands'] | ['fuzz_format_sas_commands', 'fuzz_format_stata_dictionary', 'fuzz_format_spss_commands'] |
| /src/readstat/src/sas/readstat_sas7bdat_read.c | ['fuzz_format_sas7bdat'] | ['fuzz_format_sas7bdat'] |
| /src/readstat/src/fuzz/fuzz_format_dta.c | ['fuzz_format_dta'] | ['fuzz_format_dta'] |
| /src/readstat/src/sas/readstat_sas.c | ['fuzz_format_xport', 'fuzz_format_sas7bcat', 'fuzz_format_sas7bdat'] | ['fuzz_format_xport', 'fuzz_format_sas7bcat', 'fuzz_format_sas7bdat'] |
| /src/readstat/src/spss/readstat_por_read.c | ['fuzz_format_por'] | ['fuzz_format_por'] |
| /src/readstat/src/readstat_malloc.c | ['fuzz_format_por', 'fuzz_format_xport', 'fuzz_format_dta', 'fuzz_format_sas7bcat', 'fuzz_format_sas7bdat', 'fuzz_format_sav'] | ['fuzz_format_por', 'fuzz_format_xport', 'fuzz_format_dta', 'fuzz_format_sas7bcat', 'fuzz_format_sas7bdat', 'fuzz_format_sav'] |
| /src/readstat/src/fuzz/fuzz_format_sas7bcat.c | ['fuzz_format_sas7bcat'] | ['fuzz_format_sas7bcat'] |
| /src/readstat/src/spss/readstat_sav_parse_timestamp.rl | ['fuzz_format_sav'] | ['fuzz_format_sav'] |
| /src/readstat/src/fuzz/fuzz_format_sas7bdat.c | ['fuzz_format_sas7bdat'] | ['fuzz_format_sas7bdat'] |
| /src/readstat/src/spss/readstat_spss.c | ['fuzz_format_por', 'fuzz_format_sav'] | ['fuzz_format_por', 'fuzz_format_sav'] |
| /src/readstat/src/readstat_convert.c | ['fuzz_format_por', 'fuzz_format_xport', 'fuzz_format_dta', 'fuzz_format_sas7bcat', 'fuzz_format_sas7bdat', 'fuzz_format_sav'] | ['fuzz_format_por', 'fuzz_format_xport', 'fuzz_format_dta', 'fuzz_format_sas7bcat', 'fuzz_format_sas7bdat', 'fuzz_format_sav'] |
| /src/readstat/src/fuzz/fuzz_format_stata_dictionary.c | ['fuzz_format_stata_dictionary'] | ['fuzz_format_stata_dictionary'] |
| /src/readstat/src/spss/readstat_sav_compress.c | ['fuzz_compression_sav', 'fuzz_format_sav'] | ['fuzz_compression_sav', 'fuzz_format_sav'] |
| /src/readstat/src/txt/commands_util.c | ['fuzz_format_sas_commands', 'fuzz_format_spss_commands'] | ['fuzz_format_sas_commands', 'fuzz_format_spss_commands'] |
| /src/readstat/src/sas/readstat_xport.c | ['fuzz_format_xport'] | ['fuzz_format_xport'] |
| /src/readstat/src/fuzz/fuzz_format_spss_commands.c | ['fuzz_format_spss_commands'] | ['fuzz_format_spss_commands'] |
| /src/readstat/src/readstat_parser.c | ['fuzz_format_sas_commands', 'fuzz_format_stata_dictionary', 'fuzz_format_spss_commands', 'fuzz_format_por', 'fuzz_format_xport', 'fuzz_format_dta', 'fuzz_format_sas7bcat', 'fuzz_format_sas7bdat', 'fuzz_format_sav'] | ['fuzz_format_sas_commands', 'fuzz_format_stata_dictionary', 'fuzz_format_spss_commands', 'fuzz_format_por', 'fuzz_format_xport', 'fuzz_format_dta', 'fuzz_format_sas7bcat', 'fuzz_format_sas7bdat', 'fuzz_format_sav'] |
| /src/readstat/src/fuzz/fuzz_grammar_spss_format.c | ['fuzz_grammar_spss_format'] | ['fuzz_grammar_spss_format'] |
| /src/readstat/src/readstat_variable.c | [] | [] |
Directories in report
| Directory |
|---|
| /src/readstat/src/spss/ |
| /src/readstat/src/test/ |
| /src/readstat/src/stata/ |
| /src/readstat/src/fuzz/ |
| /src/readstat/src/ |
| /src/readstat/src/sas/ |
| /src/readstat/src/txt/ |
Metadata section
This sections shows the raw data that is used to produce this report. This is mainly used for further processing and developer debugging.
Function call coverage
This section shows a chosen list of functions / methods calls and their relative coverage information. By static analysis of the target project code, all of these function call and their caller information, including the source file or class and line number that initiate the call are captured. Column 1 is the function name of that selected functions or methods. Column 2 of each row indicate if the target function covered by any fuzzer calltree information. Column 3 lists all fuzzers (or no fuzzers at all) that have coered that particular function call dynamically. Column 4 shows list of parent function for the specific function call, while column 5 shows possible blocker functions that make the fuzzers fail to reach the specific functions. Both column 4 and 5 will only show information if none of the fuzzers cover the target function calls.
Function in each files in report
| Target sink | Callsite location | Reached by fuzzer | Function call path | Covered by fuzzer | Possible branch blockers |
|---|