Melakukan Join Tabel
Peringatan
This tutorial is now obsolete. A new and updated version is available at Performing Table Joins (QGIS3)
Tidak setiap dataset yang anda ingin gunakan sudah berupa shapefile atau sudah dalam format spasial. Seringkali data berupa tabel atau sebuah spreadsheet dan anda ingin menghubungkannya dengan data spasial yang sudah ada untuk anda gunakan dalam analisis. Operasi ini dikenal dengan Table Join dan tutorial ini akan menlingkupi bagaimana memperoleh join tabel di QGIS
Tinjauan Tugas
Kita akan menggunakan sebuah shapefile dari daerah Sensus untuk California dan tabel data populasi dari Biro Sensus Amerika Serikat untuk menghasiljan sebuah peta populasi untuk California.
Skill lain yang akan anda pelajari
Buat file .csvt untuk mengindikasikan tipe data kolom di sebuah file CSV.
Membuka file CSV yang tidak mempunyai geometri di QGIS.
Mendapatkan data
US Census Bureau has various spatial extracts from the MAF/TIGER database. You can query and download census tracts shapefile for California. Download Census Tracts for California file.
Americal FactFinder adalah sebuah repositori dari semua data sensus AS. Anda dapat menggunakan Advanced Search dan query untuk Topic - Total Population and Geographies - All Census Tracts in California dan Geographies - All Census Tracts in California untuk menghasilkan sebuah CSV kustom dan mengunduhnya. Tutorial ini menggunakan data Total Population 2010 Census Summary File 1.
For convenience, you may directly download a copy of both the datasets from the links below:
Sumber Data [TIGER] [USCENSUS]
Prosedur
Pertama-tama kita akan membuka shapefile census tract. Akses .
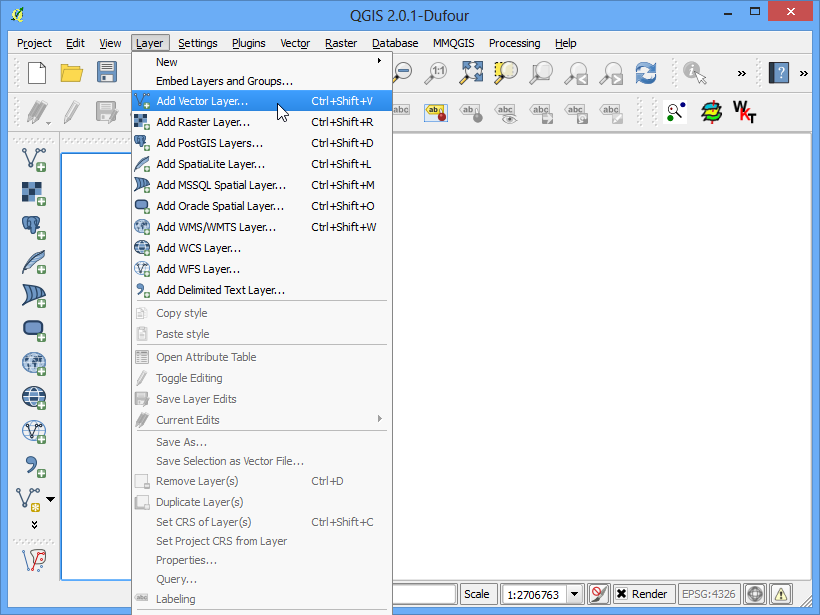
Browse to the downloaded zip file
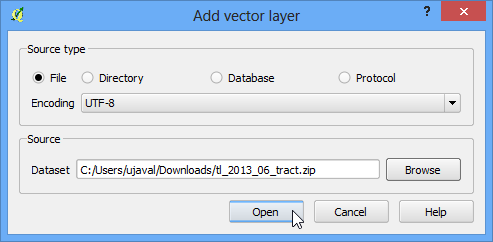
tl_2013_06_tract.zipand select it. QGIS can open zip files directly so no need to uncompress it first.
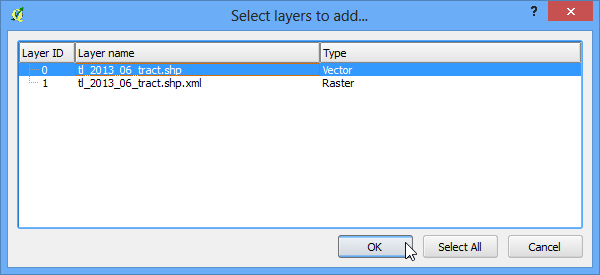
Select the
tl_2013_06_tract.shplayer and click OK.
Anda akan melihat daerah sensus terbuka di QGIS.
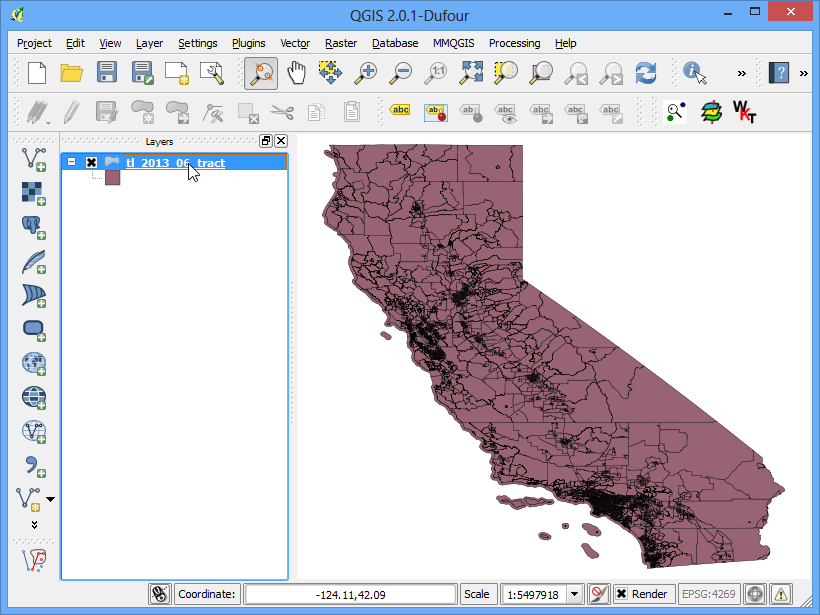
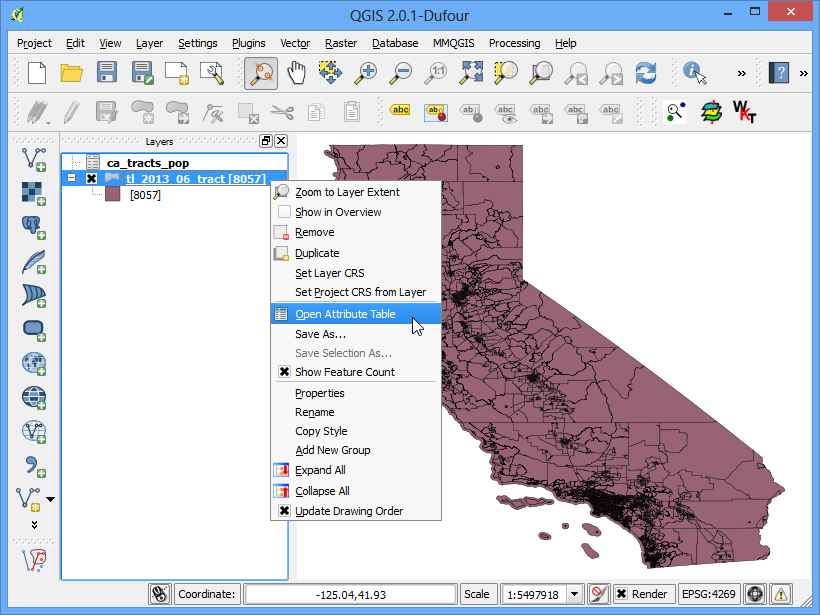
klik kanan pada layer dan pilih Open Attribute Table.
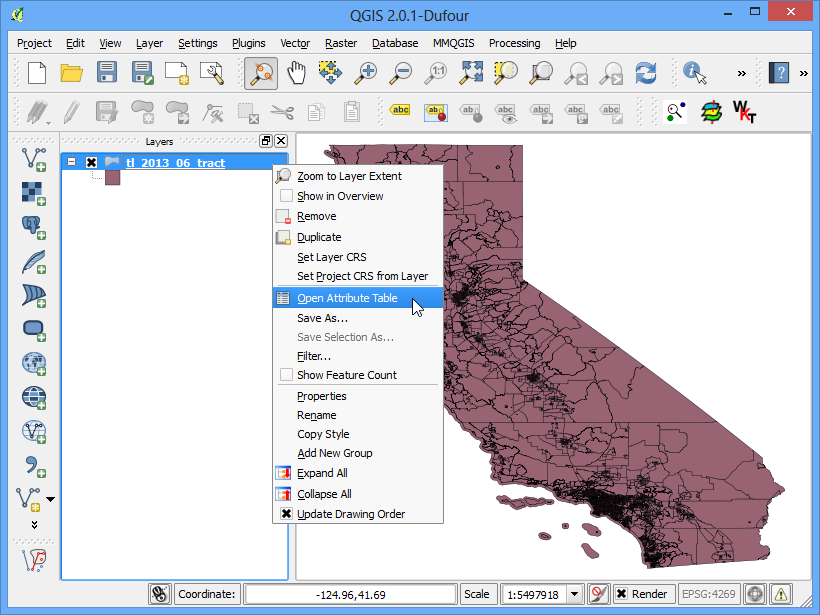
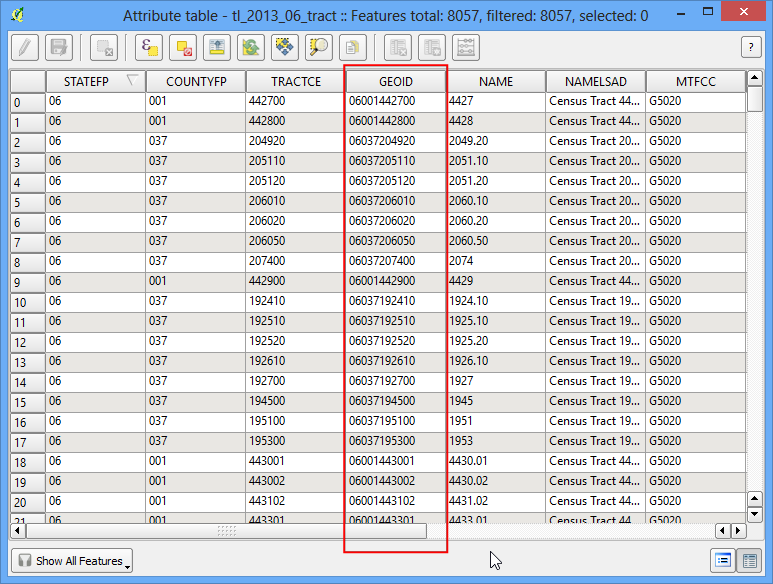
Periksa attribut dari shapefile tracts. Untuk menggabungkan sebuah tabel dan shapefile ini, kita membutuhkan sebuah attribut unik dan sama untuk setiap fitur, field GEOID merupakan pengidentifikasi unik untuk setiap tract dan dapat digunakan untuk link shapefile ini dengan tabel lain yang memiliki ID yang sama.
Open the CSV file
ca_tracts_pop.csvin a text editor. You will notice that each row of the file contains information about a tract along with the unique identifier we saw in the previous step. Note that this field is called GEO.id2 in the CSV. You will also note that the D001 column has population value for each of the census tract.

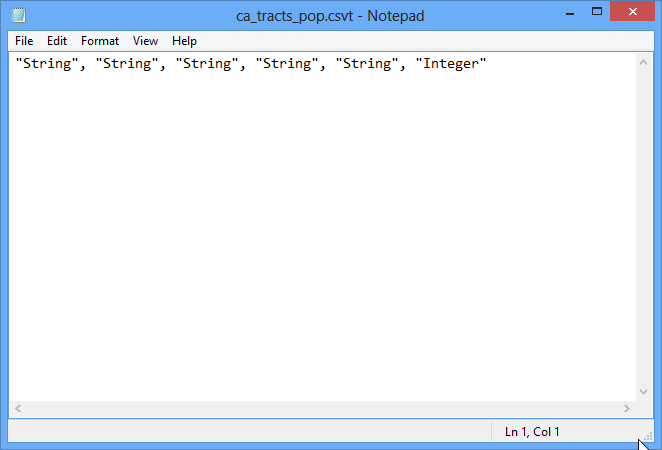
We could import this csv file without any further action and it would be imported. But, the default type of each column would be a String (text). That is ok except for the D001 field which contains numbers for the population. Having those imported as text would not allow us to run any mathematical operations on this column. To tell QGIS to import the field as a number, we need to create a sidecar file with a .csvt extension. This file will have only 1 row specifying data types for each column. Save this file as
ca_tracts_pop.csvtin the same directory as the original .csv file. You can also download the csvt file from here.
Sekarang kita siap mengimpor file CSV ke QGIS. AKses .
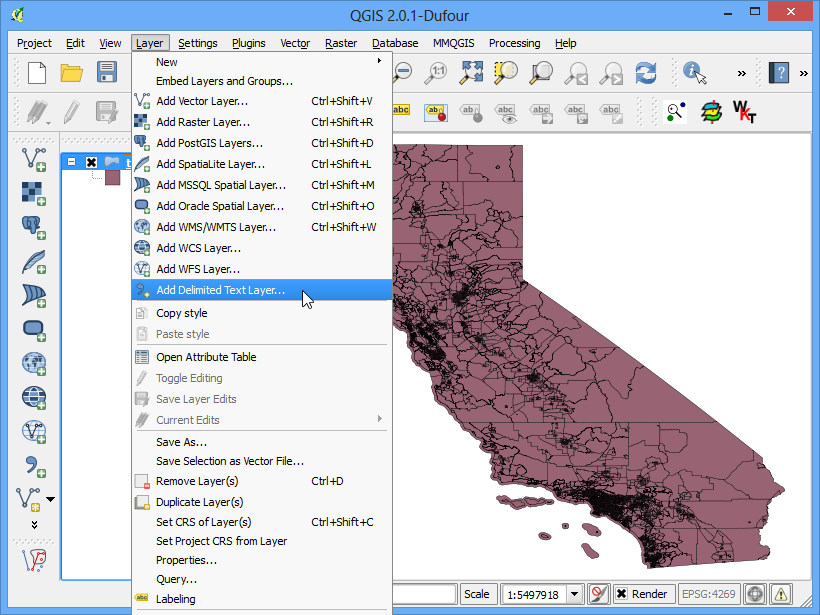
Jelajahi folder yang berisi file CSV dan pilih. Pastikan anda telah memilih File format dengan CSV (comma separated values) . Karena kita sedang mengimpor ini sebagai tabel, kita harus merinci bahwa file kita tidak berisi geometri. Pilih opsi No geometry (attribute only table) . Klik OK.

File CSV sekarang terimpor sebagai tabel ke QGIS.
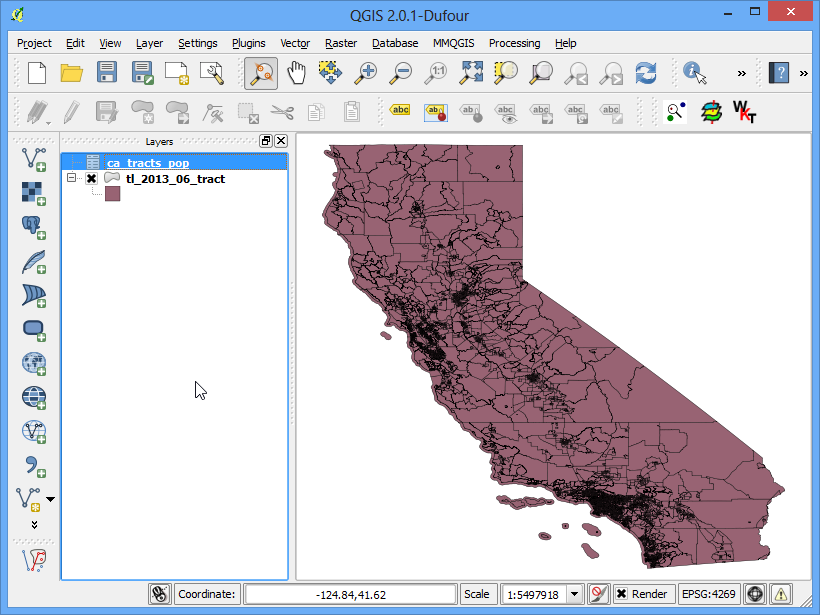
Select the
tl_2013_06_tractlayer. Right-click on it and select Properties.
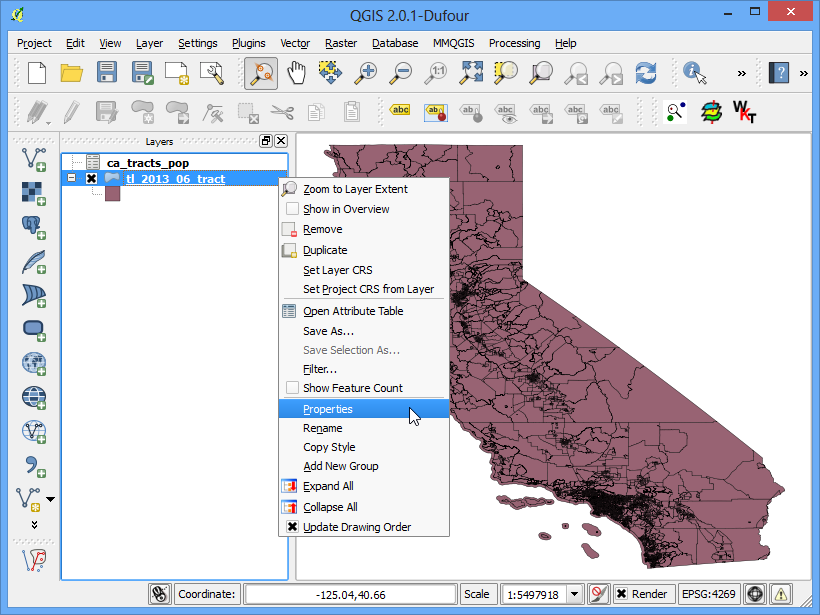
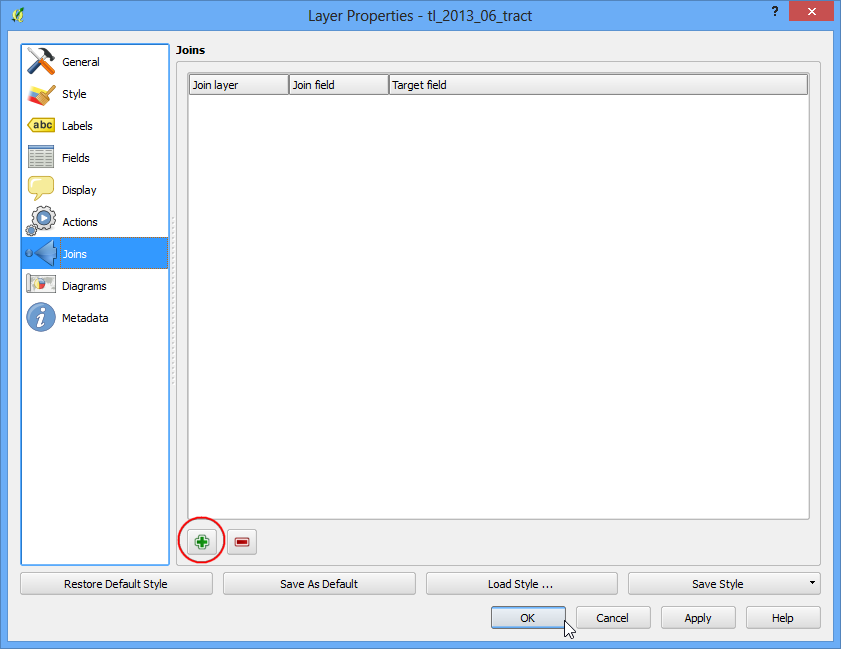
Pada dialog Layer Properties , pillih tab Joins . Klik tombol + pada bagian bawah untuk membuat sebuah join tabel yang baru.
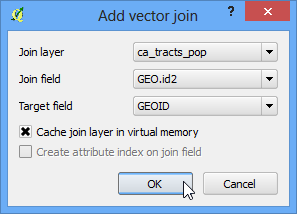
In the Add vector join dialog, select
ca_tracts_popas the Join layer. Next we have to select the field with unique ids in both the shapefile and the CSV. Select GEO.id2 and GEOID as the Join field and Target field respectively. Click OK.
Close the Layer Properties dialog and return to the main QGIS window. At this point, the fields from the CSV file are joined with the shapefile. Right-click on the
tl_2013_06_tractlayer and select Open Attribute Table.
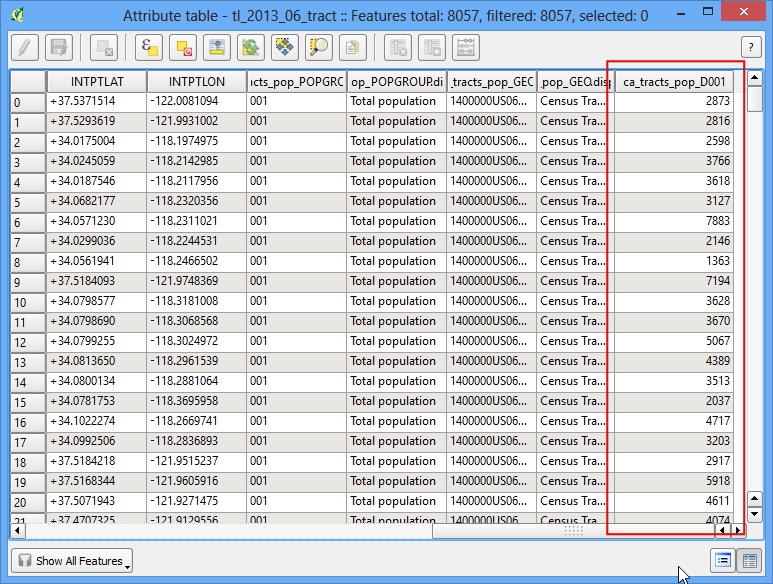
Sekarang anda dapat melihat sebuat set field yang baru, termasuk field ca_tracts_pop_D001 yang ditambahkan pada tiap fitur. Sekarang anda memiliki akses untuk angka populasi untuk setiap tract dari file CSV. Tutup tabel attrtibut dan kembali ke jendela utama QGIS.
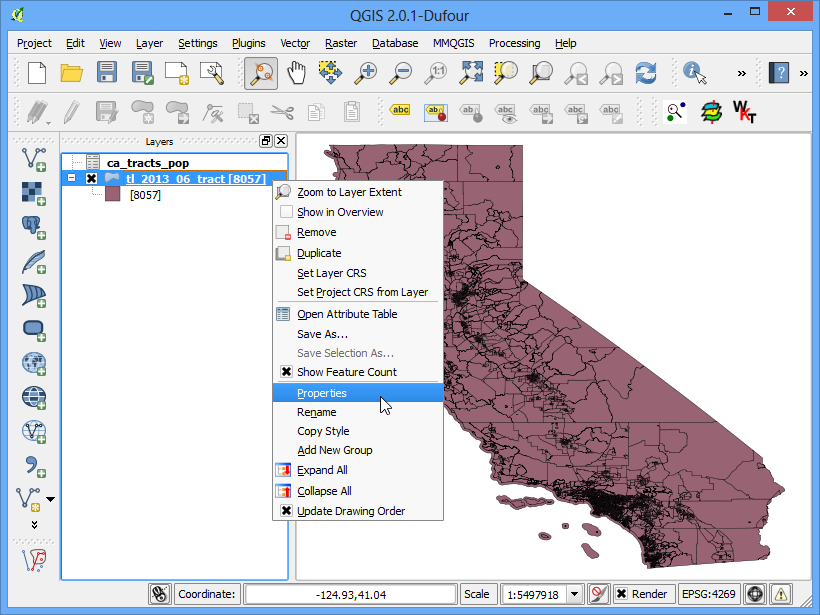
Right-click the
tl_2013_06_tractlayer and select Properties.
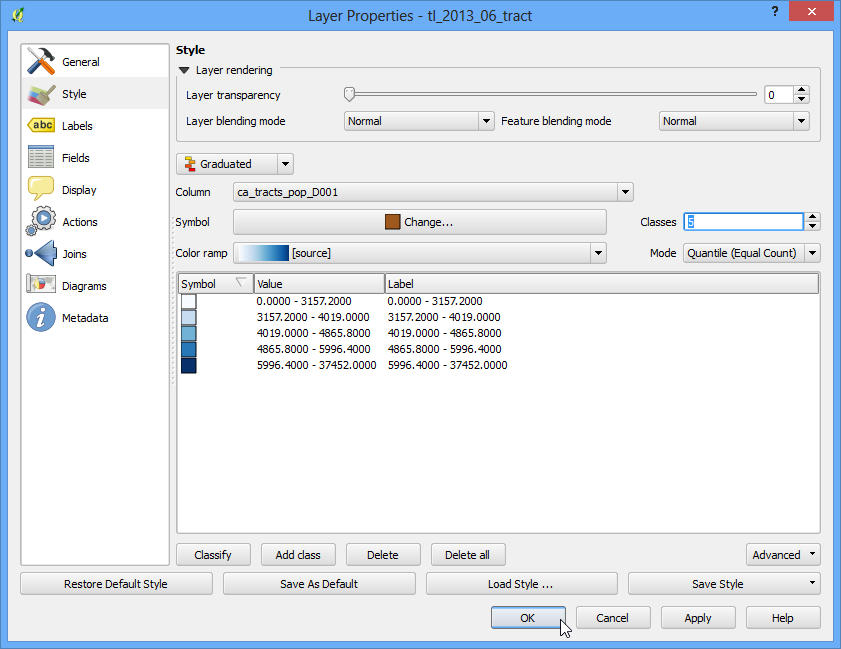
Pilih tab Style . Pilih Graduated dari menu drop-down. Karena kita mencoba untuk membuat sebuah peta populasi, kita ingin mentapkan warna yang berbeda pada tiap daerah sensus. berdarkan perhitungan populasi. Pilih ca_tracts_pop_D001 sebagai Column . Pilih sebuah daftar warna yang anda suka dari drop-down Color ramp . Pada Mode , pilih Quantile (Equal Count) . Berikutnya klik Classify . Anda akan melihat sebuah warna yang berbeda sudah ditetapkan dengan interval populasi tertentu. Klik OK.
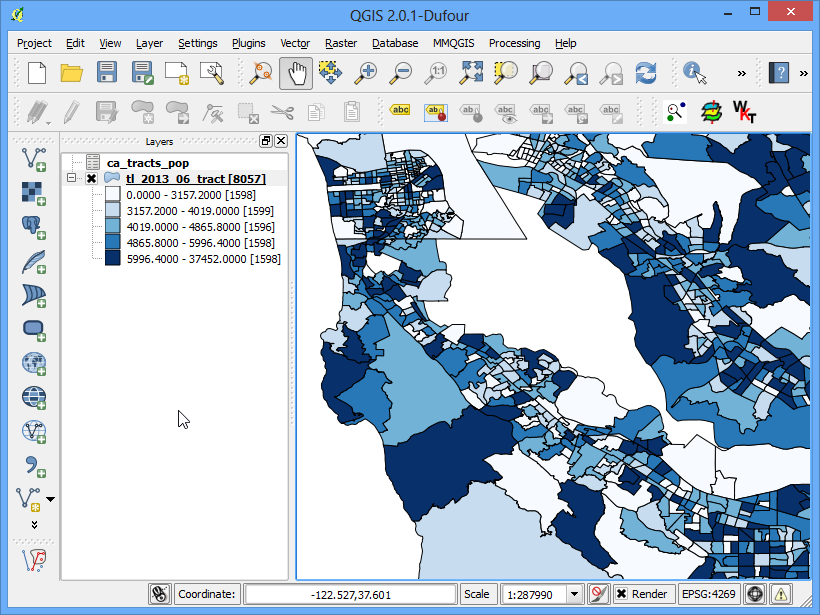
Sekarang anda akan melihat visualisasi dari daerah sensus yang telah melalui perubhan style menggunakan angka populasi. Gunakan tool Zoom in untuk memilih area yang lebih kecil pada layer.
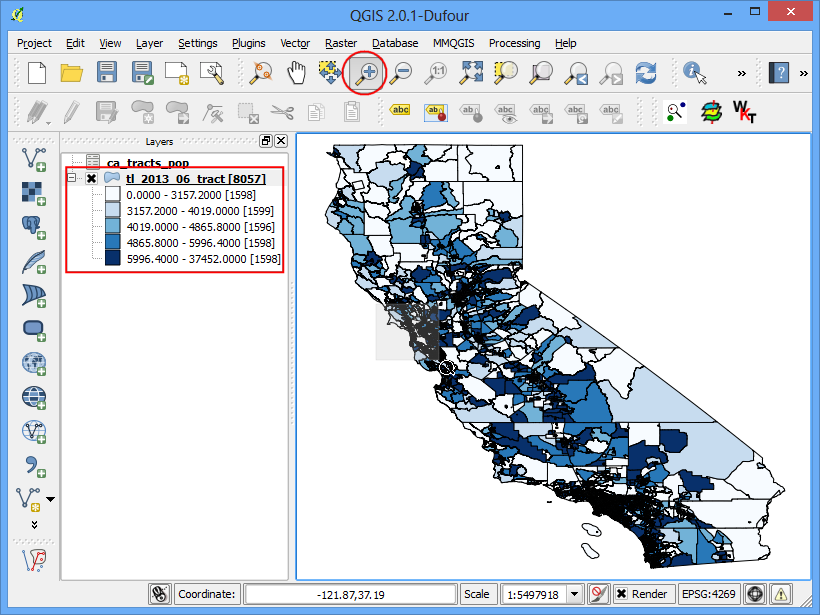
Anda mempunyai Peta Populasi California yang detail dan akurat. Anda juga bisa menggunakan teknik yang sama untuk membuat peta berdasarkan variasi data sensus.
If you want to report any issues with this tutorial, please comment below. (requires GitHub account)