Tested 2025-10-07 04:54:37 using Chrome 140.0.7339.80 (runtime settings).
| Metric | Value |
|---|---|
| Page metrics | |
| Performance Score | 95 |
| Total Page Transfer Size | 19.3 KB |
| Requests | 5 |
| Timing metrics | |
| TTFB [median] | 715 ms |
| First Paint [median] | 796 ms |
| Fully Loaded [median] | 1.405 s |
| Google Web Vitals | |
| TTFB [median] | 715 ms |
| First Contentful Paint (FCP) [median] | 796 ms |
| Largest Contentful Paint (LCP) [median] | 796 ms |
| Cumulative Layout Shift (CLS) [median] | 0.00 |
| Total Blocking Time [median] | 176 ms |
| Max Potential FID [median] | 201 ms |
| CPU metrics | |
| CPU long tasks [median] | 1 |
| CPU longest task duration | 401 ms |
| CPU last long task happens at | 804 ms |
| Visual Metrics | |
| First Visual Change [median] | 800 ms |
| Speed Index [median] | 889 ms |
| Visual Complete 85% [median] | 1.217 s |
| Visual Complete 99% [median] | 1.217 s |
| Last Visual Change [median] | 1.217 s |

| Metric | min | median | mean | max |
|---|---|---|---|---|
| Visual Metrics | ||||
| FirstVisualChange | 767 ms | 800 ms | 800 ms | 833 ms |
| LastVisualChange | 1.200 s | 1.217 s | 1.217 s | 1.233 s |
| SpeedIndex | 849 ms | 889 ms | 889 ms | 928 ms |
| LargestImage | 767 ms | 800 ms | 800 ms | 833 ms |
| Heading | 767 ms | 800 ms | 800 ms | 833 ms |
| LargestContentfulPaint | 767 ms | 800 ms | 800 ms | 833 ms |
| LastMeaningfulPaint | 767 ms | 800 ms | 800 ms | 833 ms |
| VisualReadiness | 400 ms | 417 ms | 417 ms | 433 ms |
| VisualComplete85 | 1.200 s | 1.217 s | 1.217 s | 1.233 s |
| VisualComplete95 | 1.200 s | 1.217 s | 1.217 s | 1.233 s |
| VisualComplete99 | 1.200 s | 1.217 s | 1.217 s | 1.233 s |
| Google Web Vitals | ||||
| Time To First Byte (TTFB) | 688 ms | 715 ms | 715 ms | 742 ms |
| Largest Contentful Paint (LCP) | 768 ms | 796 ms | 796 ms | 824 ms |
| First Contentful Paint (FCP) | 768 ms | 796 ms | 796 ms | 824 ms |
| Cumulative Layout Shift (CLS) | 0.0002 | 0.0003 | 0.0003 | 0.0005 |
| More metrics | ||||
| firstPaint | 768 ms | 796 ms | 796 ms | 824 ms |
| loadEventEnd | 1.227 s | 1.234 s | 1.234 s | 1.241 s |
| User Timing | ||||
| sentry-tracing-init | 990 ms | 998 | 998 ms | 1.006 s |
| CPU | ||||
| Total Blocking Time | 0 ms | 176 ms | 176 ms | 351 ms |
| Max Potential FID | 0 ms | 201 ms | 201 ms | 401 ms |
| CPU long tasks | 1 | 1 | 1 | 1 |
| CPU last long task happens at | 794 ms | 804 ms | 804 ms | 813 ms |
Run 1
Use--filmstrip.showAll to show all filmstrips.
 0 s
0 s 0.8 sFirst Visual Change 767 msLargest Image 767 msHeading 767 msFirst Contentful Paint 768 msLCP <P> 768 msLayout Shift 0.00026 791 msCPU Long Task duration 401 ms1 ssentry-tracing-init 990 ms
 1.2 sDOM Content Loaded Time 1.192 sLayout Shift 0.00020 1.198 sLast Visual Change 1.200 sVisual Complete 85% 1.200 sVisual Complete 95% 1.200 sVisual Complete 99% 1.200 s1.3 sPage Load Time 1.227 s
The coach helps you find performance problems on your web page using web performance best practice rules. And gives you advice on privacy and best practices. Tested using Coach-core version 8.1.3.

| Title | Advice | Score |
|---|---|---|
| Inline CSS for faster first render (inlineCss) | The page has both inline CSS and CSS requests even though it uses a HTTP/2-ish connection. If you have many users on slow connections, it can be better to only inline the CSS. Run your own tests and check the waterfall graph to see what happens. | 95 |
| Description: In the early days of the Internet, inlining CSS was one of the ugliest things you can do. That has changed if you want your page to start rendering fast for your user. Always inline the critical CSS when you use HTTP/1 and HTTP/2 (avoid doing CSS requests that block rendering) and lazy load and cache the rest of the CSS. It is a little more complicated when using HTTP/2. Does your server support HTTP push? Then maybe that can help. Do you have a lot of users on a slow connection and are serving large chunks of HTML? Then it could be better to use the inline technique, becasue some servers always prioritize HTML content over CSS so the user needs to download the HTML first, before the CSS is downloaded. | ||
| Avoid CPU Long Tasks (longTasks) | The page has 1 CPU long task with the total of 401 ms. The total blocking time is 351 ms . However the CPU Long Task is depending on the computer/phones actual CPU speed, so you should measure this on the same type of the device that your user is using. Use Geckoprofiler for Firefox or Chromes tracelog to debug your long tasks. | 80 |
| Description: Long CPU tasks locks the thread. To the user this is commonly visible as a "locked up" page where the browser is unable to respond to user input; this is a major source of bad user experience on the web today. However the CPU Long Task is depending on the computer/phones actual CPU speed, so you should measure this on the same type of the device that your user is using. To debug you should use the Chrome timeline log and drag/drop it into devtools or use Firefox Geckoprofiler. | ||
| Offenders: | ||
| Avoid extra requests by setting cache headers (cacheHeaders) | The page has 2 requests that are missing a cache time. Configure a cache time so the browser doesn't need to download them every time. It will save 649 B the next access. | 80 |
| Description: The easiest way to make your page fast is to avoid doing requests to the server. Setting a cache header on your server response will tell the browser that it doesn't need to download the asset again during the configured cache time! Always try to set a cache time if the content doesn't change for every request. | ||
| Offenders: | ||
| Don't use private headers on static content (privateAssets) | The page has 2 requests with private headers. The main page has a private header. It could be right in some cases where the user can be logged in and served specific content. But if your asset is static it should never be private. Make sure that the assets really should be private and only used by one user. Otherwise, make it cacheable for everyone. | 90 |
| Description: If you set private headers on content, that means that the content are specific for that user. Static content should be able to be cached and used by everyone. Avoid setting the cache header to private. | ||
| Offenders: | ||
Your best practice score is perfect!
| Title | Advice | Score |
|---|---|---|
| Set a strict transport header to make sure the user always use HTTPS. (strictTransportSecurityHeader) | A strict transport header is set but miss out on setting includeSubDomains | 90 |
| Description: The HTTP Strict-Transport-Security response header (often abbreviated as HSTS) lets a web site tell browsers that it should only be accessed using HTTPS, instead of using HTTP. https://developer.mozilla.org/en-US/docs/Web/HTTP/Headers/Strict-Transport-Security. | ||
| Page info | |
|---|---|
| Title | Explore projects · GitLab |
| Width | 1350 |
| Height | 2019 |
| DOM elements | 1638 |
| Avg DOM depth | 13 |
| Max DOM depth | 21 |
| Iframes | 0 |
| Script tags | 22 |
| Local storage | 386.6 KB |
| Session storage | 17 B |
| Network Information API | 4g |
| Resource Hints |
|---|
| preconnect |
| https://snowplowprd.trx.gitlab.net/ |
Data collected using Wappalyzer version 6.10.54. With updated code from Webappanalyzer 2024-12-27. Use --browsertime.firefox.includeResponseBodies htmlor --browsertime.chrome.includeResponseBodies htmlto help Wappalyzer find more information about technologies used.
| Technology | Confidence | Category |
|---|---|---|
| HSTS | 100 | Security |
| Cloudflare | 100 | CDN |
Data from run 1
| Visual Metrics | |
|---|---|
| First Visual Change | 767 ms |
| Speed Index | 849 ms |
| Largest Image | 767 ms |
| Heading | 767 ms |
| LargestContentfulPaint | 767 ms |
| Last Meaningful Paint | 767 ms |
| Largest Contentful Paint | 767 ms |
| Visual Complete 85% | 1.200 s |
| Visual Complete 95% | 1.200 s |
| Visual Complete 99% | 1.200 s |
| Last Visual Change | 1.200 s |
| Visual Readiness | 433 ms |
| Navigation Timing | |
|---|---|
| backEndTime | 688 ms |
| domContentLoadedTime | 1.192 s |
| domInteractiveTime | 795 ms |
| domainLookupTime | 0 ms |
| frontEndTime | 510 ms |
| pageDownloadTime | 29 ms |
| pageLoadTime | 1.227 s |
| redirectionTime | 0 ms |
| serverConnectionTime | 0 ms |
| serverResponseTime | 713 ms |
| Google Web Vitals | |
|---|---|
| Time to first byte (TTFB) | 688 ms |
| First Contentful Paint (FCP) | 768 ms |
| Largest Contentful Paint (LCP) | 768 ms |
| Cumulative Layout Shift (CLS) | 0.00 |
| Total Blocking Time (TBT) | 351 ms |
| First Contentful Paint info | |
|---|---|
| Elements that needed recalculate style before FCP | 789 |
| Time spent in recalculate style before FCP | 14.52 ms |
| Extra timings | |
|---|---|
| TTFB | 688 ms |
| First Paint | 768 ms |
| Load Event End | 1.227 s |
| Fully loaded | 1.405 s |
| User Timing marks | |
|---|---|
| sentry-tracing-init | 990 ms |
When in time the page main content is rendered (collected using the Largest Contentful Paint API). Read more about Largest Contentful Paint.
| Element type | P |
| Element/tag | <p data-sourcepos="3:1-3:170" dir="auto"></p> |
| Render time | 768 ms |
| Element render delay | 80 ms |
| TTFB | 688 ms |
| Resource delay | 0 ms |
| Resource load duration | 0 ms |
| Elements that needed recalculate style before LCP | 789 |
| Time spent in recalculate style before LCP | 14.52 ms |
| Load time | 0 ms |
| Size (width*height) | 17069 |
| DOM path | |
| div:eq(1) > div:eq(1) > div:eq(3) > main#content-body > div:eq(5) > ul > li:eq(3) > div:eq(1) > div > div:eq(1) > p:eq(1)> div:eq(1) > div:eq(1) > div:eq(3) > main#content-body > div:eq(5) > ul > li:eq(3) > div:eq(1) > div > div:eq(1) > p:eq(1)> | |
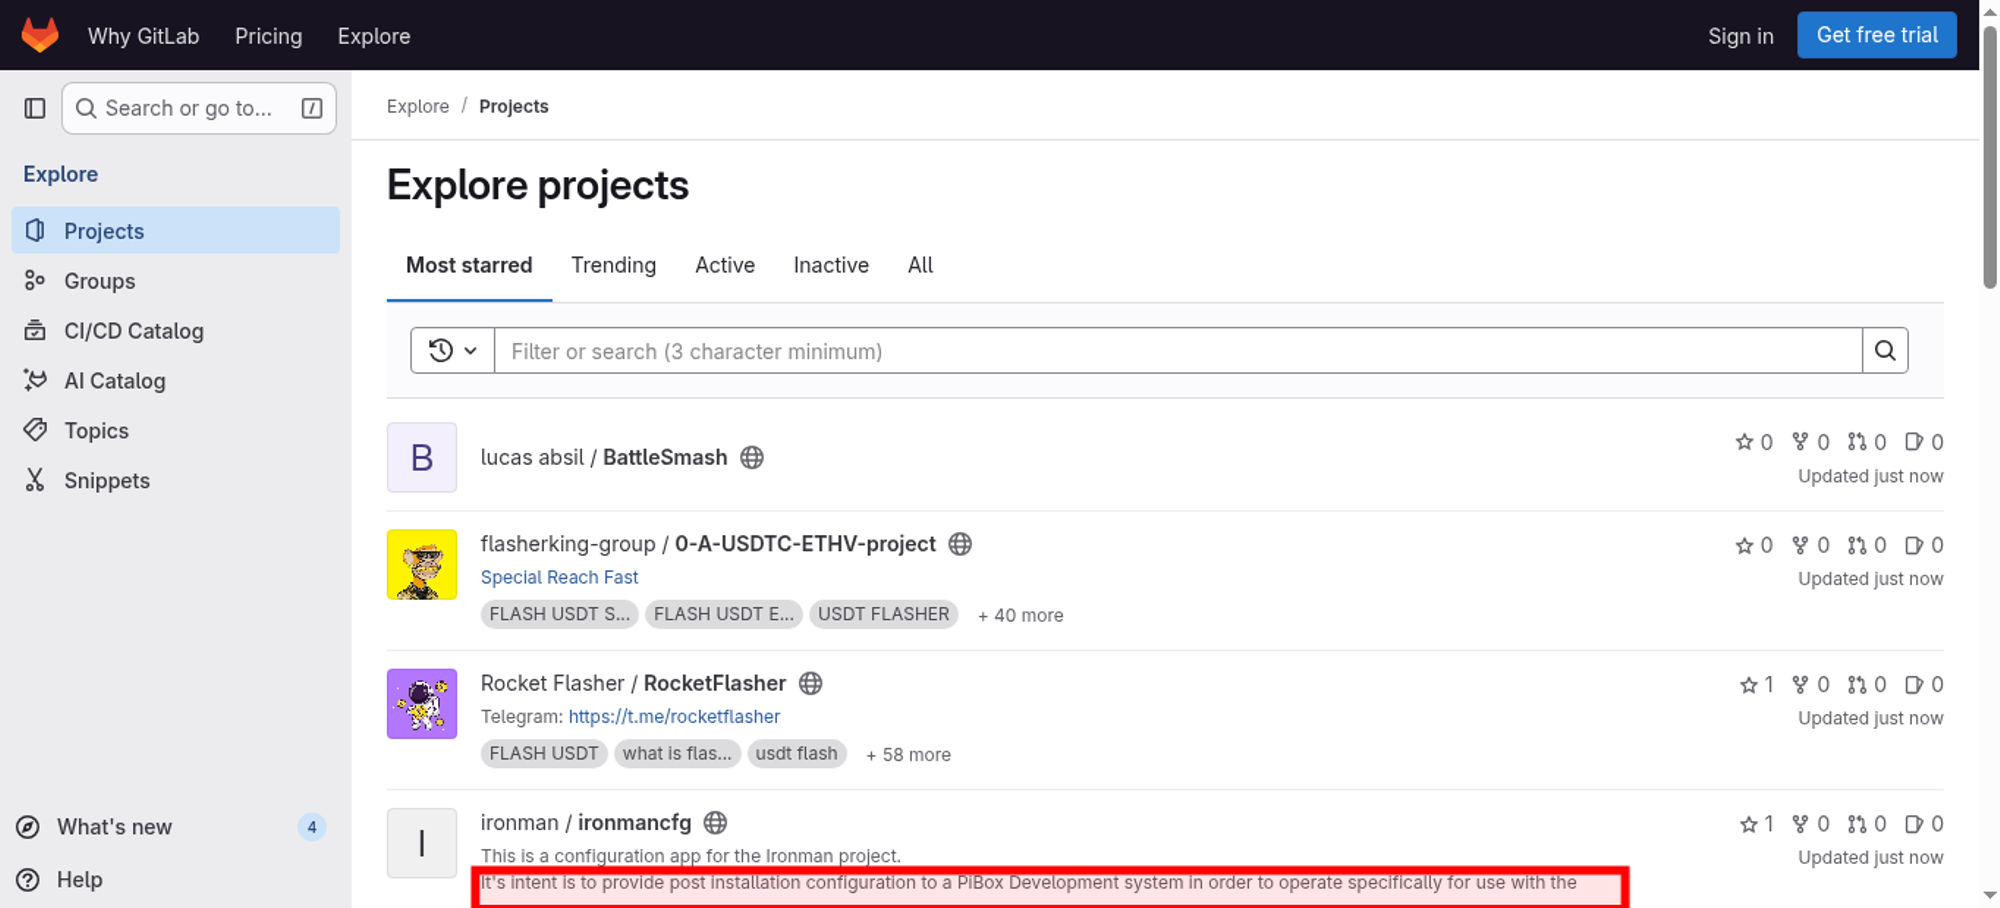
The largest contentful paint is highlighted in the image. If no element is highlighted the element was removed before the screenshot or the LCP API couldn't find the element.
0.00046 cumulative layout shift collected from the Cumulative Layout Shift API.
These HTML elements contribute most to the Cumulative Layout Shifts of the page. The higher score, the more layout shift.
| Score | HTML Element |
|---|---|
| 0.00026 | <div class="project-cell project-controls gl-text-subtle @sm/panel:gl-flex gl-items-center !gl-align-middle !gl-hidden @sm/panel:!gl-table-cell" data-testid="project_controls"></div>,<div class="project-cell project-controls gl-text-subtle !gl-hidden @sm/panel:!gl-table-cell" data-testid="project_controls"></div>,<div class="project-cell project-controls gl-text-subtle !gl-hidden @sm/panel:!gl-table-cell" data-testid="project_controls"></div>,<div class="project-cell project-controls gl-text-subtle !gl-hidden @sm/panel:!gl-table-cell" data-testid="project_controls"></div> |
| body > div:eq(1) > div:eq(1) > div:eq(3) > main#content-body > div:eq(5) > ul > li:eq(0) > div:eq(2),body > div:eq(1) > div:eq(1) > div:eq(3) > main#content-body > div:eq(5) > ul > li:eq(1) > div:eq(2),body > div:eq(1) > div:eq(1) > div:eq(3) > main#content-body > div:eq(5) > ul > li:eq(2) > div:eq(2),body > div:eq(1) > div:eq(1) > div:eq(3) > main#content-body > div:eq(5) > ul > li:eq(3) > div:eq(2) | |
| 0.00020 | <span></span>,<span></span>,<span></span>,<span></span> |
| body > div:eq(1) > div:eq(1) > div:eq(3) > main#content-body > div:eq(5) > ul > li:eq(0) > div:eq(2) > div:eq(1) > span,body > div:eq(1) > div:eq(1) > div:eq(3) > main#content-body > div:eq(5) > ul > li:eq(1) > div:eq(2) > div:eq(1) > span,body > div:eq(1) > div:eq(1) > div:eq(3) > main#content-body > div:eq(5) > ul > li:eq(2) > div:eq(2) > div:eq(1) > span,body > div:eq(1) > div:eq(1) > div:eq(3) > main#content-body > div:eq(5) > ul > li:eq(3) > div:eq(2) > div:eq(1) > span | |
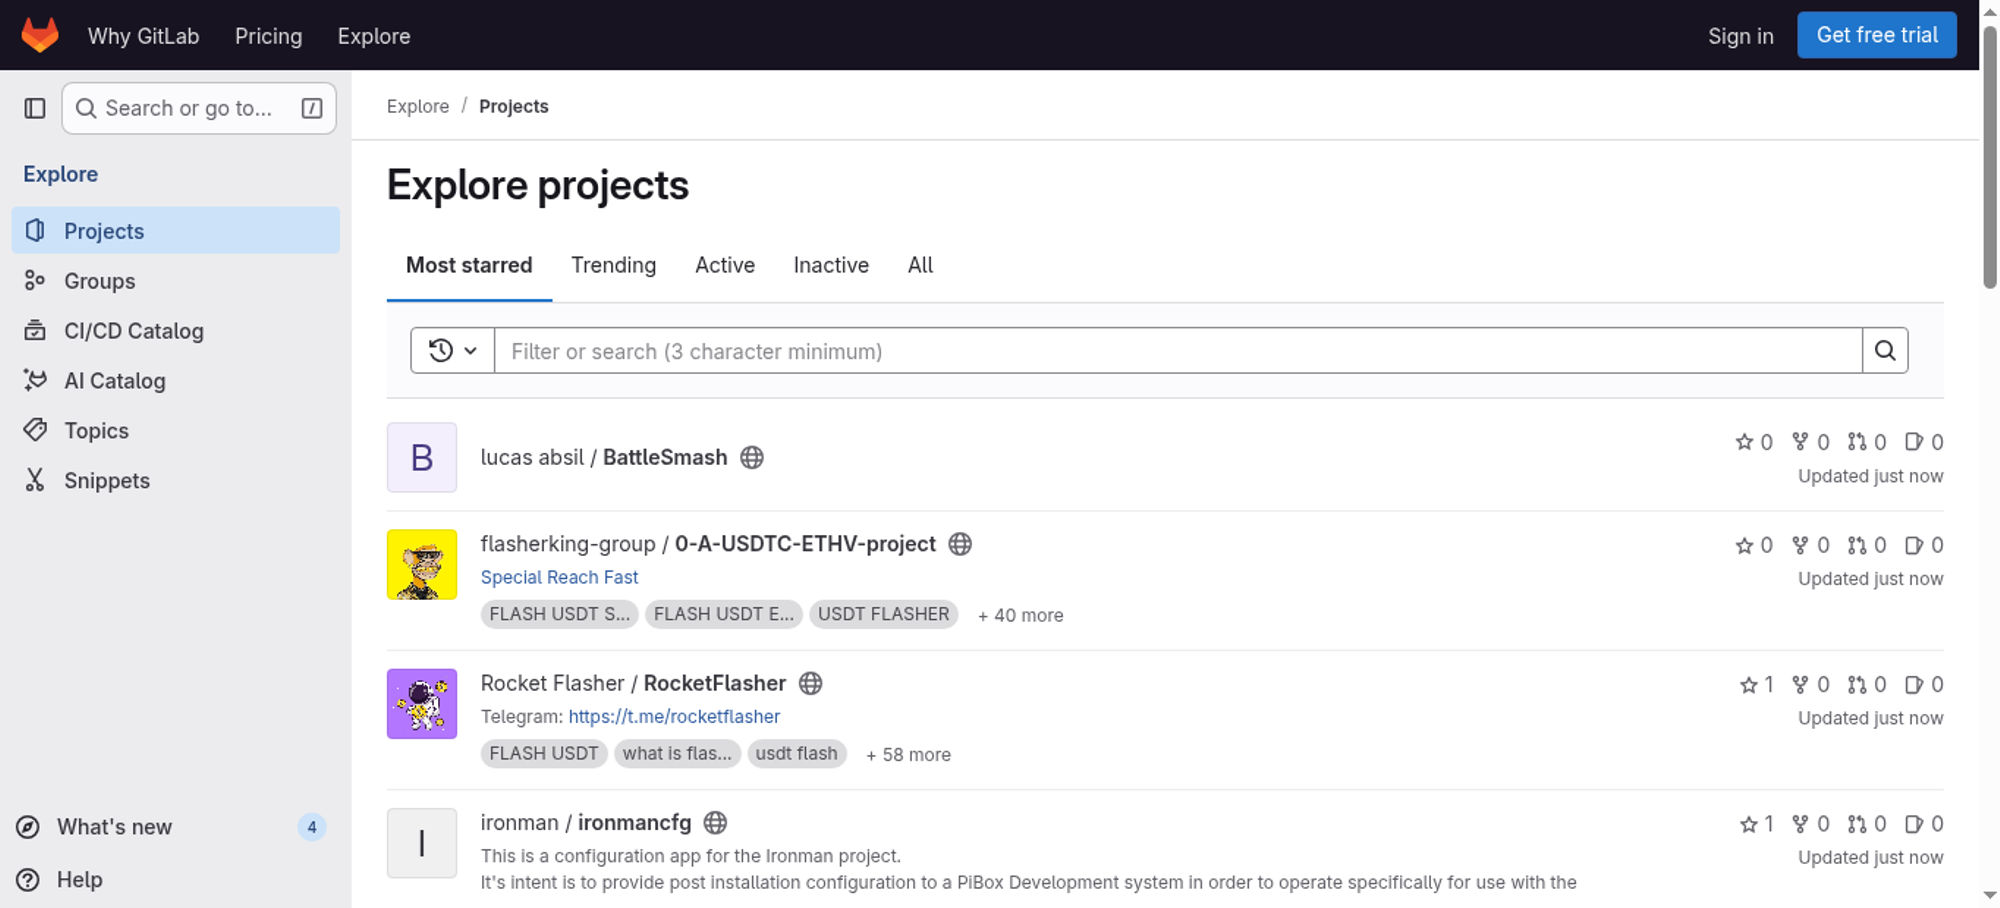
The elements that have shifted place is highlighted in the image (that have a higher value than 0.01). If the element shifted outside of the viewport, you will not see it there. It can be hard to understand what content that has shifted, if that's the case, checkout the video or the filmstrip of the run.
Read more about the Long Animation Frames API here here.
The top 10 longest animation frames entries
| Blocking duration | Work duration | Render duration | PreLayout Duration | Style And Layout Duration |
|---|---|---|---|---|
| 353.5 ms | 402.3 ms | 2.2 ms | 1.9 ms | 0.3 ms |
| https://gitlab.com/assets/webpack/main.dc7de4d6.chunk.js | ||||
Invoker: https://gitlab.com/assets/webpack/main.dc7de4d6.chunk.js | ||||
| https://gitlab.com/assets/webpack/tracker.85adcc5f.chunk.js | ||||
Invoker: https://gitlab.com/assets/webpack/tracker.85adcc5f.chunk.js | ||||
| https://gitlab.com/assets/webpack/analytics.1f5b93d6.chunk.js | ||||
Invoker: https://gitlab.com/assets/webpack/analytics.1f5b93d6.chunk.js | ||||
| https://gitlab.com/assets/webpack/sentry.61dff9c0.chunk.js | ||||
Invoker: https://gitlab.com/assets/webpack/sentry.61dff9c0.chunk.js | ||||
| https://gitlab.com/assets/webpack/commons-pages.groups.settings.work_items.show-super_sidebar.cf340fb7.chunk.js | ||||
Invoker: https://gitlab.com/assets/webpack/commons-pages.groups.settings.work_items.show-super_sidebar.cf340fb7.chunk.js | ||||
| https://gitlab.com/assets/webpack/super_sidebar.fc4e151c.chunk.js | ||||
Forced Style And Layout Duration: 22 ms Invoker: https://gitlab.com/assets/webpack/super_sidebar.fc4e151c.chunk.js | ||||
| https://gitlab.com/assets/webpack/pages.explore.projects.cc1cde8a.chunk.js | ||||
Forced Style And Layout Duration: 2 ms Invoker: https://gitlab.com/assets/webpack/pages.explore.projects.cc1cde8a.chunk.js | ||||
| Blocking duration | Work duration | Render duration | PreLayout Duration | Style And Layout Duration |
|---|---|---|---|---|
| 1.9 ms | 35.1 ms | 17.1 ms | 0.1 ms | 17 ms |
| https://gitlab.com/assets/webpack/main.dc7de4d6.chunk.js | ||||
Forced Style And Layout Duration: 23 ms Invoker: IdleRequestCallback | ||||
| Blocking duration | Work duration | Render duration | PreLayout Duration | Style And Layout Duration |
|---|---|---|---|---|
| 0 ms | 38.2 ms | 21.9 ms | 0.1 ms | 21.8 ms |
| No availible script information. | ||||
There are no Server Timings.
There are no custom configured scripts.
There are no custom extra metrics from scripting.
| Name | Display Time | X | Y | Width | Height |
|---|---|---|---|---|---|
| LargestImage (photo_2025-07-25_23-37-21.jpg?width=48) | 767 ms | 264 | 361 | 48 | 48 |
| <img srcset="/uploads/-/system/project/avatar/75080181/photo_2025-07-25_23-37-21.jpg?width=48 1x, /uploads/-/system/project/avatar/75080181/photo_2025-07-25_23-37-21.jpg?width=96 2x" class="gl-avatar gl-avatar-s48 !gl-rounded-base" height="48" width="48" loading="lazy" aria-hidden="true" src="/uploads/-/system/project/avatar/75080181/photo_2025-07-25_23-37-21.jpg?width=48"> | |||||
| Heading | 767 ms | 264 | 108 | 207 | 36 |
| <h1 class="page-title gl-text-size-h-display"></h1> | |||||
| LargestContentfulPaint | 767 ms | 328 | 593 | 793 | 36 |
| <p data-sourcepos="3:1-3:170" dir="auto"></p> | |||||
How the page is built.
| Summary | |
|---|---|
| HTTP version | HTTP/2.0 |
| Total requests | 5 |
| Total domains | 3 |
| Total transfer size | 19.3 KB |
| Total content size | 182.2 KB |
| Responses missing compression | 1 |
| Number of cookies | 2 |
| Third party cookies | 0 |
| Requests per response code | |
|---|---|
| 200 | 5 |
| URL | Type | Transfer Size | Content Size |
|---|---|---|---|
| https://gitlab.com/explore | html | 18.0 KB | 179.7 KB |
| https://new-sentry.g...t/api/4/envelope/ | json | 391 B | 2 B |
| https://gitlab.com/-...cons/logo-192.png | image | 346 B | 1.8 KB |
| https://gitlab.com/-/manifest.json | json | 303 B | 719 B |
| https://snowplowprd....tics.snowplow/tp2 | plain | 226 B | 2 B |
| Content | Header Size | Transfer Size | Content Size | Requests |
|---|---|---|---|---|
| html | 0 b | 18.0 KB | 179.7 KB | 1 |
| image | 0 b | 346 B | 1.8 KB | 1 |
| json | 0 b | 694 B | 721 B | 2 |
| plain | 0 b | 226 B | 2 B | 1 |
| Total | 0 b | 19.3 KB | 182.2 KB | 5 |
| Domain | Total download time | Transfer Size | Content Size | Requests |
|---|---|---|---|---|
| gitlab.com | 886 ms | 18.7 KB | 182.2 KB | 3 |
| new-sentry.gitlab.net | 54 ms | 391 B | 2 B | 1 |
| snowplowprd.trx.gitlab.net | 76 ms | 226 B | 2 B | 1 |
| type | min | median | max |
|---|---|---|---|
| Expires | 0 seconds | 0 seconds | 0 seconds |
| Last modified | 7 hours | 7 hours | 7 hours |
Included requests done after load event end.
| Content | Transfer Size | Requests |
|---|---|---|
| html | 0 b | 0 |
| css | 0 b | 0 |
| javascript | 0 b | 0 |
| image | 346 B | 1 |
| font | 0 b | 0 |
| json | 303 B | 1 |
| plain | 226 B | 1 |
| Total | 875 B | 3 |
Includes requests done after DOM content loaded.
| Content | Transfer Size | Requests |
|---|---|---|
| html | 0 b | 0 |
| css | 0 b | 0 |
| javascript | 0 b | 0 |
| image | 346 B | 1 |
| font | 0 b | 0 |
| json | 303 B | 1 |
| plain | 226 B | 1 |
| Total | 875 B | 3 |
Download the Chrome trace log and drag and drop it into Developer Tools / Performance in Chrome.
Collected using the Long Task API. A long task is a task that take 50 milliseconds or more.
| Type | Quantity | Total duration (ms) |
|---|---|---|
| Total Blocking Time | 351 | |
| Max Potential First Input Delay | 401 | |
| Long Tasks before First Paint | 0 | 0 |
| Long Tasks before First Contentful Paint | 0 | 0 |
| Long Tasks before Largest Contentful Paint | 0 | 0 |
| Long Tasks after Load Event End | 0 | 0 |
| Total Long Tasks | 1 | 401 |
CPU last long task happened at 794 ms
| name | startTime | duration | containerId | containerName | containerSrc | containerType |
|---|---|---|---|---|---|---|
| self | 794 | 401 | window |
Calculated using Tracium.
| Categories (ms) | |
|---|---|
| parseHTML | 25 |
| styleLayout | 116 |
| paintCompositeRender | 10 |
| scriptParseCompile | 135 |
| scriptEvaluation | 272 |
| garbageCollection | 4 |
| other | 51 |
| Events (ms) | |
|---|---|
| v8.compile | 135 |
| v8.run | 121 |
| UpdateLayoutTree | 96 |
| v8.produceCache | 62 |
| RunMicrotasks | 52 |
| RunTask | 32 |
| ParseHTML | 25 |
| FunctionCall | 25 |
| Layout | 19 |
| Tool/domain | Time (ms) |
|---|---|
| gitlab.com | 431.3 |
Third party requests categorised by Third party web version 0.26.2.
Calculated using .*gitlab.* (use --firstParty to configure).
| Content | Header Size | Transfer Size | Content Size | Requests |
|---|---|---|---|---|
| html | 0 b | 18.0 KB | 179.7 KB | 1 |
| css | 0 b | 0 b | 0 b | 0 |
| javascript | 0 b | 0 b | 0 b | 0 |
| image | 0 b | 346 B | 1.8 KB | 1 |
| font | 0 b | 0 b | 0 b | 0 |
| json | 0 b | 694 B | 721 B | 2 |
| plain | 0 b | 226 B | 2 B | 1 |
| Total | N/A | 19.3 KB | 182.2 KB | 5 |
| Content | Header Size | Transfer Size | Content Size | Requests |
|---|---|---|---|---|
| html | 0 b | 0 b | 0 b | 0 |
| css | 0 b | 0 b | 0 b | 0 |
| javascript | 0 b | 0 b | 0 b | 0 |
| image | 0 b | 0 b | 0 b | 0 |
| font | 0 b | 0 b | 0 b | 0 |
| Total | N/A | N/A | N/A |
Axe is an accessibility testing engine for websites and other HTML-based user interfaces. Tested using axe-core version 4.10.3. Read more about axe-core .
Median number of violations for all the runs. Check each individual run to see all the violations.
| Type | Violations (median) |
|---|---|
| Critical | 0 (0 issues) |
| Serious | 0 (0 issues) |
| Moderate | 0 (0 issues) |
| Minor | 0 (0 issues) |