FuzzBench: 2024-08-03-test report
experiment summary
No aggregate ranking as the data contains a single benchmark.-
Median relative code-coverages on each benchmark
Note: The relative coverage summary table shows the median relative performance of each fuzzer to the experiment maximum. Thus the highest relative performance may not be 100%.
trial_relative_coverage = trial_coverage / experiment_max_coverage
aflplusplus honggfuzz libafl libfuzzer afl aflfast aflsmart eclipser mopt centipede fairfuzz FuzzerMedian 99.00 99.00 99.00 98.00 97.00 97.00 97.00 97.00 97.00 93.00 89.00 FuzzerMean 99.00 99.00 99.00 98.00 97.00 97.00 97.00 97.00 97.00 93.00 89.00 libxml2_xml 99.00 99.00 99.00 98.00 97.00 97.00 97.00 97.00 97.00 93.00 89.00 - Fuzzers are sorted by "FuzzerMean" (average median relative coverage), highest on the left.
- Green background = highest relative median coverage.
- Blue gradient background = greater than 95% relative median coverage.
libxml2_xml summary
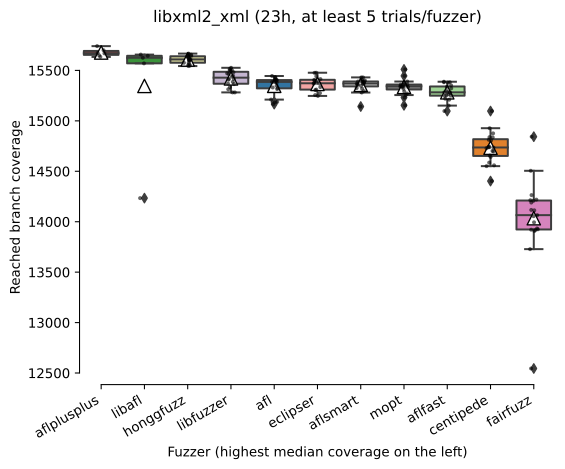
Ranking by median reached code coverage
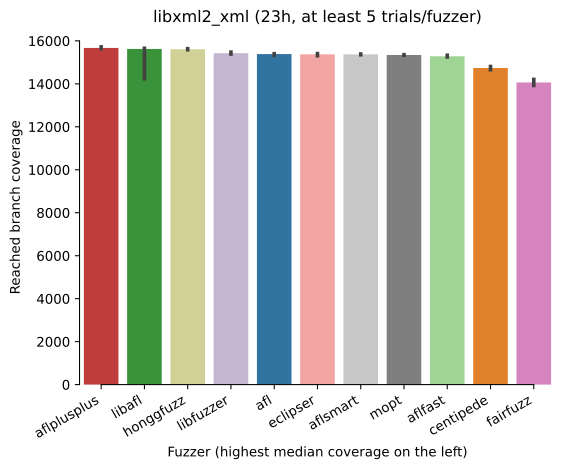
Reached code coverage distribution
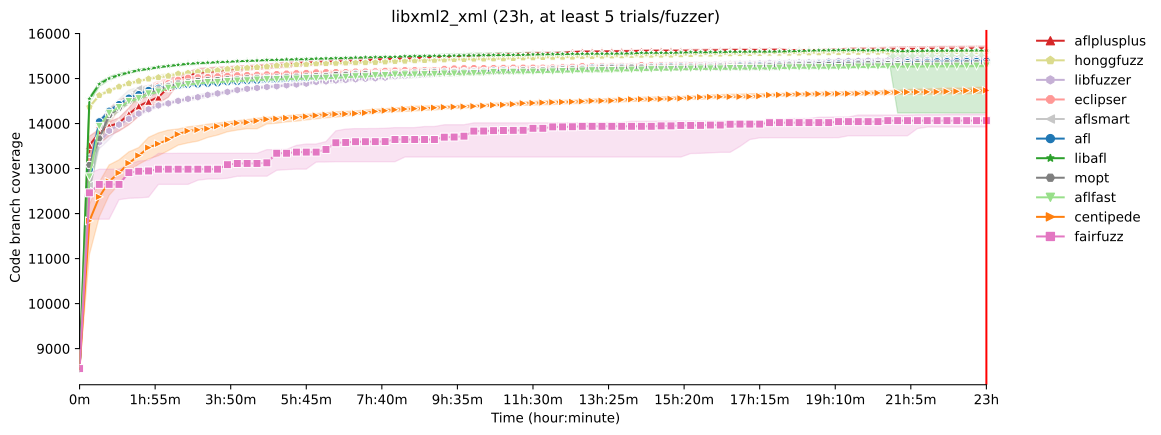
Mean code coverage growth over time
Mean code coverage growth over time
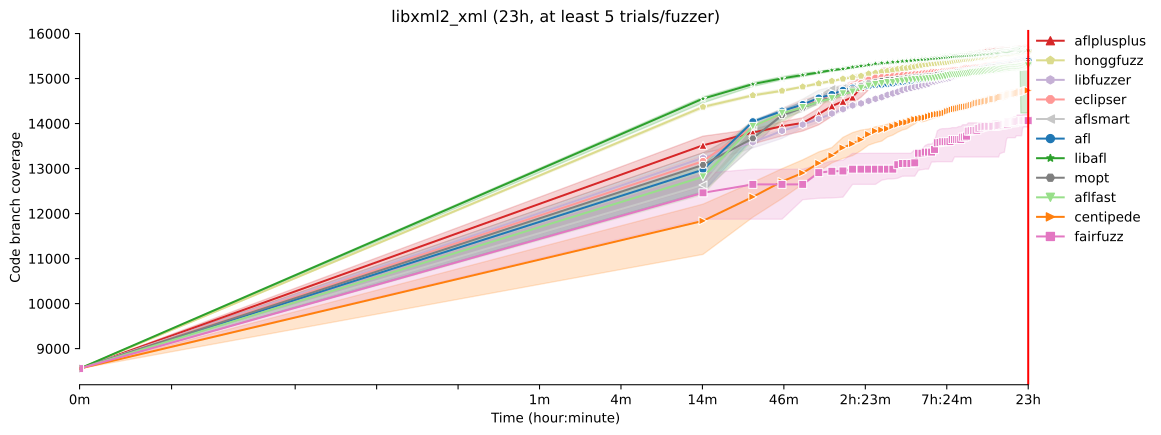
* The error bands show the 95% confidence interval
around the mean code coverage.
error
The following fuzzers do not have enough samples:
aflplusplus, libafl.
-
Sample statistics and statistical significance (code coverage)
Code coverage sample statistics
count mean std min 25% median 75% max fuzzer time aflplusplus 82800 6.0 15677.666667 38.302306 15634.0 15654.00 15671.0 15693.25 15741.0 libafl 82800 5.0 15346.200000 622.632074 14234.0 15570.00 15625.0 15645.00 15657.0 honggfuzz 82800 20.0 15608.150000 38.615888 15543.0 15576.00 15609.0 15640.25 15667.0 libfuzzer 82800 20.0 15420.950000 77.287893 15282.0 15367.75 15428.0 15486.25 15526.0 afl 82800 20.0 15347.200000 89.603571 15166.0 15322.50 15386.0 15404.25 15445.0 eclipser 82800 17.0 15366.176471 70.190130 15247.0 15310.00 15373.0 15407.00 15477.0 aflsmart 82800 20.0 15356.900000 64.464515 15142.0 15341.50 15371.0 15390.50 15431.0 mopt 82800 20.0 15336.600000 74.989403 15154.0 15311.25 15343.0 15360.00 15510.0 aflfast 82800 20.0 15282.950000 77.642551 15097.0 15249.50 15282.5 15340.75 15388.0 centipede 82800 20.0 14733.700000 151.201539 14403.0 14652.50 14736.5 14818.00 15097.0 fairfuzz 82800 19.0 14034.842105 437.228934 12545.0 13923.00 14065.0 14210.00 14843.0
Vargha-Delaney A12 measure
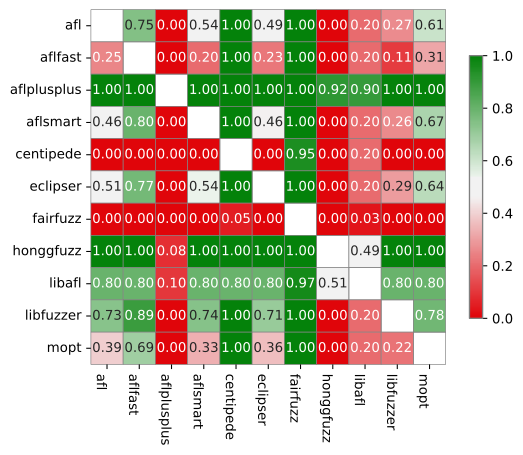 The table summarizes the A12 values from the
pairwise Vargha-Delaney A measure of effect size.
Green cells indicate the probability the fuzzer in the
row will outperform the fuzzer in the column.
The table summarizes the A12 values from the
pairwise Vargha-Delaney A measure of effect size.
Green cells indicate the probability the fuzzer in the
row will outperform the fuzzer in the column.
Mann-Whitney U test
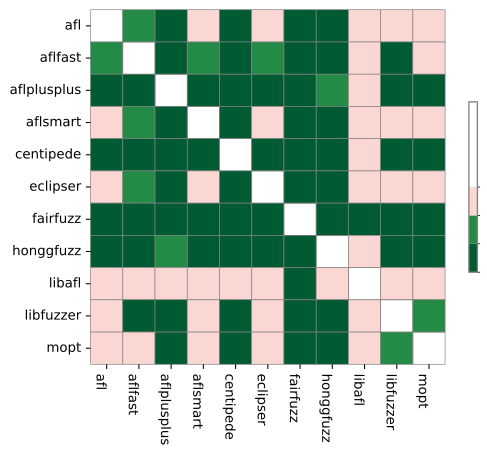 The table summarizes the p values of
pairwise Mann-Whitney U tests.
Green cells indicate that the reached
coverage distribution of a given fuzzer pair
is significantly different.
The table summarizes the p values of
pairwise Mann-Whitney U tests.
Green cells indicate that the reached
coverage distribution of a given fuzzer pair
is significantly different.
-
Unique code coverage plots
Ranking by unique code branches covered
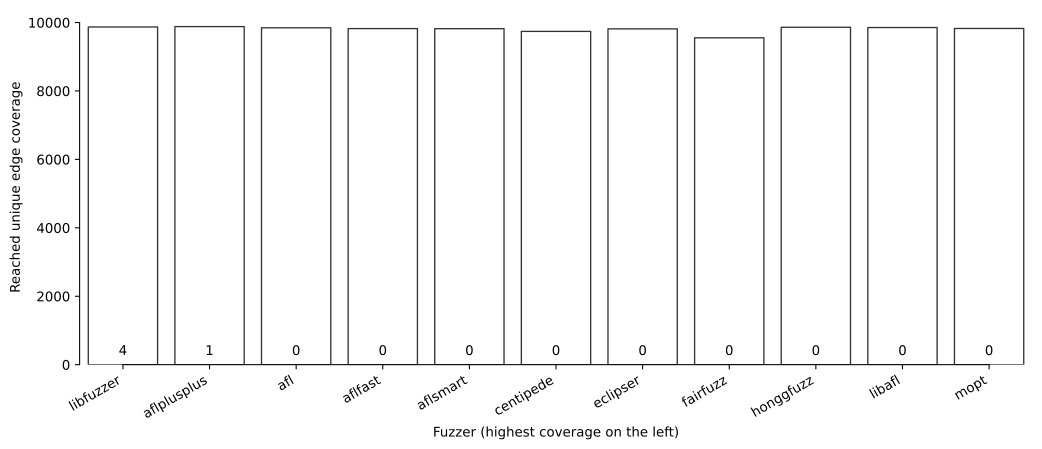 Each bar shows the total number of code branches found by a given fuzzer.
The colored area shows the number of unique code branches
(i.e., branches that were not covered by any other fuzzers).
Each bar shows the total number of code branches found by a given fuzzer.
The colored area shows the number of unique code branches
(i.e., branches that were not covered by any other fuzzers).
Pairwise unique code coverage
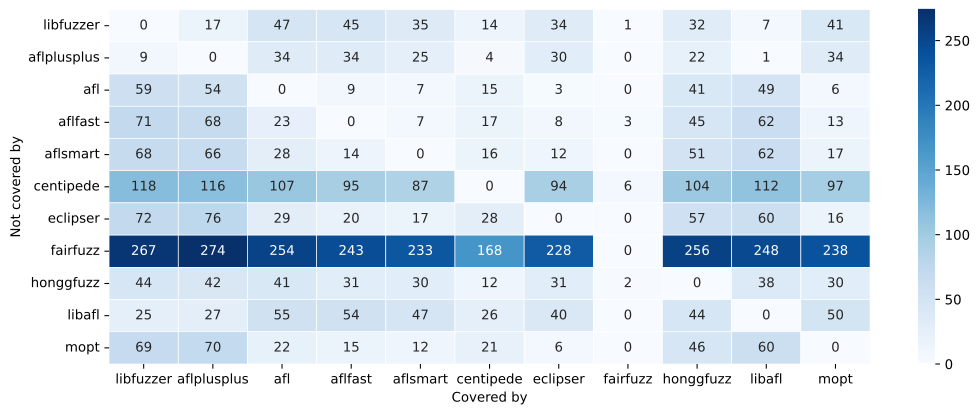 Each cell represents the number of code branches covered by the fuzzer
of the column but not by the fuzzer of the row
Each cell represents the number of code branches covered by the fuzzer
of the column but not by the fuzzer of the row
-
Code coverage reports for each fuzzer on this benchmark
experiment data
You can download the raw data for this report here.Check out the documentation on how to create customized reports using this data. Also see some example Colab notebooks for doing custom analysis on the data here.
Experiment Description:
(None,)