Автоматизация компоновки карты с помощью инструмента создания атласа (QGIS3)
Если вы занимаетесь созданием печатных или веб-карт, возможно, перед вами возникает задача создания по некоторому шаблону большого количества карт - как правило, по одной на каждую административную единицу или область интереса. Создание таких карт вручную может отнимать много времени, и, если вы планируете регулярно их обновлять, эта работа может стать утомительной. QGIS содержит инструмент «Атлас», который поможет вам создать шаблон карты и позволит публиковать множество карт разных географических регионов. Если вы не знакомы с основами создания макетов карт, пожалуйста, изучите урок Создание карты.
Обзор задачи
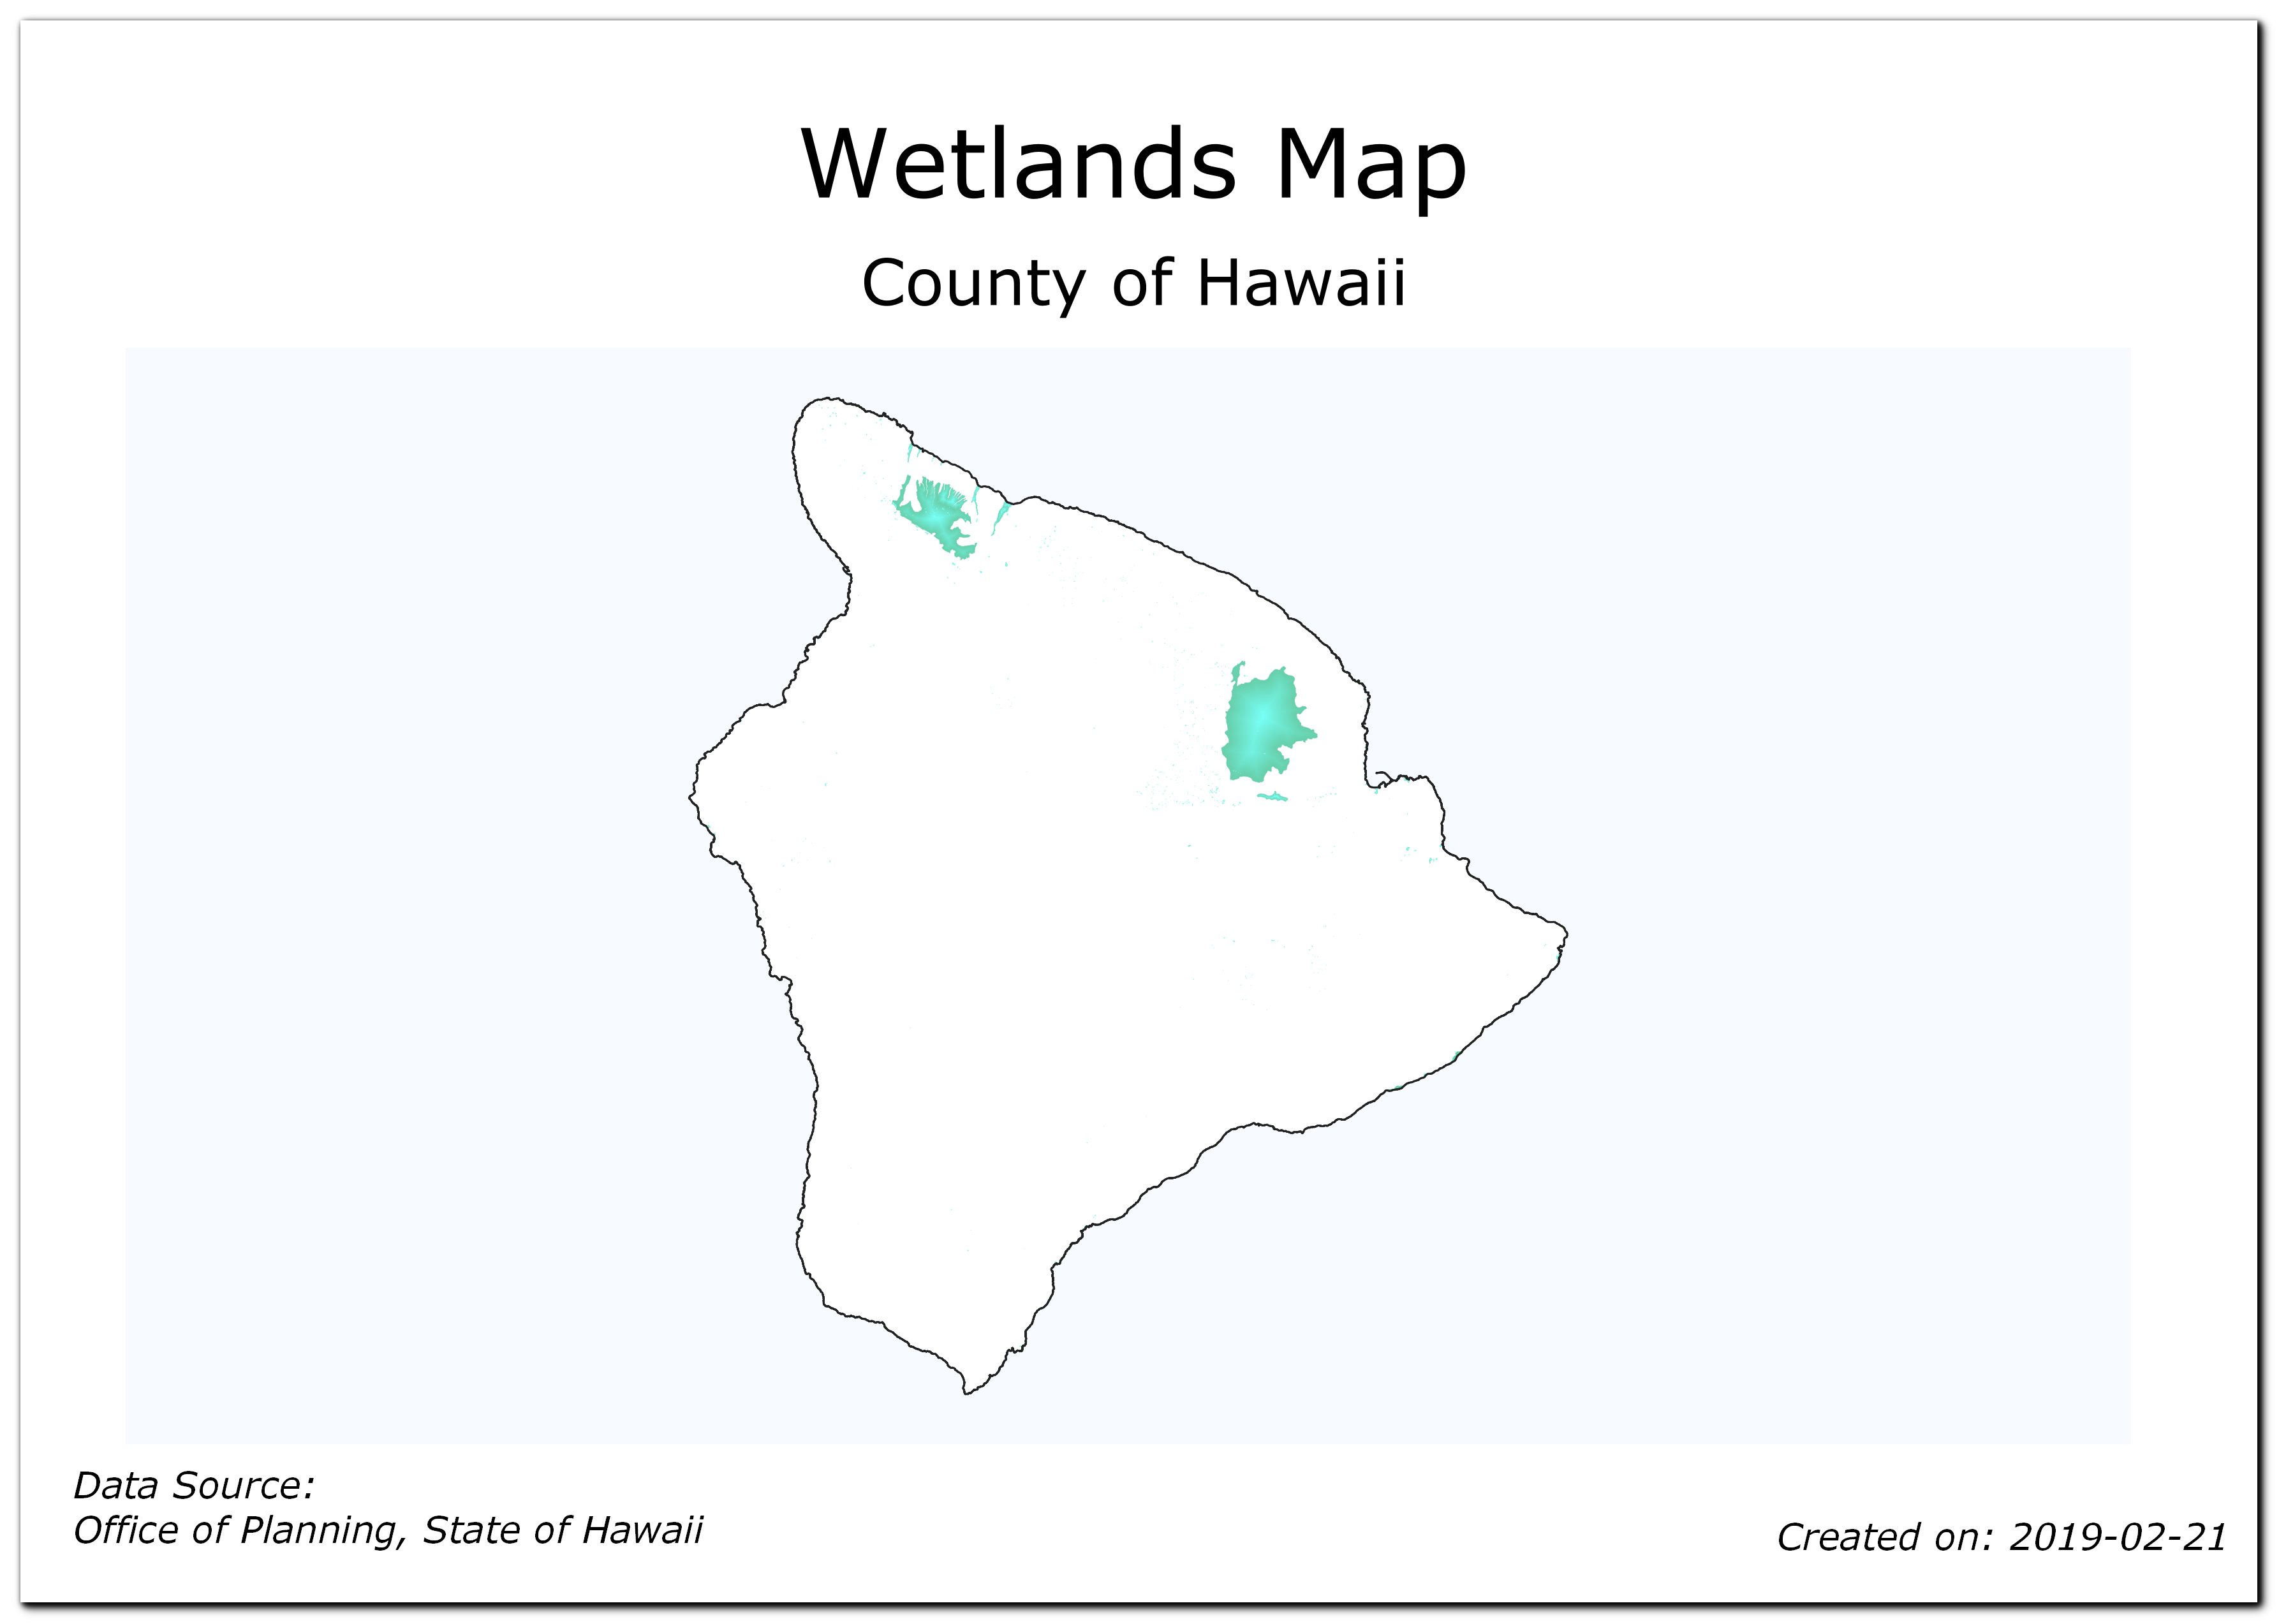
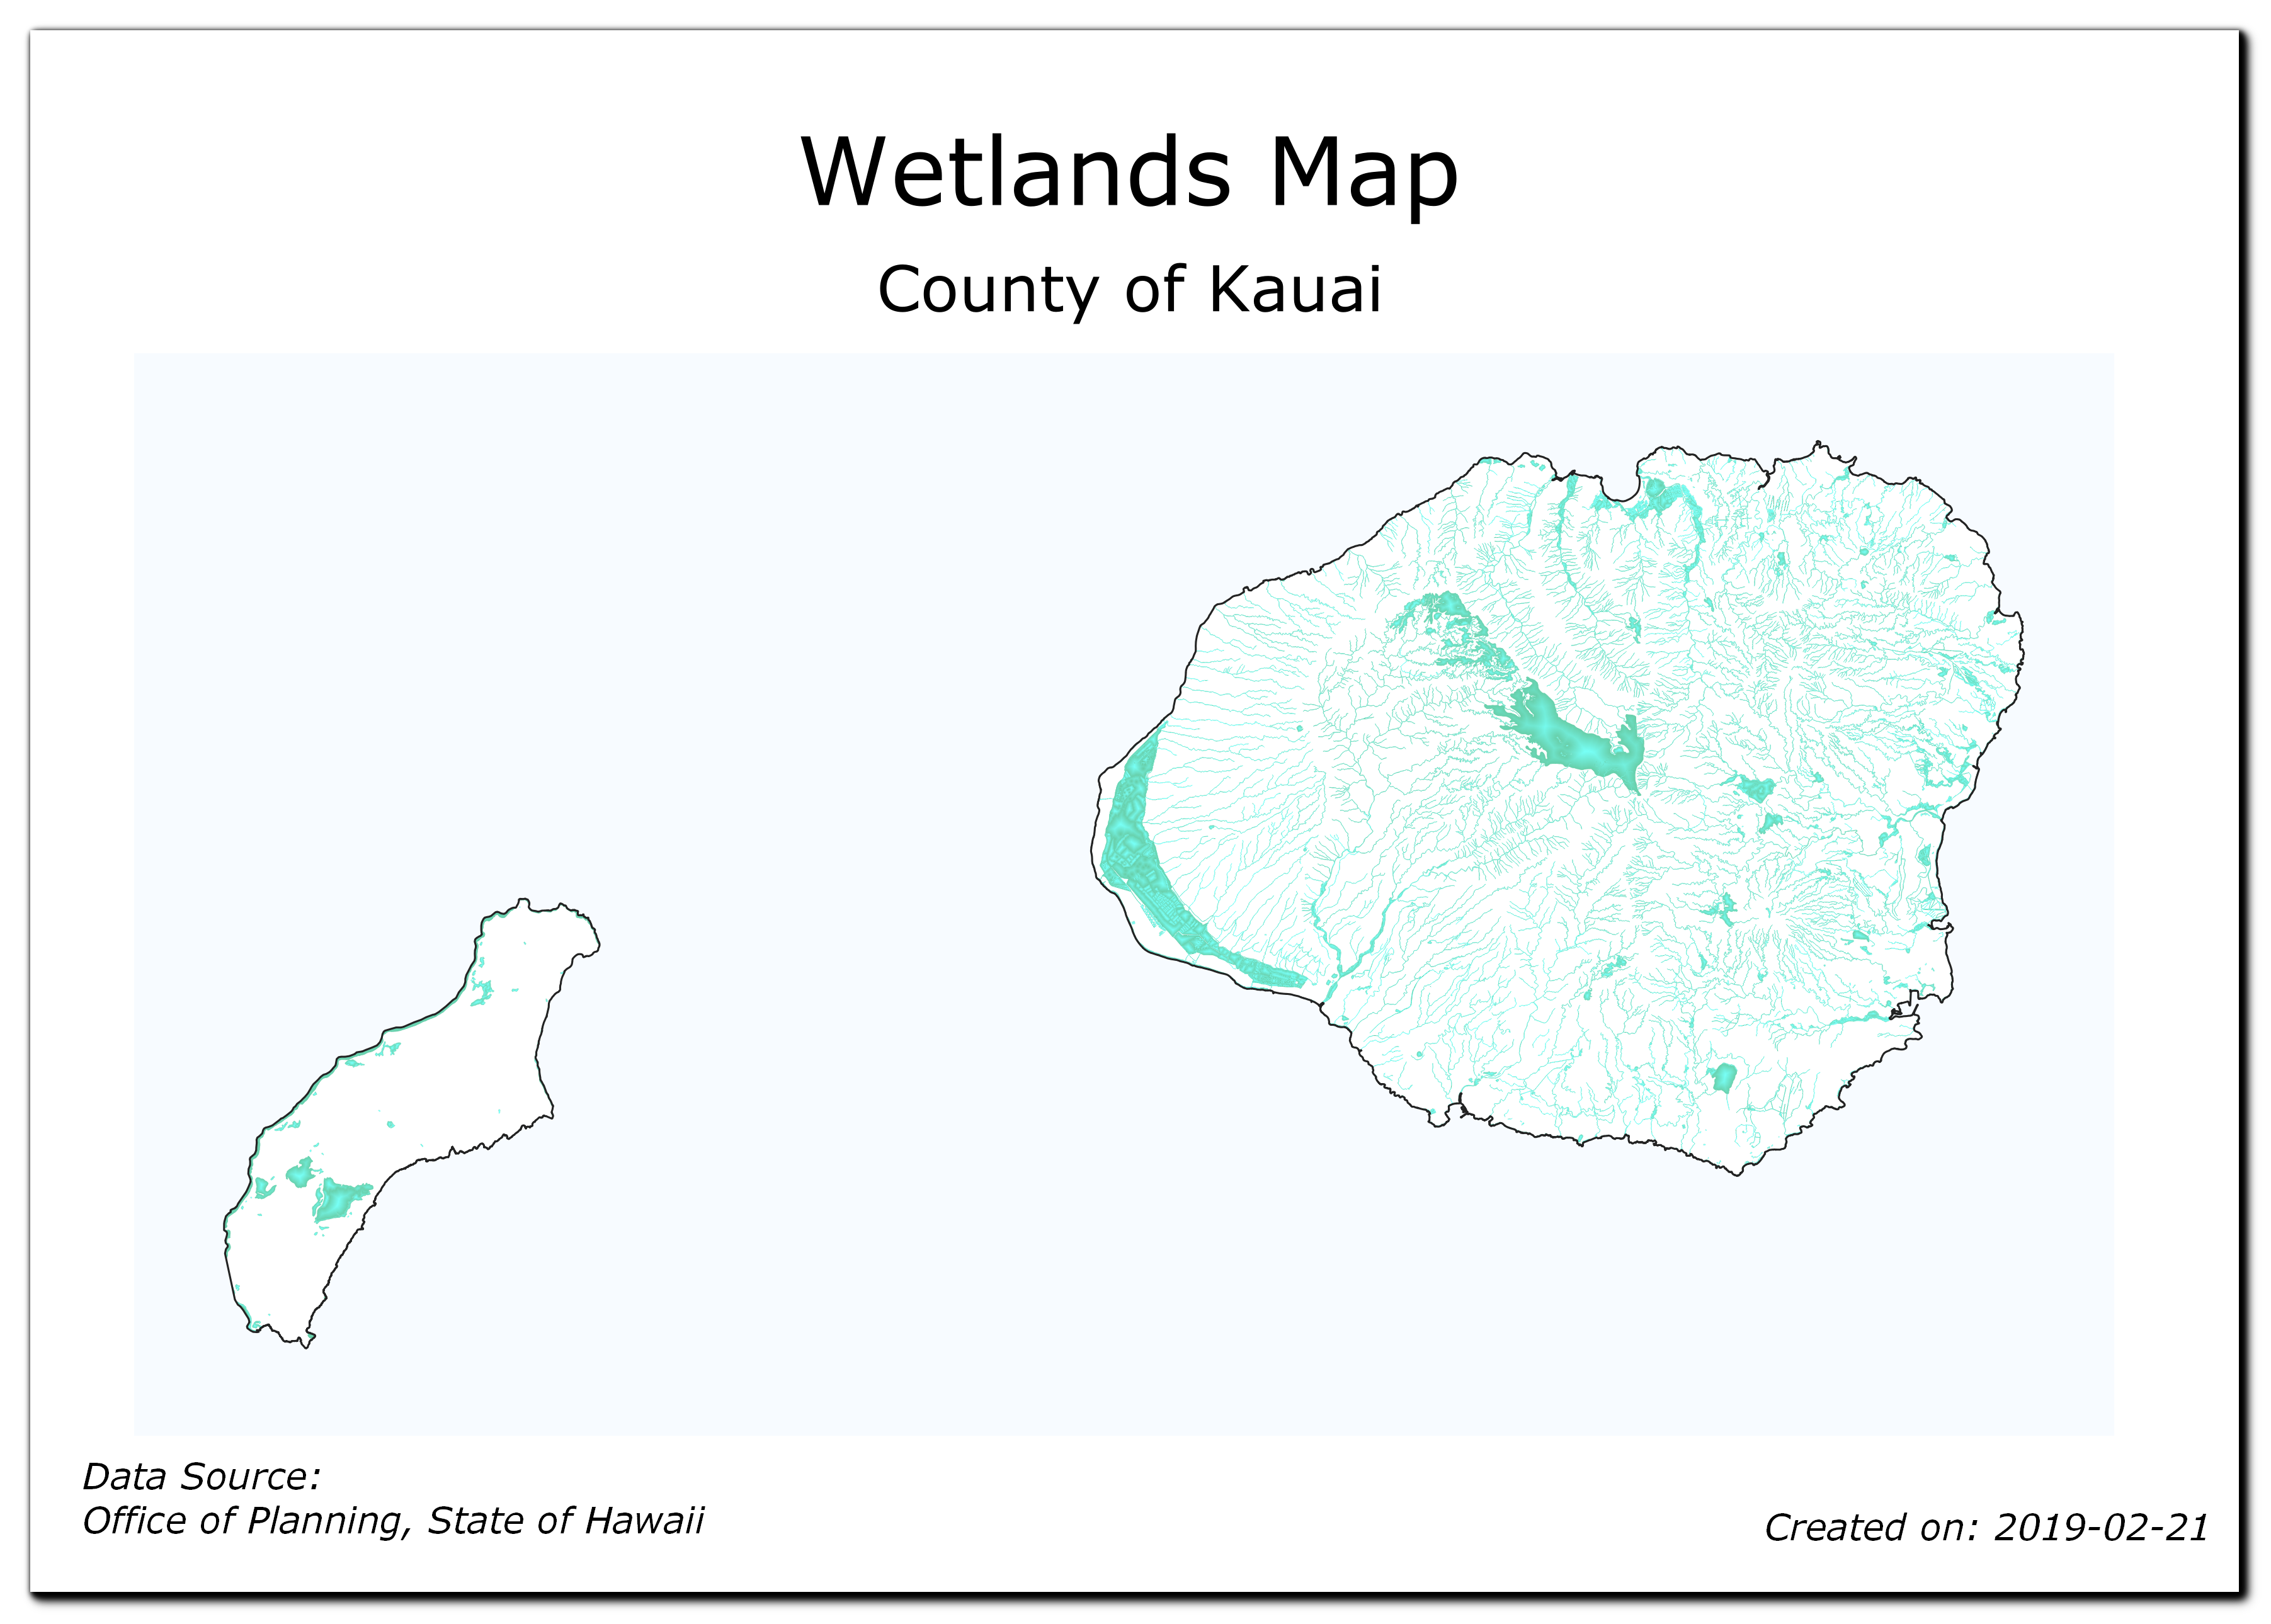
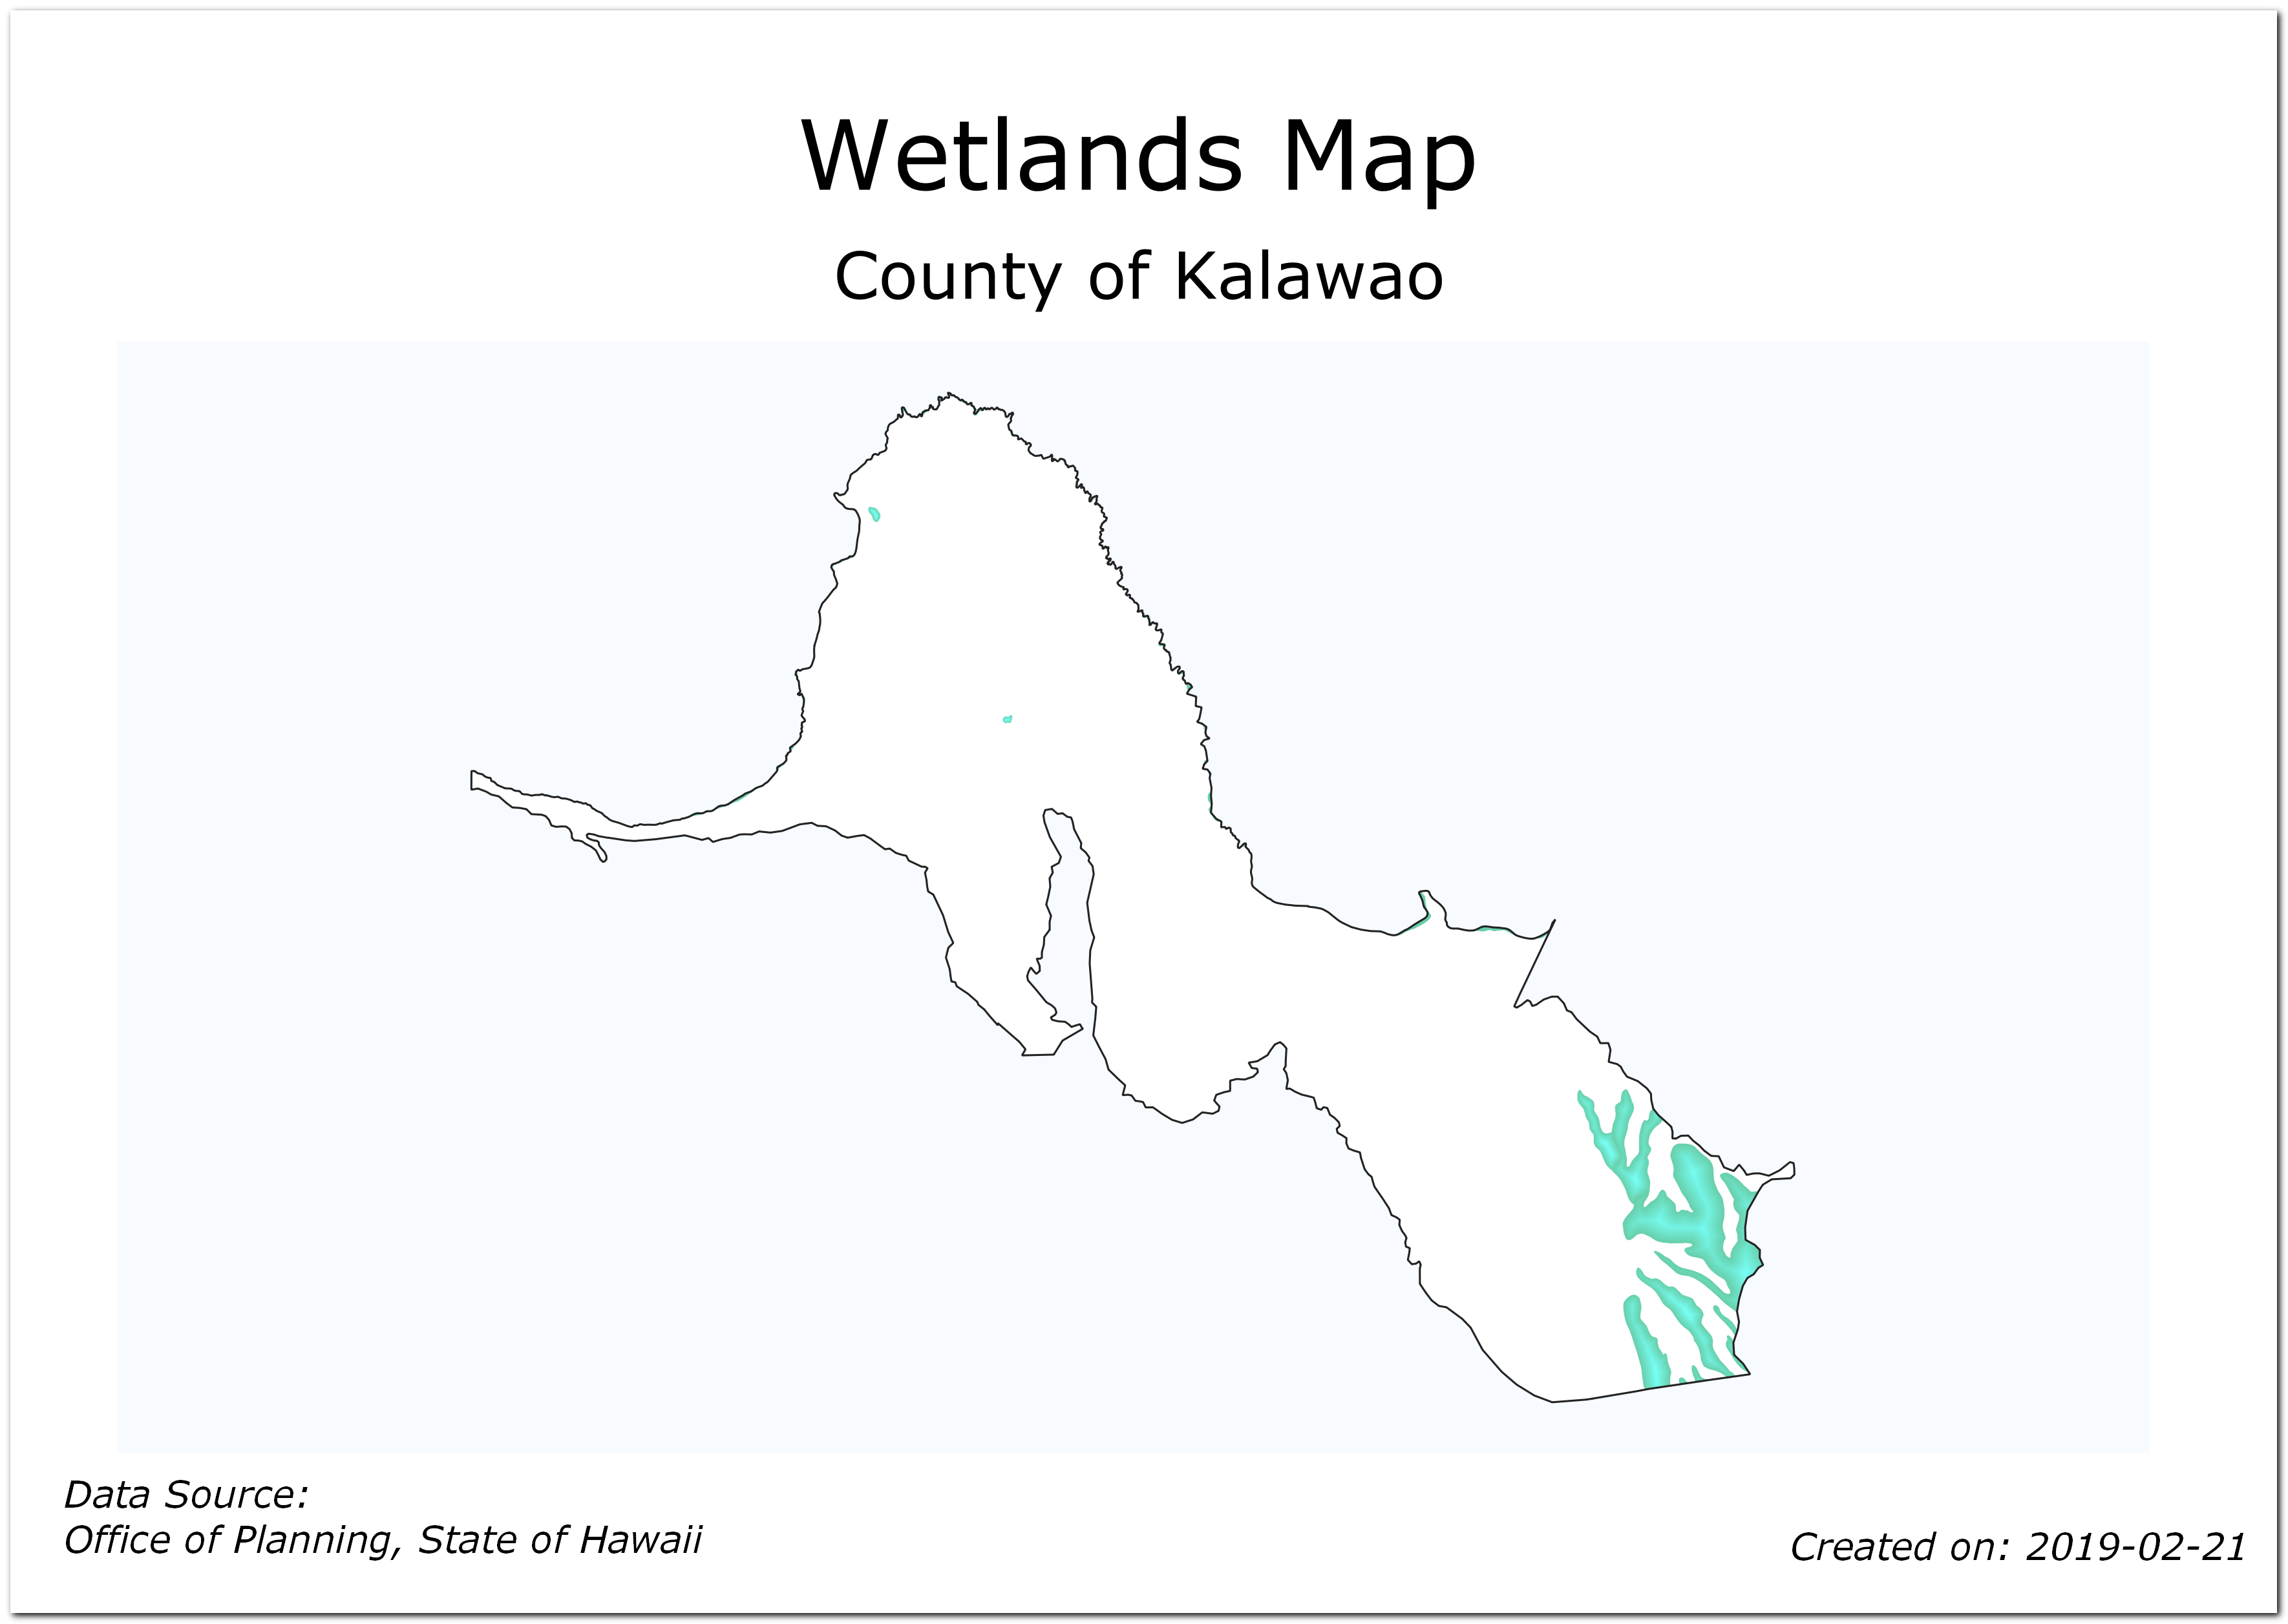
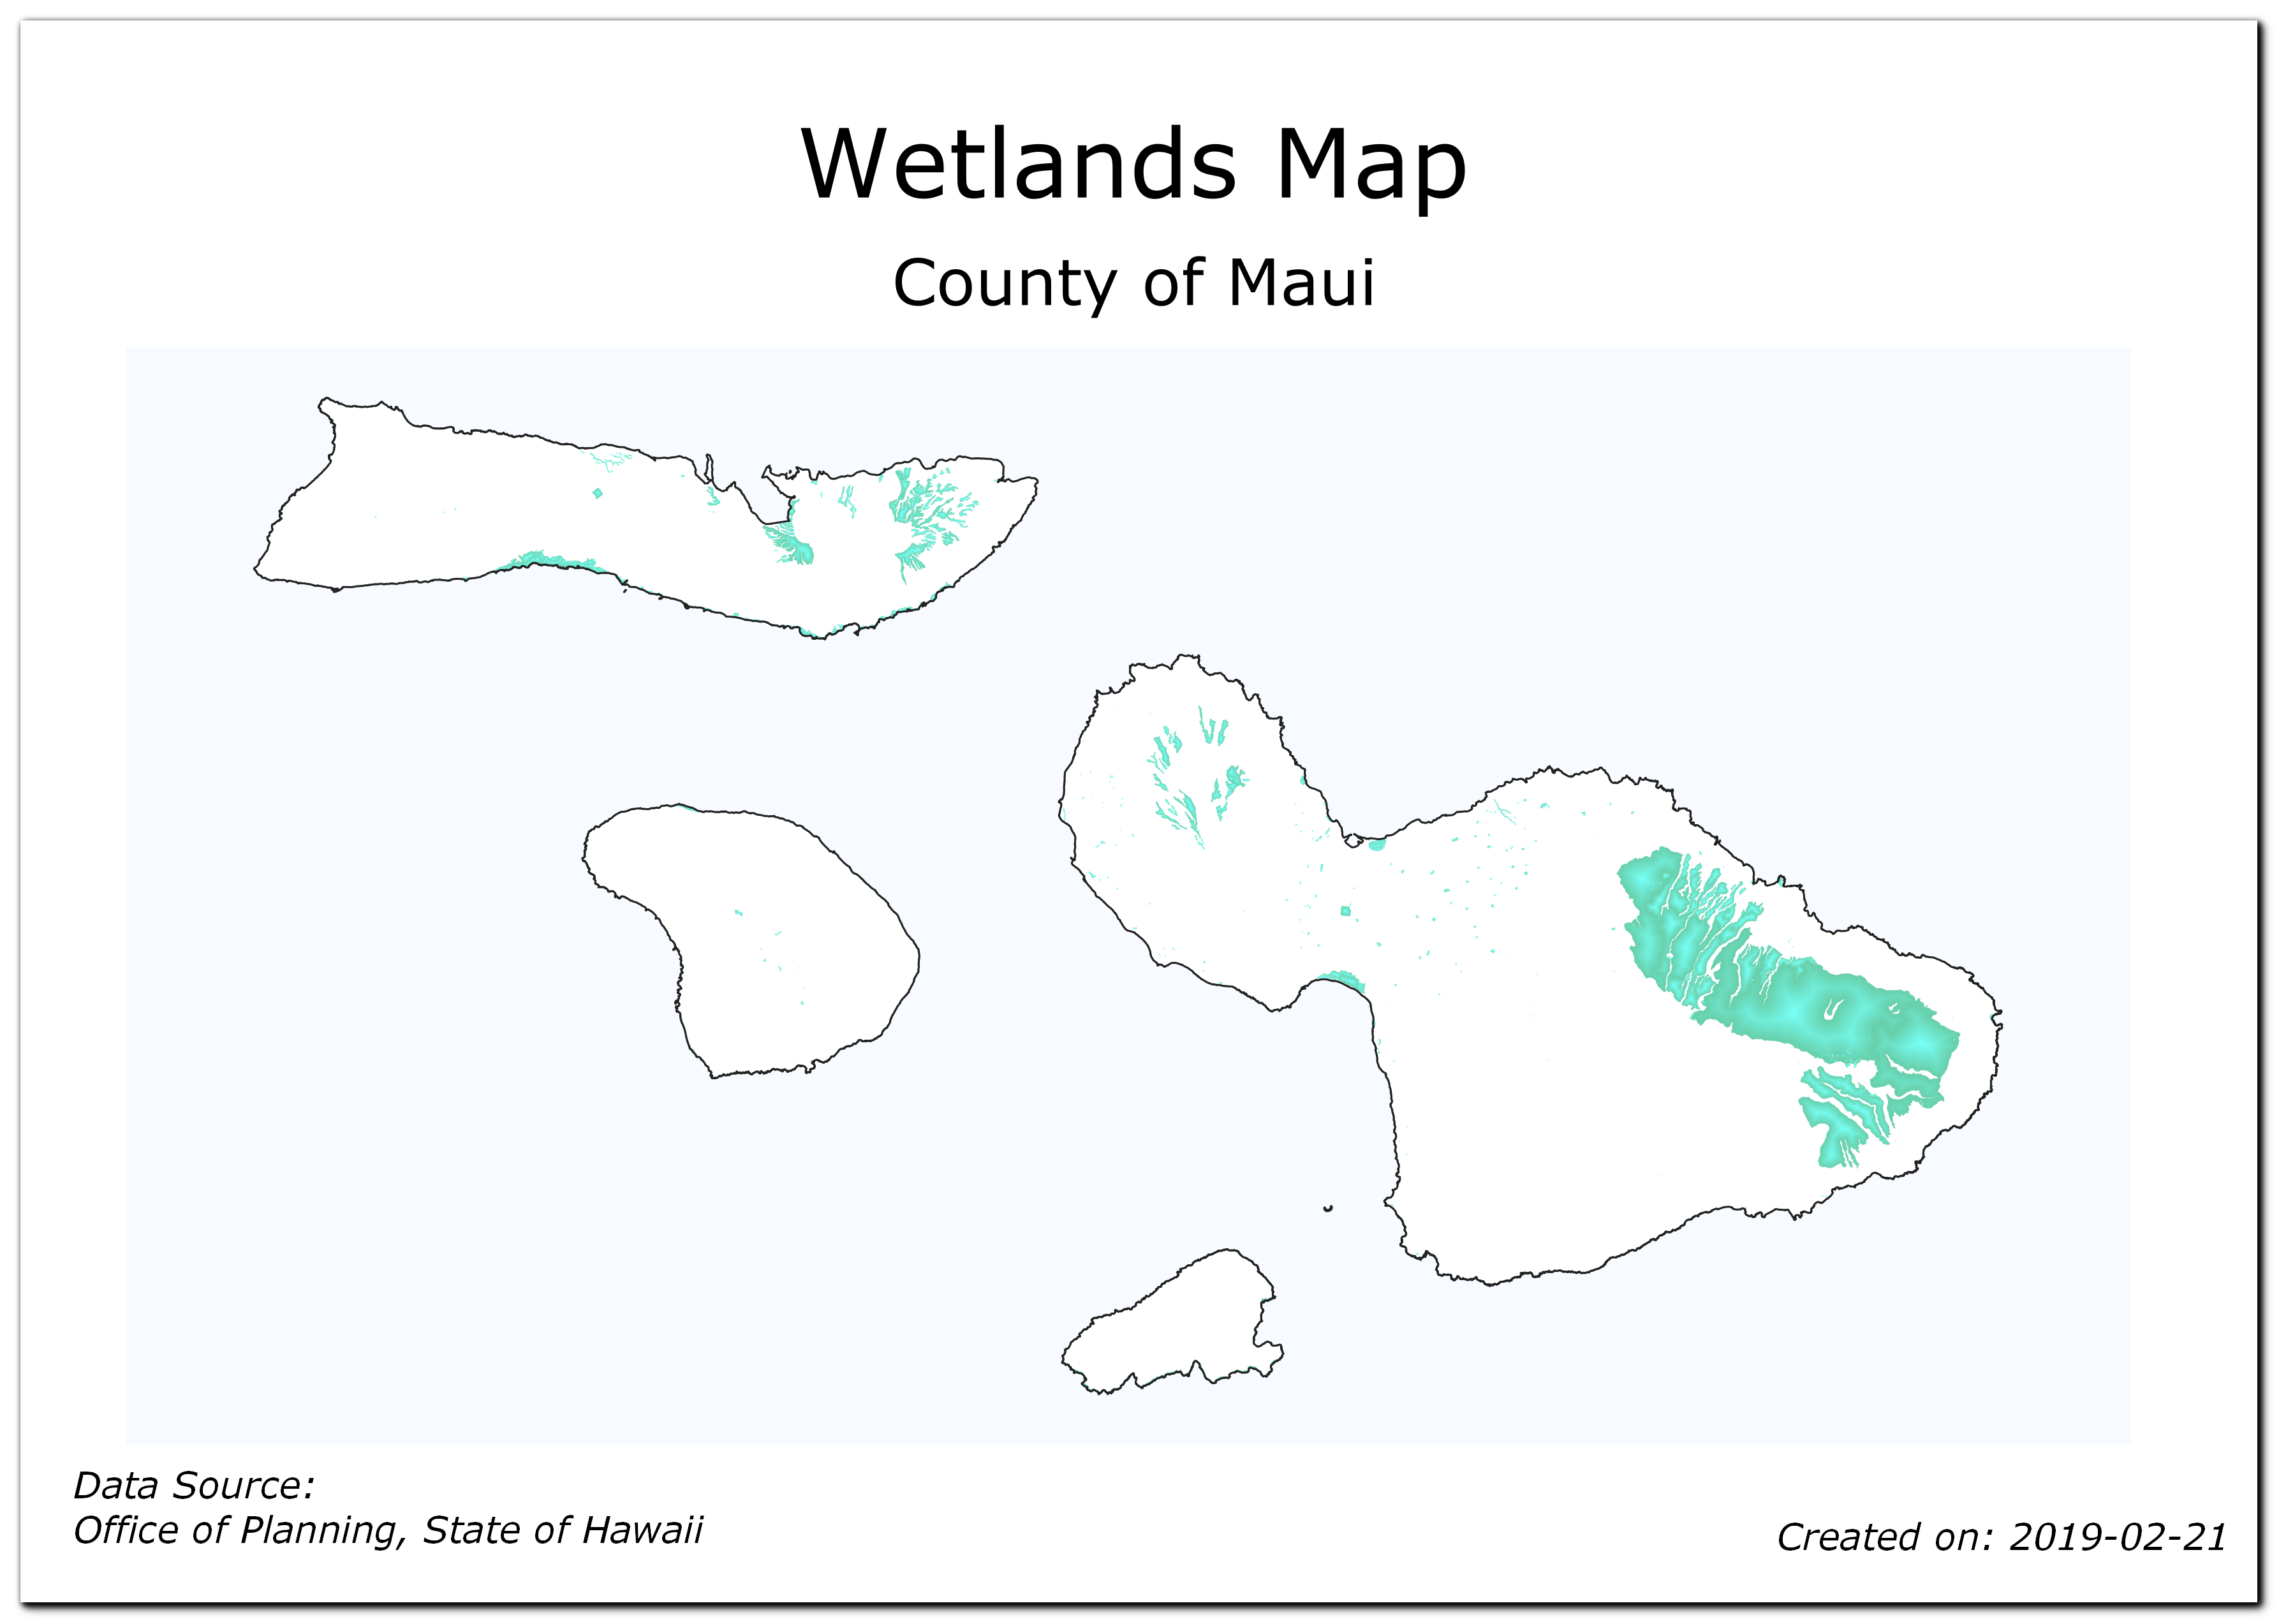
В этом уроке показано, как создать карту водно-болотных угодий для каждого округа в штате Гавайи.
Также вы получите следующие навыки
Использовать стиль
Инвертированные полигоныдля заливки областей за пределами полигонов.Составлять выражения для стилистики, основанной на правилах, для отображения только текущего объекта в Атласе.
Составлять выражения для создания динамических подписей в Компоновщике карт.
Использовать стиль
Разбивка фигурыдля создания двухцветной заливки полигонов.
Получение данных
Мы будем использовать ГИС-данные с сайта Управления по планированию штата Гавайи
Загрузите слой Wetlands из категории Biologic and Ecologic.
Загрузите слой Census County Boundaries 2010 из категории Cultural and Demographic.
Также вы можете напрямую скачать оба набора данных по ссылкам ниже:
Источник данных: [HAWAII]
Порядок действий
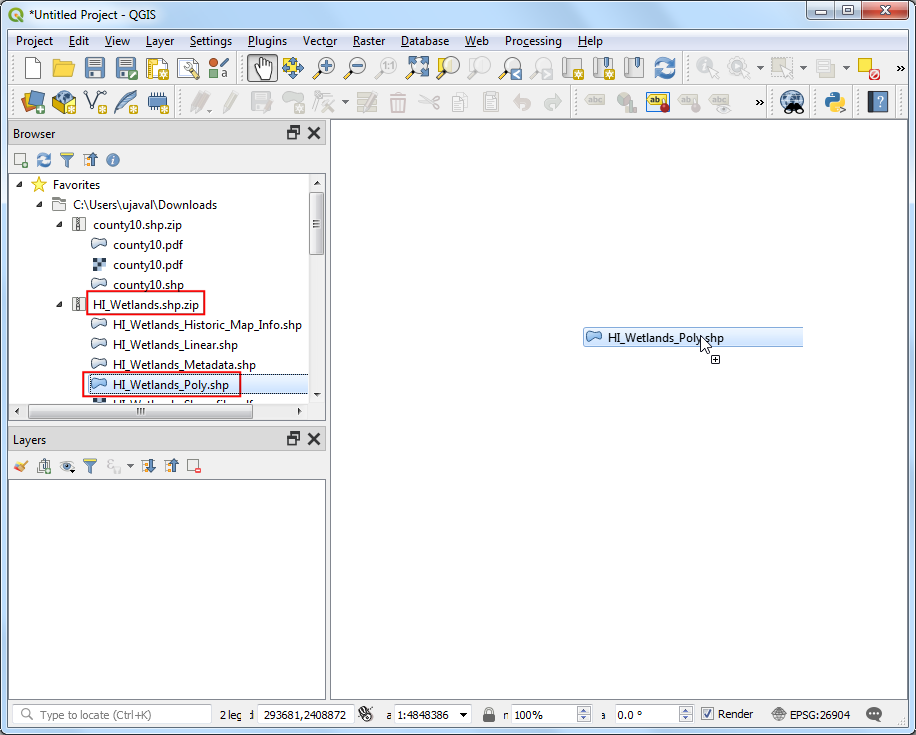
В браузере QGIS найдите архив
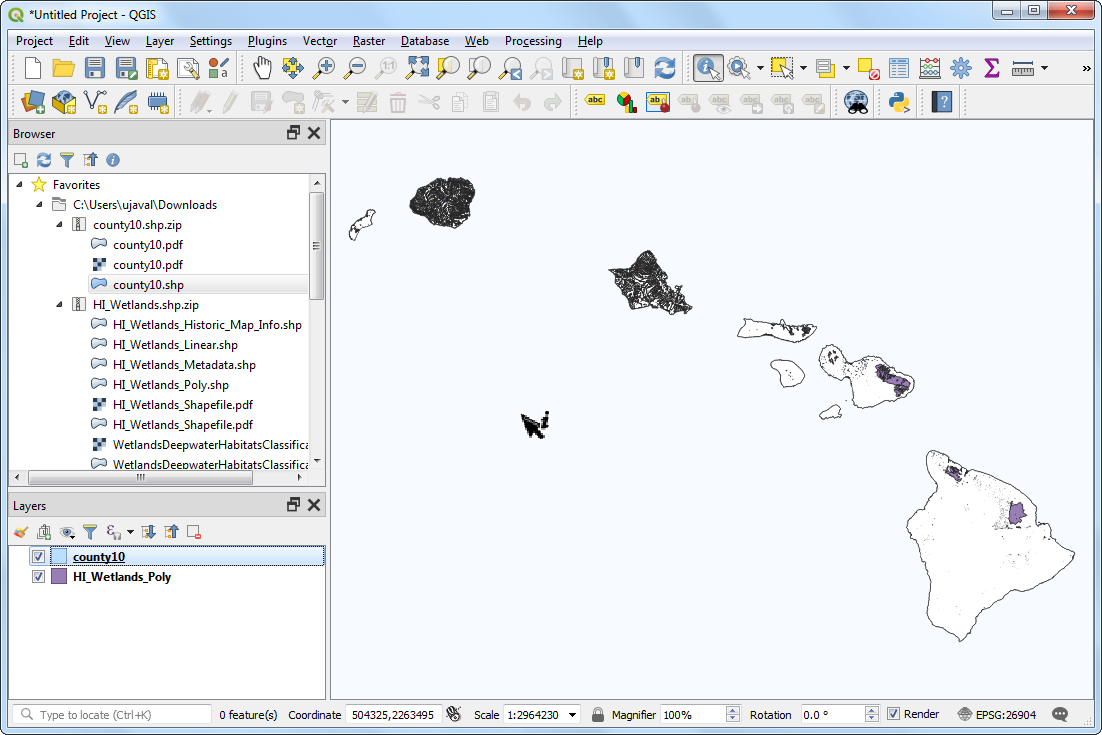
HI_Wetlands.shp.zipи откройте его. Перетащите файлHI_Wetlands_Poly.shpв область карты. Данный слой содержит полигоны водно-болотных угодий штата Гавайи.
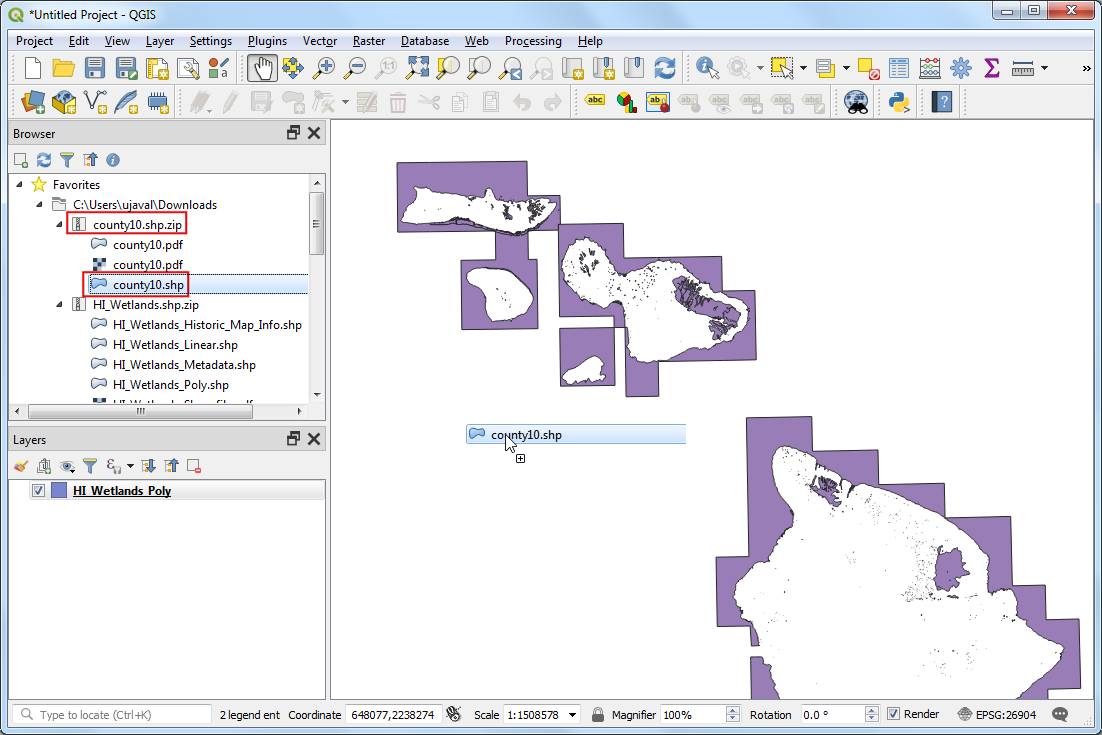
Поскольку мы хотим создать отдельную карту на каждый округ, нам необходим слой с полигонами этих округов. Откройте архив
county10.shp.zip. Выберите файлcounty10.shpи перетащите его в область карты.
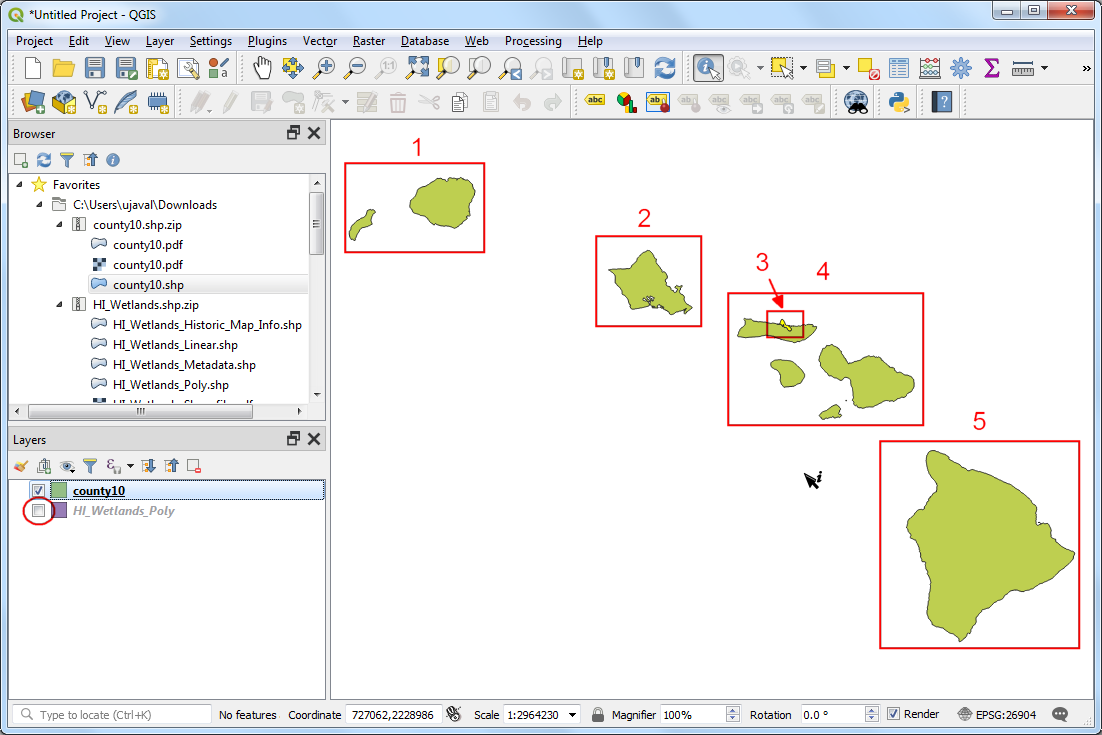
Временно отключите видимость слоя
HI_Wetlands_Poly, чтобы увидеть полигоны слояcounty10. Слой содержит 5 объектов, каждый из которых связан с одним или несколькими полигонами и отражает один из пяти округов. Мы используем этот слой в качестве слоя покрытия, чтобы автоматически создать 5 отдельных карт - по одной для каждого объекта.
Включите видимость слоя
HI_Wetlands_Poly. Откройте .
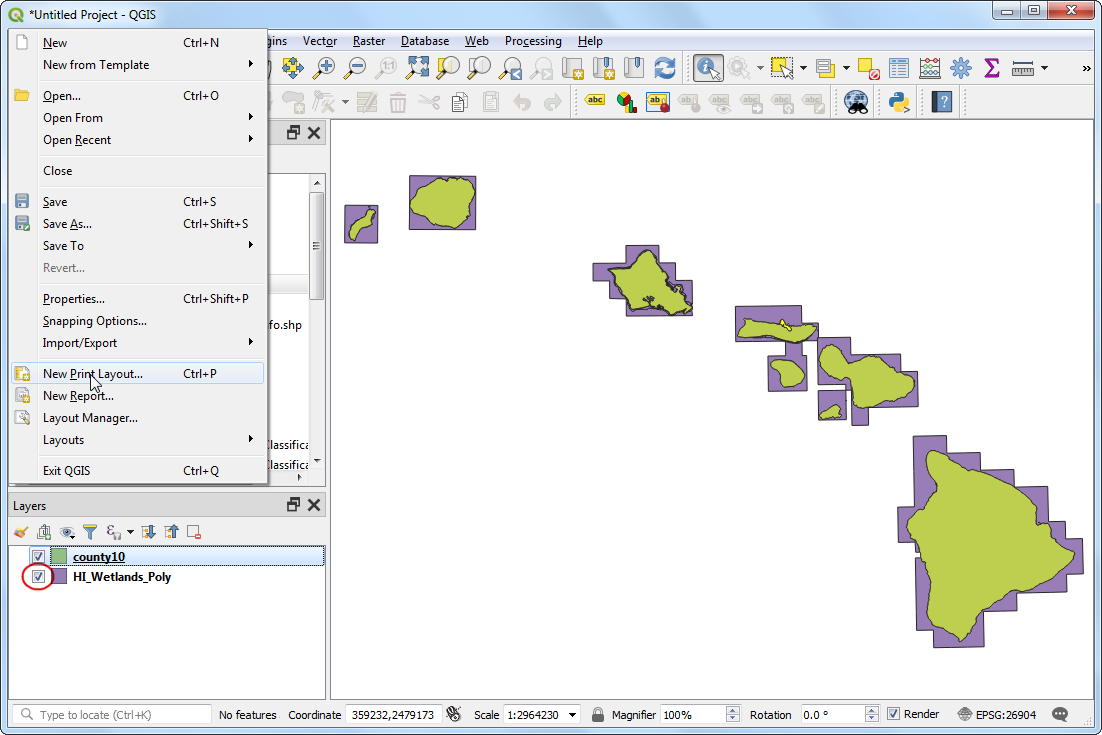
Оставьте пустым название макета и нажмите OK.

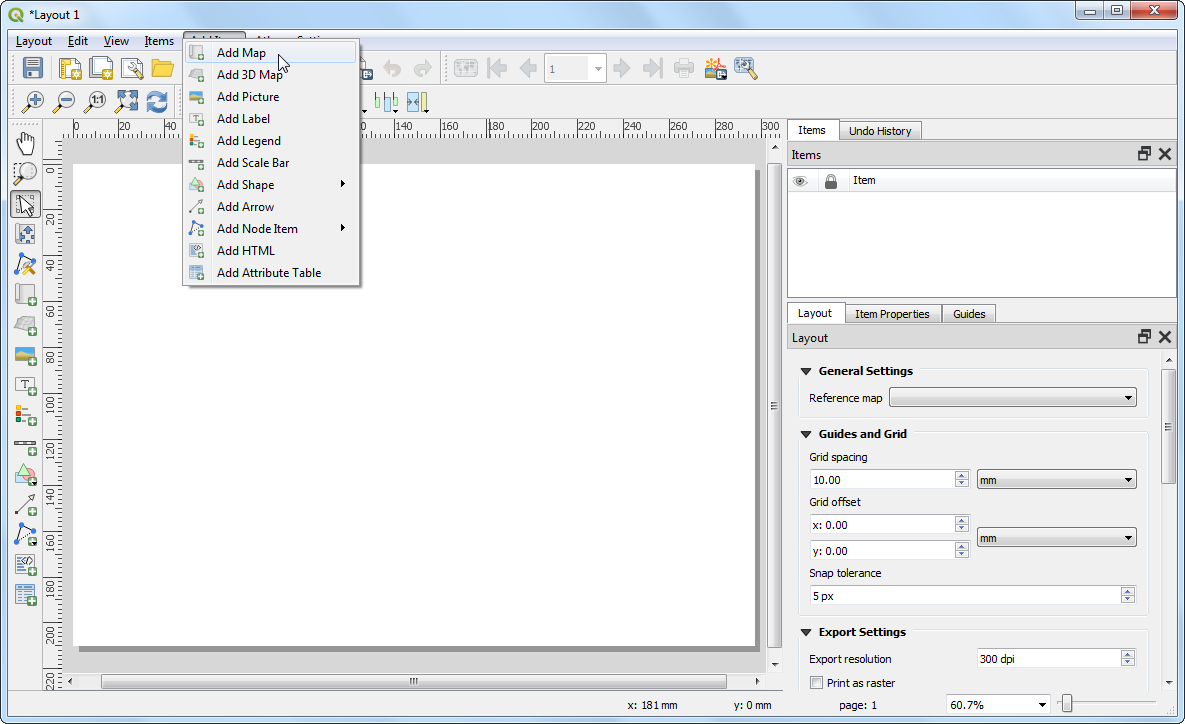
В окне Создание макета выберите .
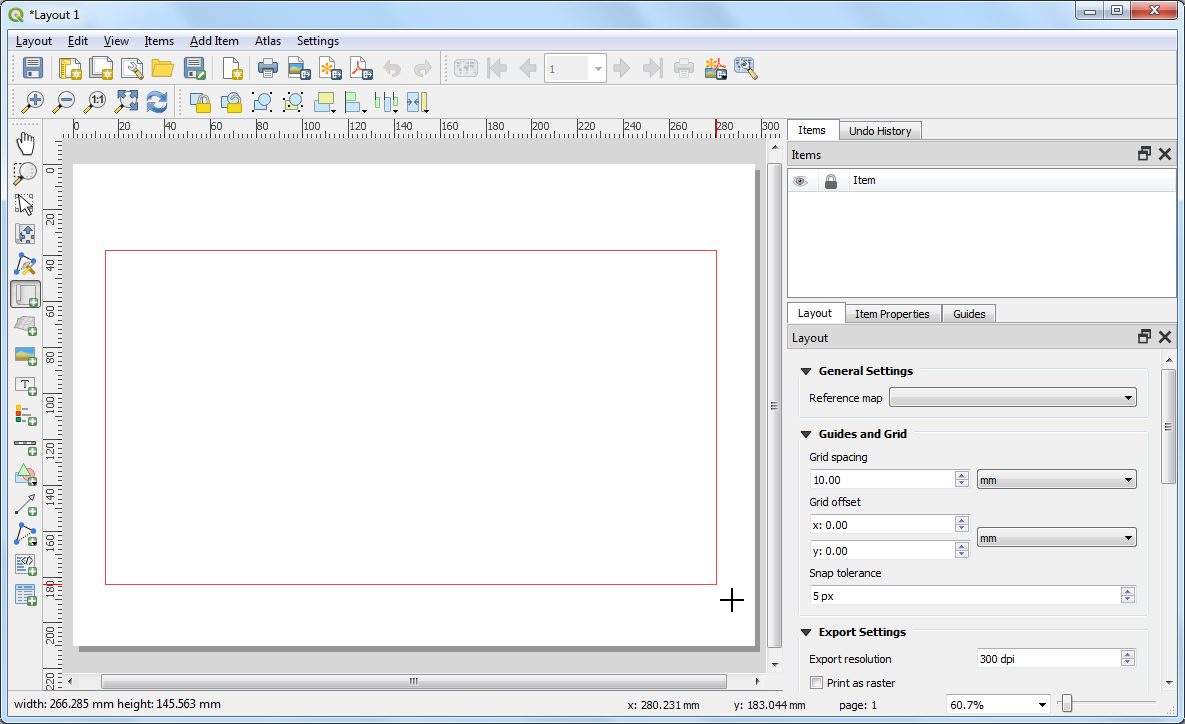
Drag a rectangle while holding the left mouse button where you would like to insert the map.
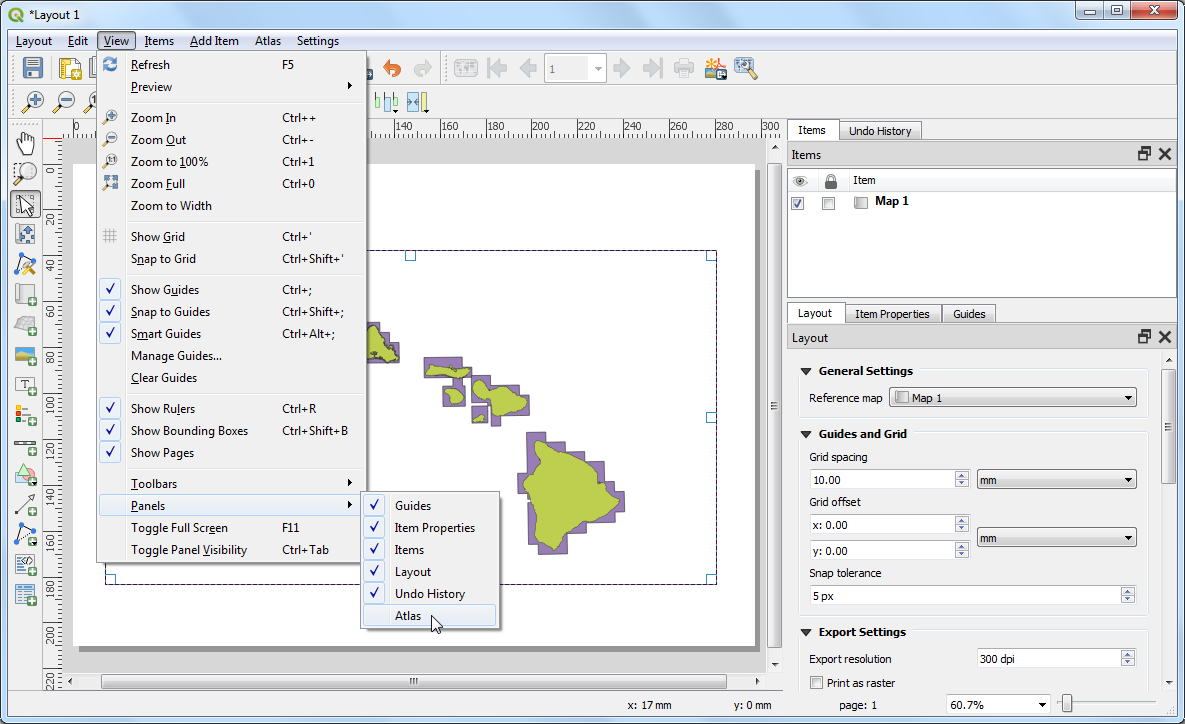
In QGIS3, the Atlas tab is not visible by default. Select .
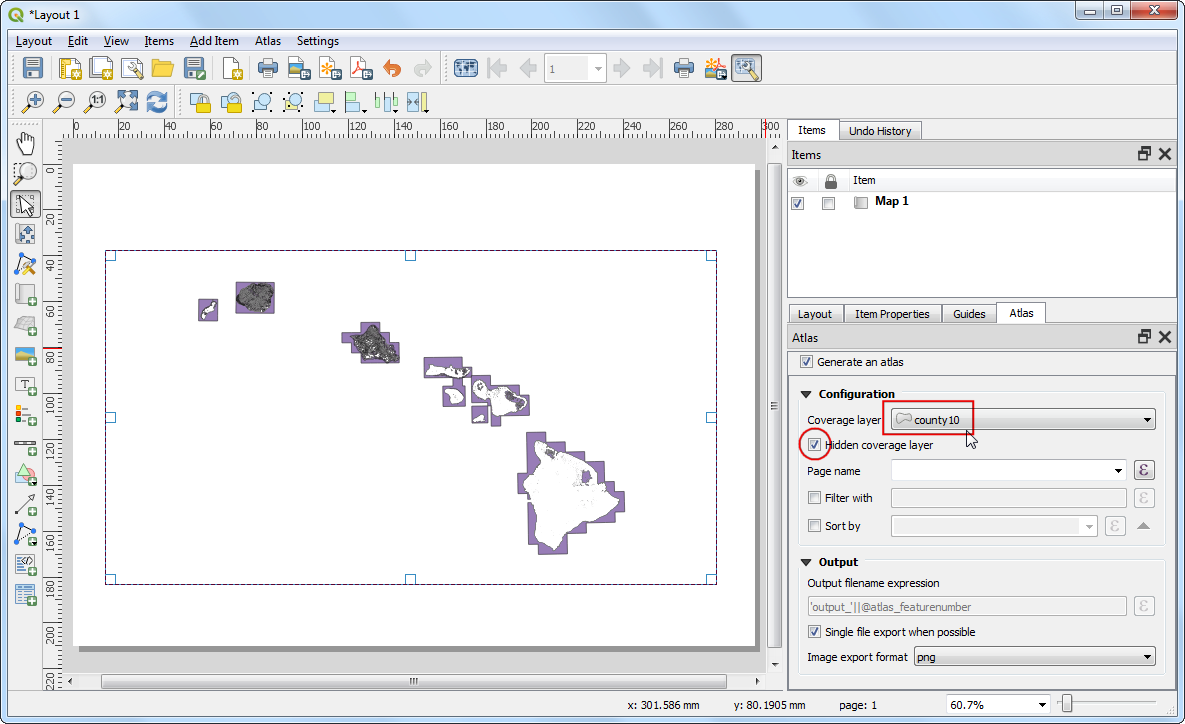
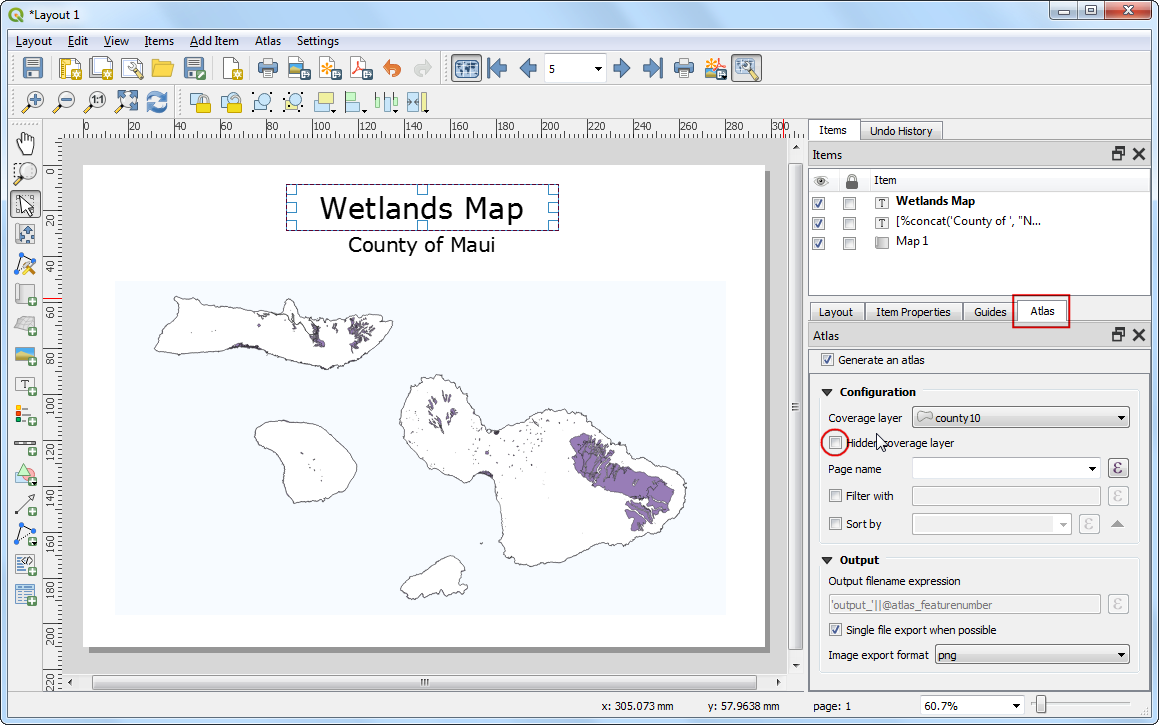
Switch to the Atlas tab. Check the Generate an atlas box.
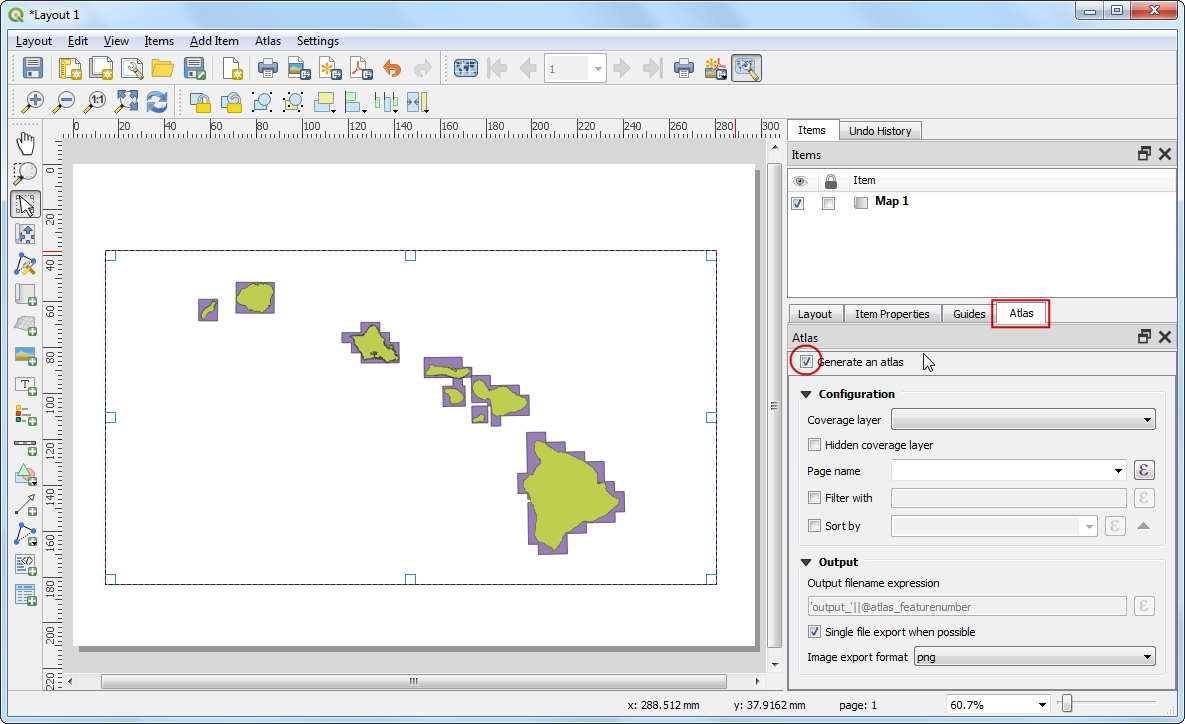
Select the
county10as the Coverage layer. This will indicate that we want to create 1 map each for every polygon feature in thecounty10layer. You can also check the Hidden coverage layer so that the features themselves will not appear on the map.
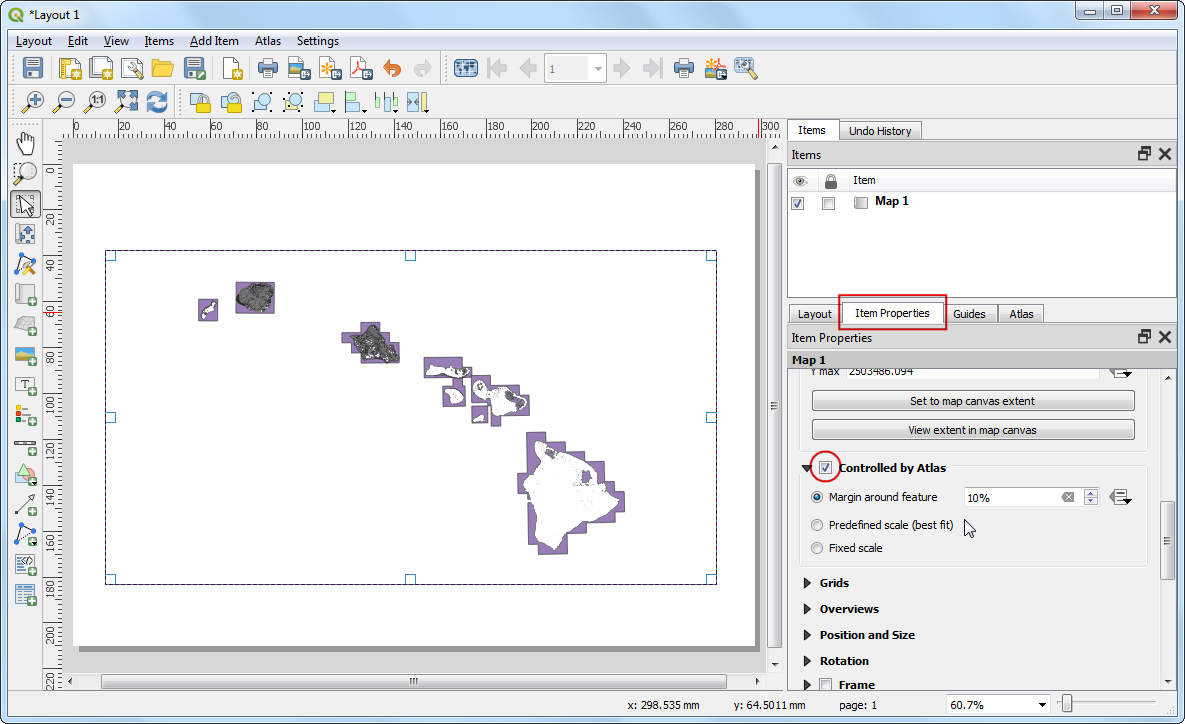
Switch to the Item Properties tab. Scroll down and check the Controlled by atlas box. This will indicate the layout that the content of the map displayed in this item will be determined by the
Atlastool.
Примечание
You must enable the Generare an atlas box in the Atlas tab, otherwise the Controlled by atlas checkbox will be diasbled.
Now that you have configuring the Atlas settings, go to .
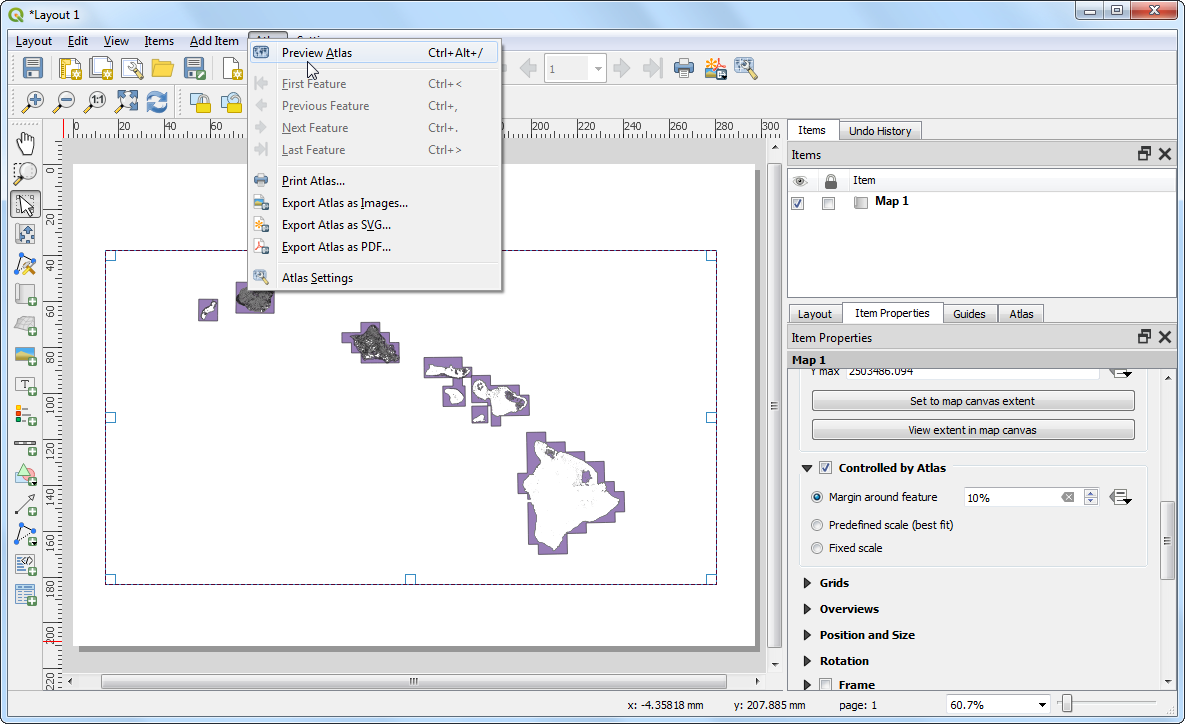
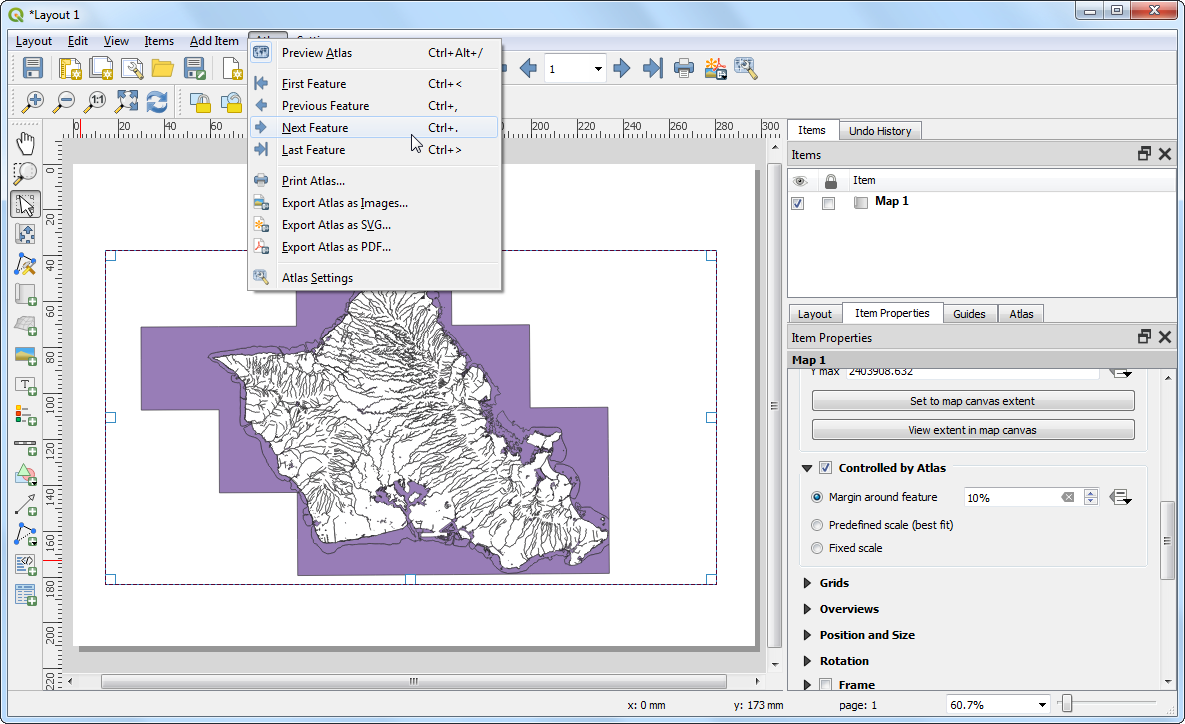
You will see the map refresh and show how individual map will look like. You can preview how the map will look for each of the county polygons. Go to . Atlas will render the map to the extent of the next feature in the coverage layer.
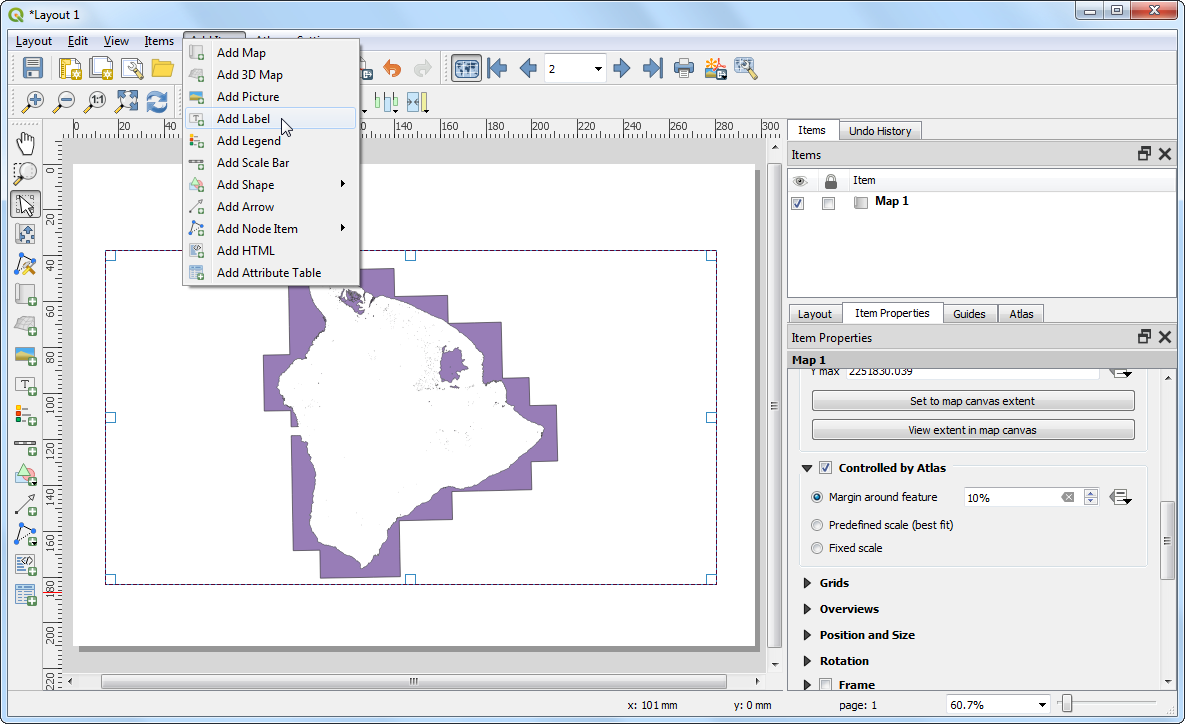
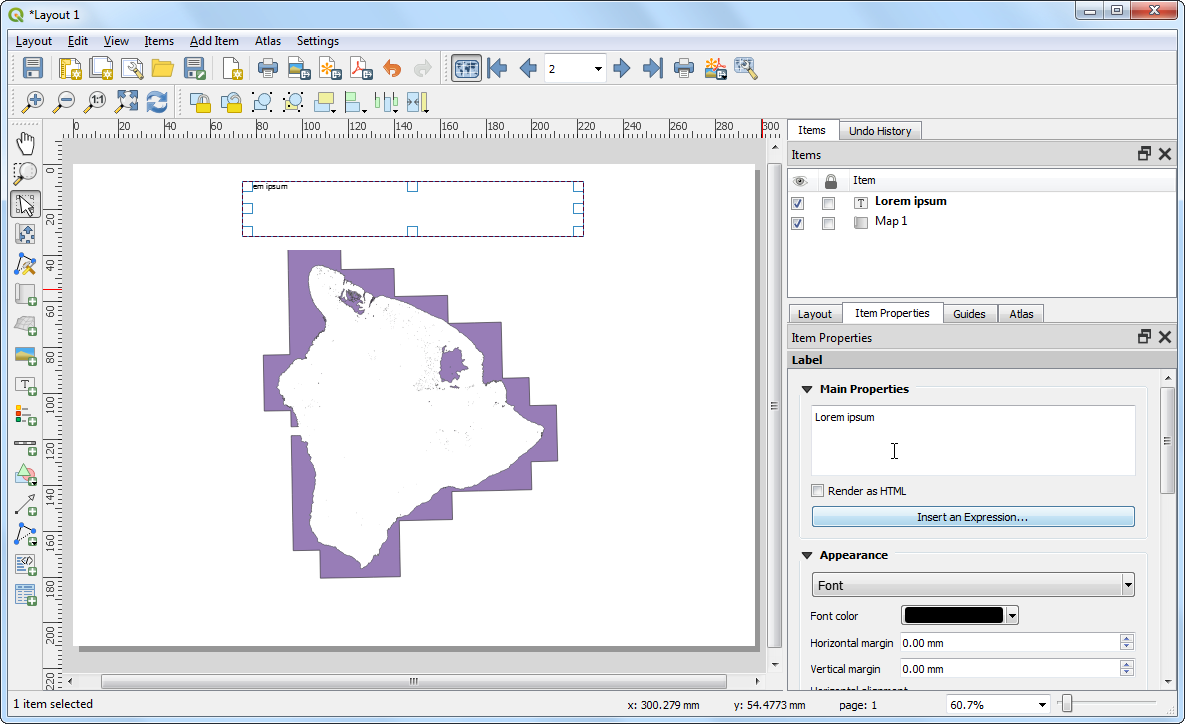
Let’s add a label to the map. Go to .
Under the Item properties tab, locate the Main properties section and click Insert an Expression… button.
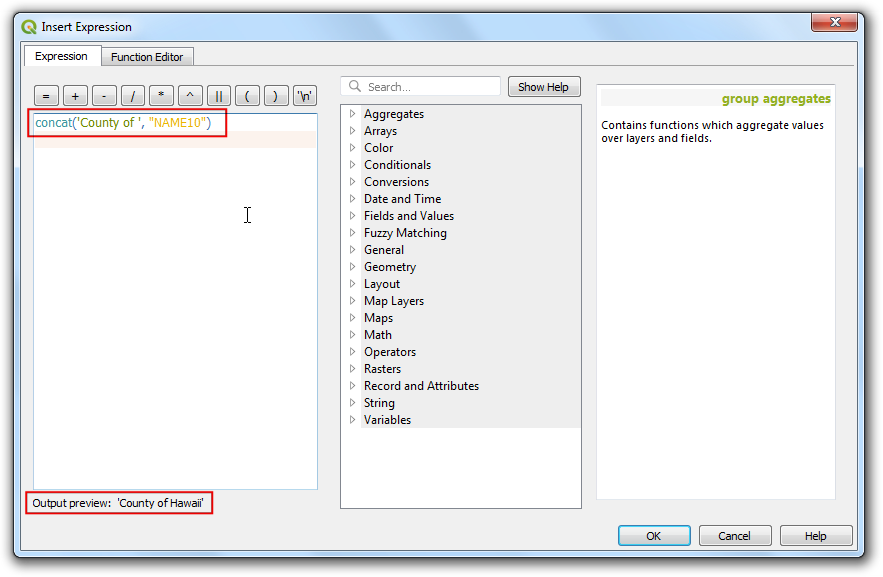
The label of the map can use the attributes from the coverage layer. The
concatfunction is used to join multiple text items into a single text item. In this case we will join the value of theNAME10attribute of thecounty10layer with the textCounty of. Add an expression like below and click OK.
concat('County of ', "NAME10")
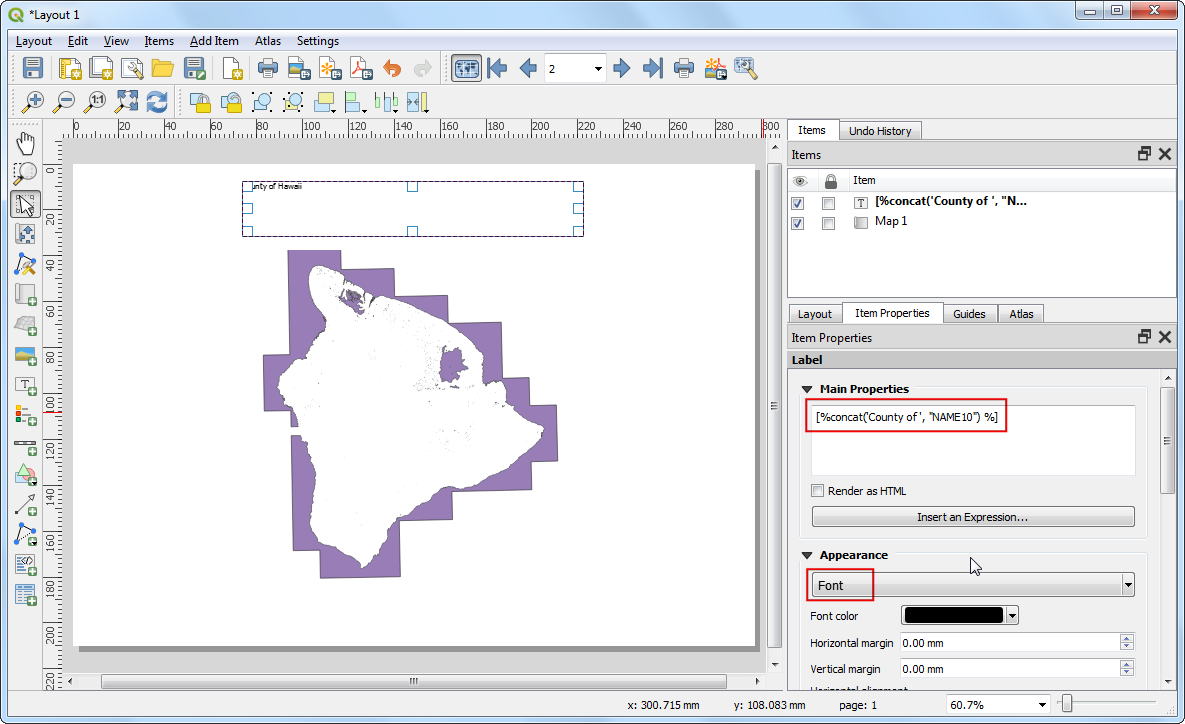
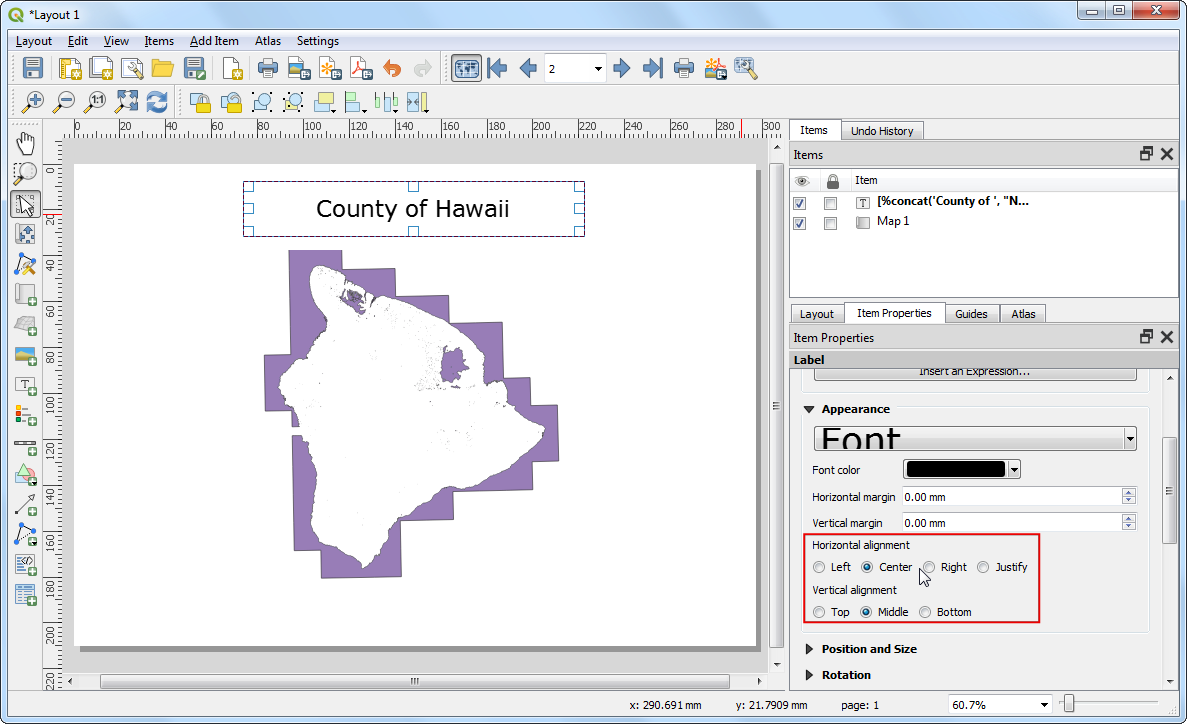
Delete the leading Lorem ipsum placeholder text so that the textbox contains only the expression. Scroll down to the Appearance section and click on the Font dropdown. Choose the font and adjust the size to your liking.
Choose
Centeras the Horizontal alignment andMiddleas the Vertical alignment option.
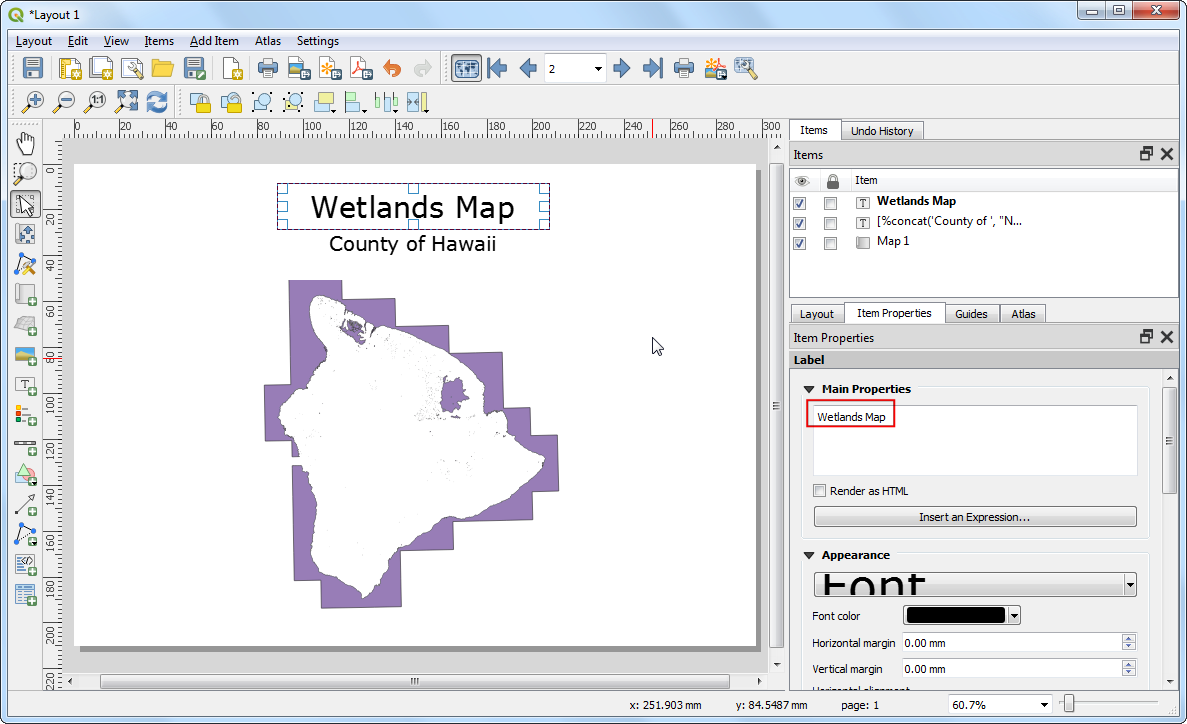
Add another label and enter
Wetlands Mapunder the Main properties. Since there is no expression here, this text will remain the same on all maps.
Go to and verify that the map labels do work as intended. You will notice that the wetland map has polygons extending out in the ocean that looks ugly. We can change the style to that areas outside the county boundaries are hidden.
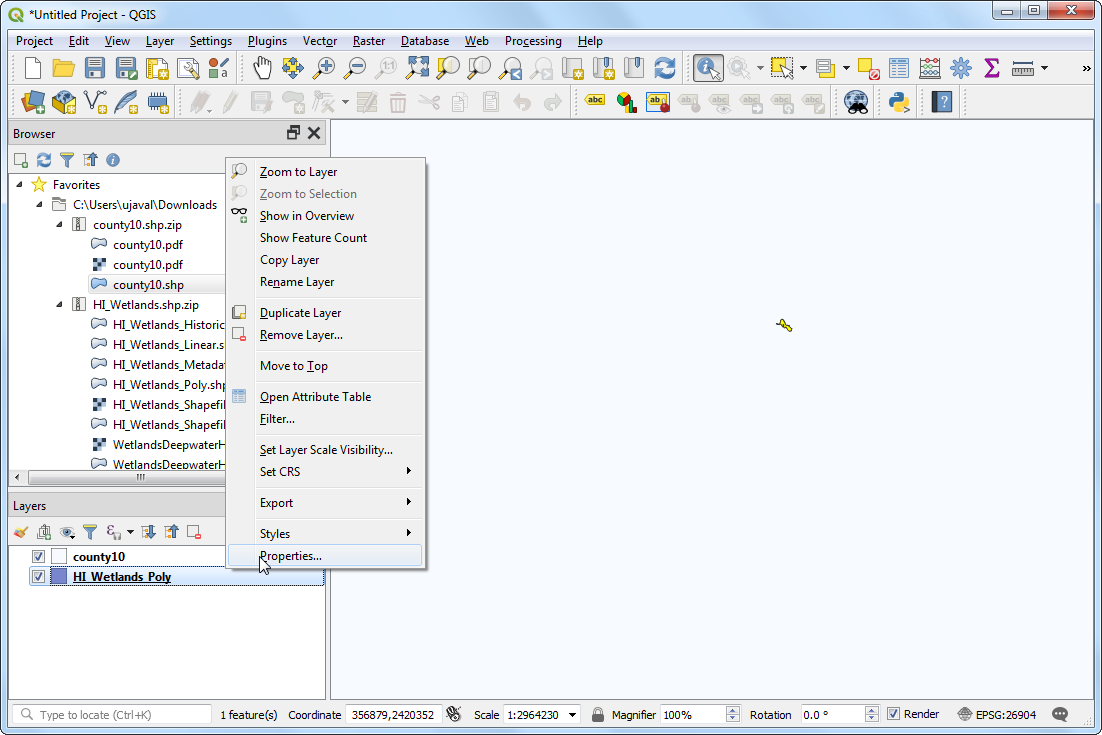
Switch to the main QGIS window. Right-click the
county10layer and select Properties.
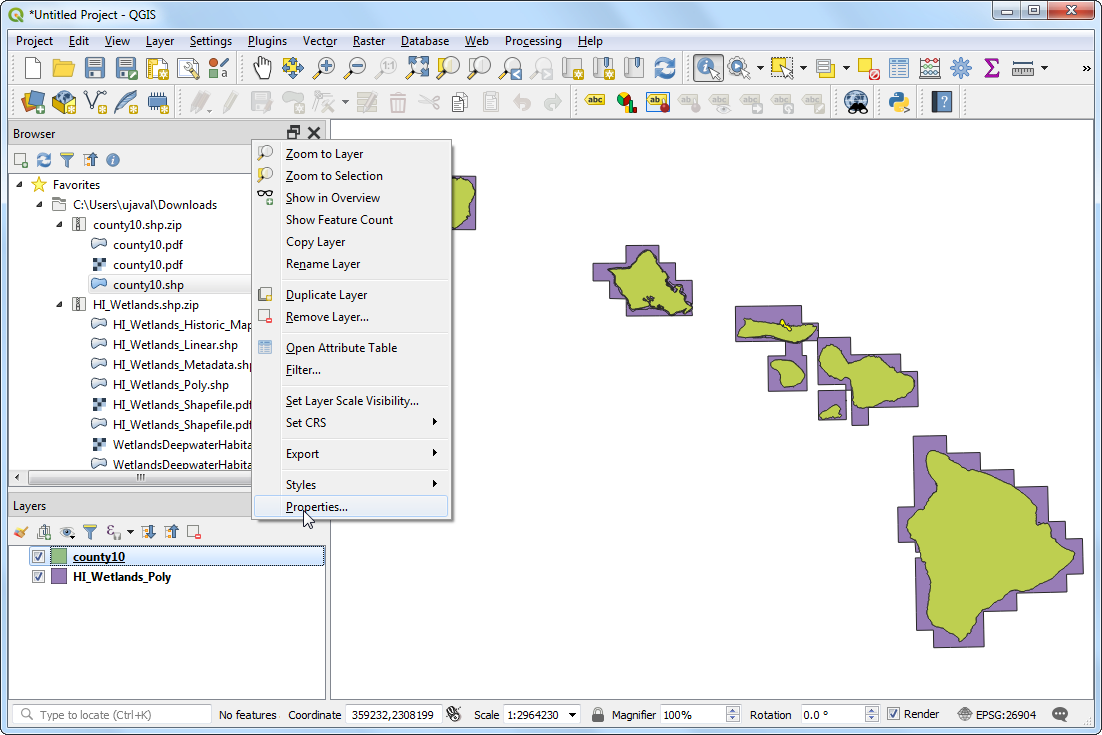
In the Symbology tab, select the Inverted polygons renderer. This renderer styles the outside of the polygon - not inside. Select white as the fill color and click OK.
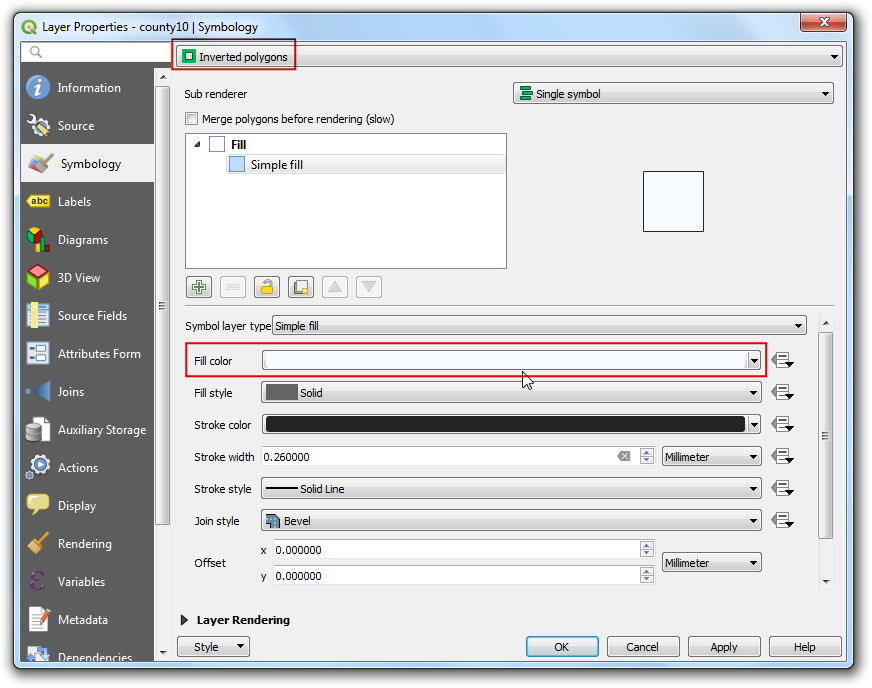
You will notice that the polygons extending outside of the county boundaries are now disappeared. In reality, they are hidden by the white color fill extending out from the county polygons because of the Inverted polygons style.
Switch to the Layout window. If we want the effect of the inverted polygons to show, we need to uncheck the Hidden coverage layer box under Atlas tab. Once unchecked, the rendered image will appear clean and areas outside the coverage polygon is not visible.
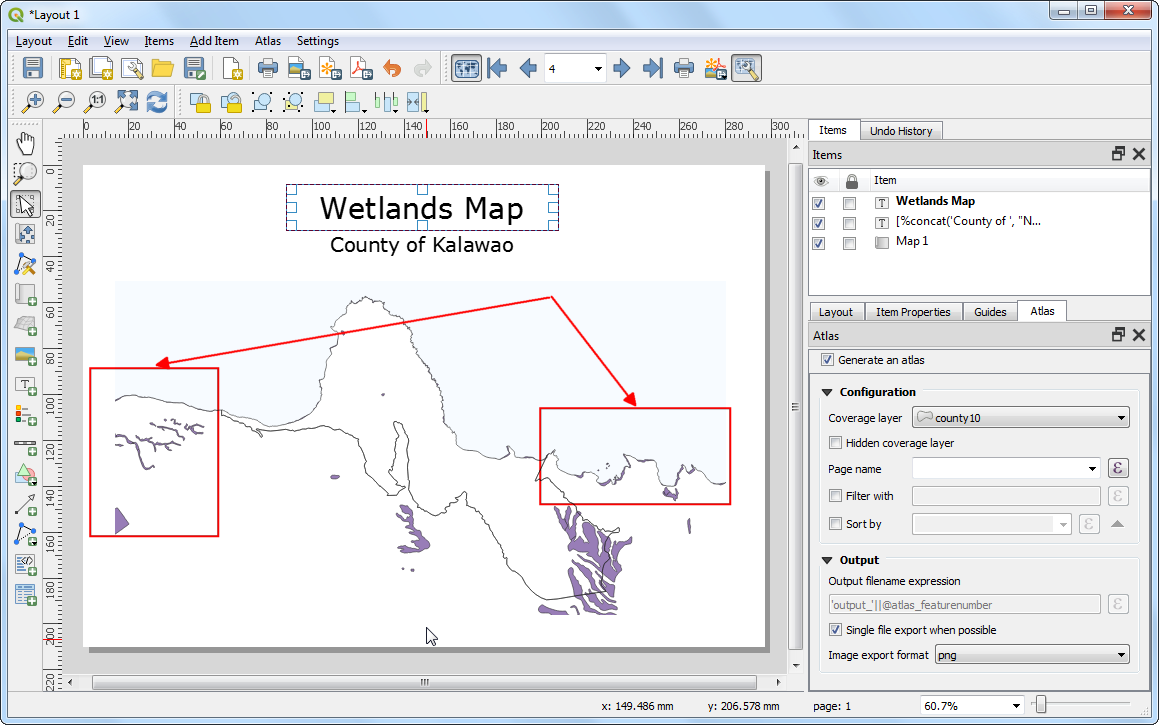
There is one more problem though. You will notice that in some cases, parts of the map that are outside the coverage layer boundary are still visible. This is because Atlas doesn’t automatically hide other features. This can be useful in some cases, but for our purpose, we only want to show wetlands of the county whose map is being generated. To fix this, switch back to the main QGIS window and right-click the
county10layer and select Properties.
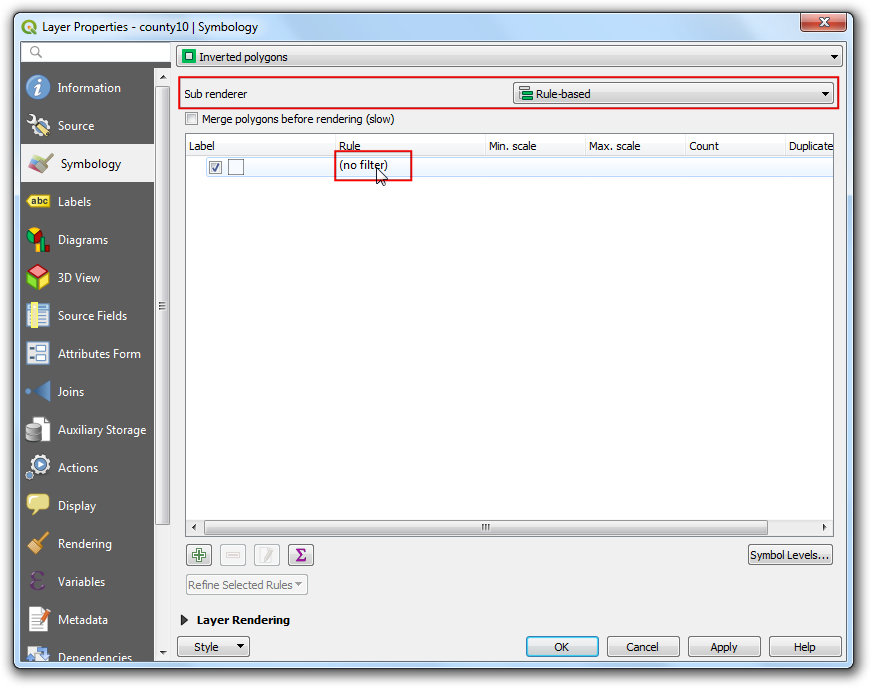
In the Symbology tab, select
Rule-basedas the Sub renderer. Double-click the area under Rule.
In the Edit rule dialog, click the Expression button next to Filter.
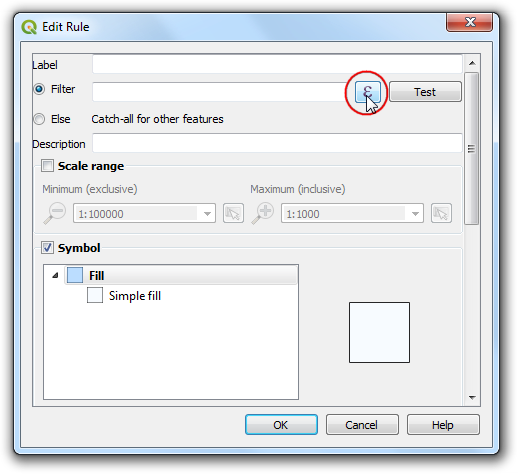
In the Expression string builder, expand the Variables group of functions. The
@atlas_featureidvariable stores the id of the the currently selected feature. We will construct an expression that will select only the currently selected Atlas feature. Enter the expression as below and click OK.
$id = @atlas_featureid

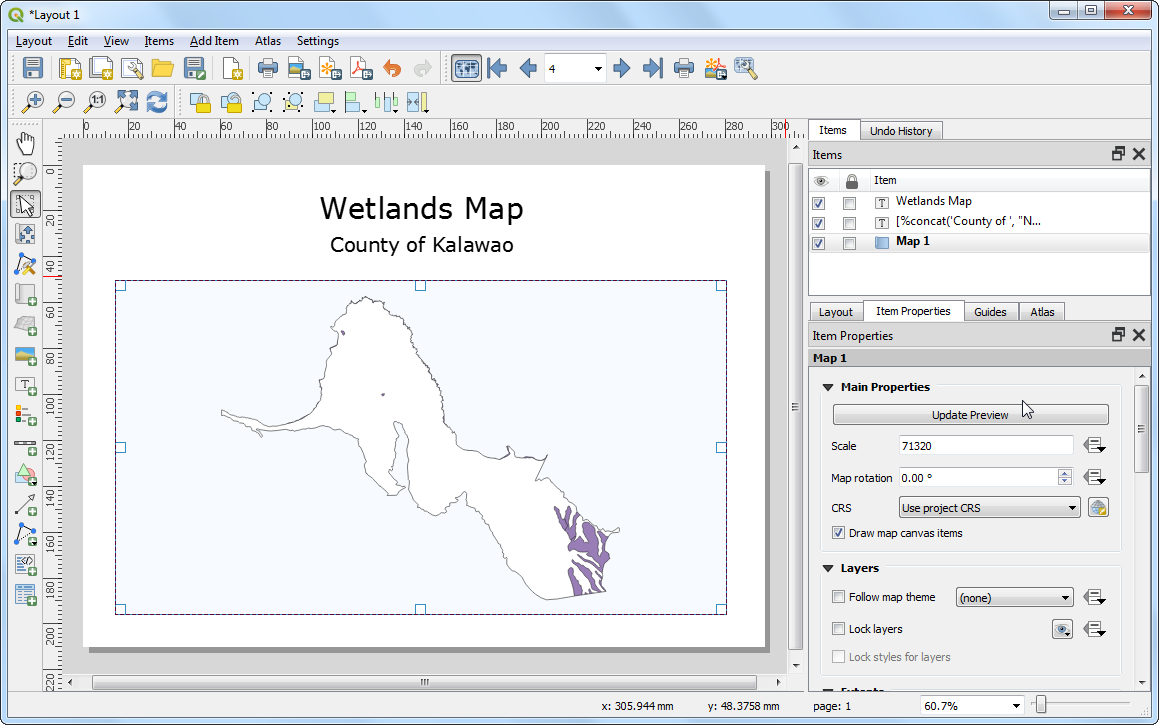
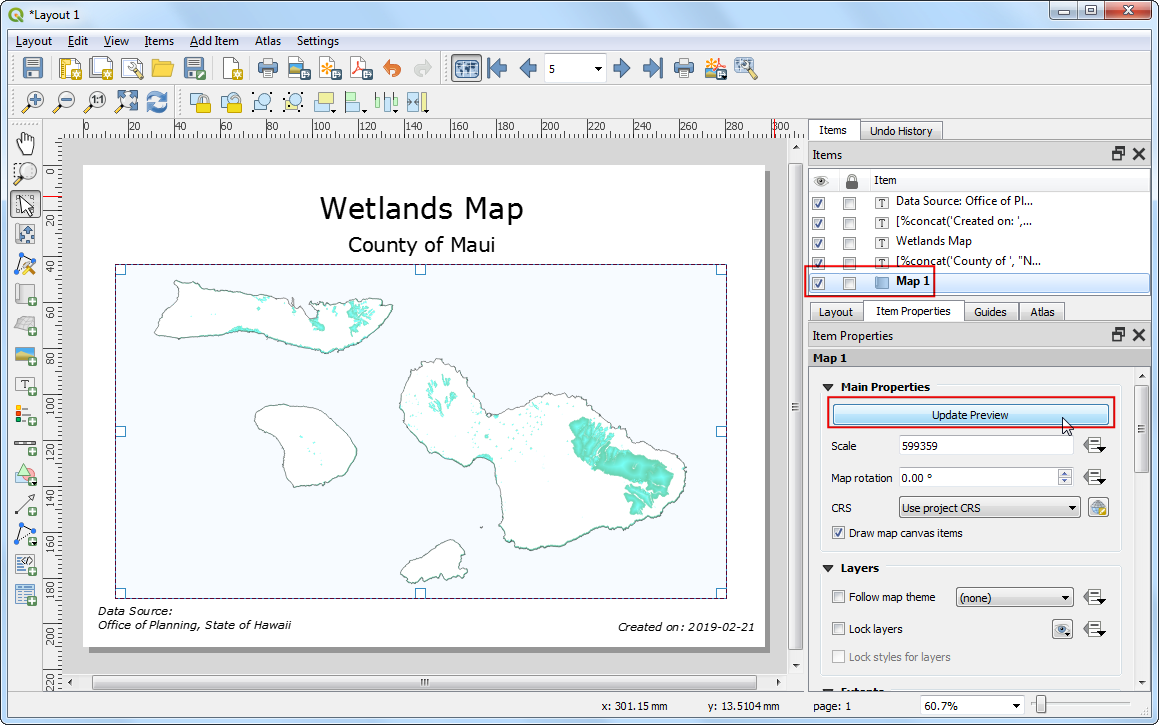
Close all intermediate dialogs and switch back to the Layout window. Select Map 1 item and click the Update preview button under Item properties tab to see the changes. Notice that now only the area covering the county boundary is shown.
Примечание
If you do not see the Update preview button, it may help to select another Item element first and then select Map 1 again.
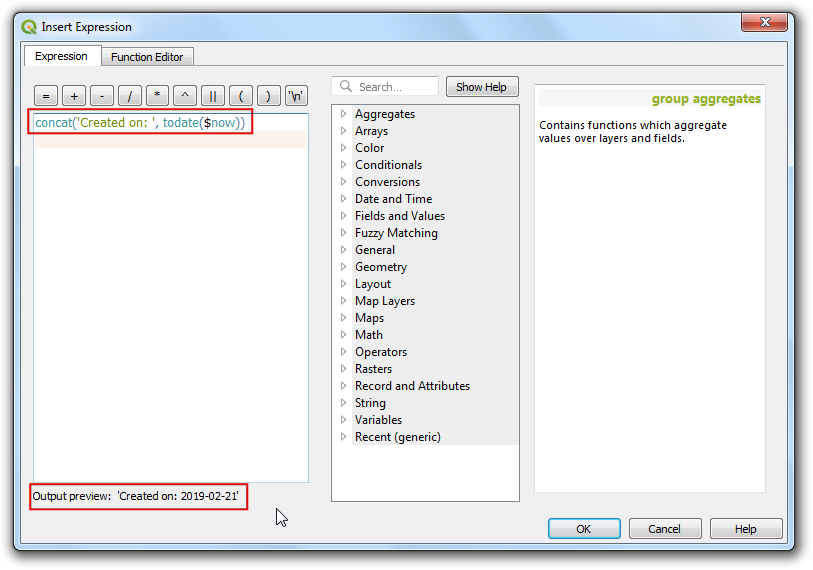
We will now add another dynamic label to show the current date. Go to and select the area on the map. Click Insert an expression button.
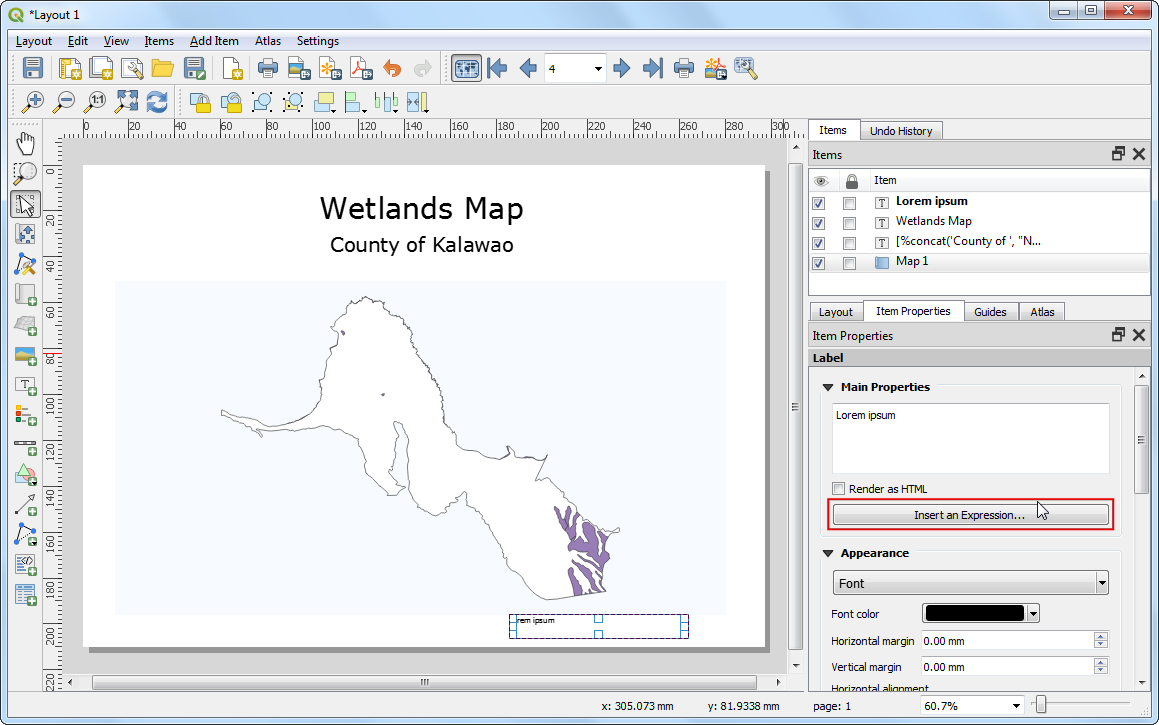
Expand the Date and Time functions group and you will find the
$nowfunction. This holds the current system time. The functiontodate()will convert this to a date string. Enter the expression as below and click OK.
concat('Created on: ', todate($now))
Add another label citing the data source. You may also add other map elements such as a north arrow, scalebar etc. as described in Создание карты tutorial.

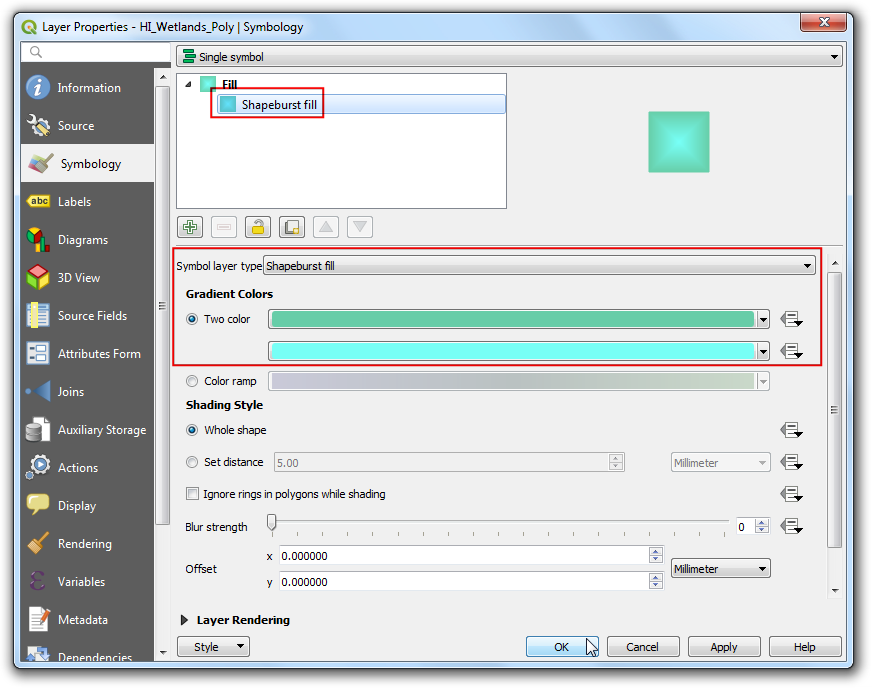
We will make one last styling improvement. Switch back to the main QGIS window and right-click the
HI_Wetlands_Polylayer and select Properties.
In the Symbology tab, click on Simple fill and select
Shapeburst fillas the Symbol layer type. Choose the Two color option and select shades of green and blue that you like. Click OK.
Select Map 1 item and click the Update preview button under Item properties tab to see the changes.
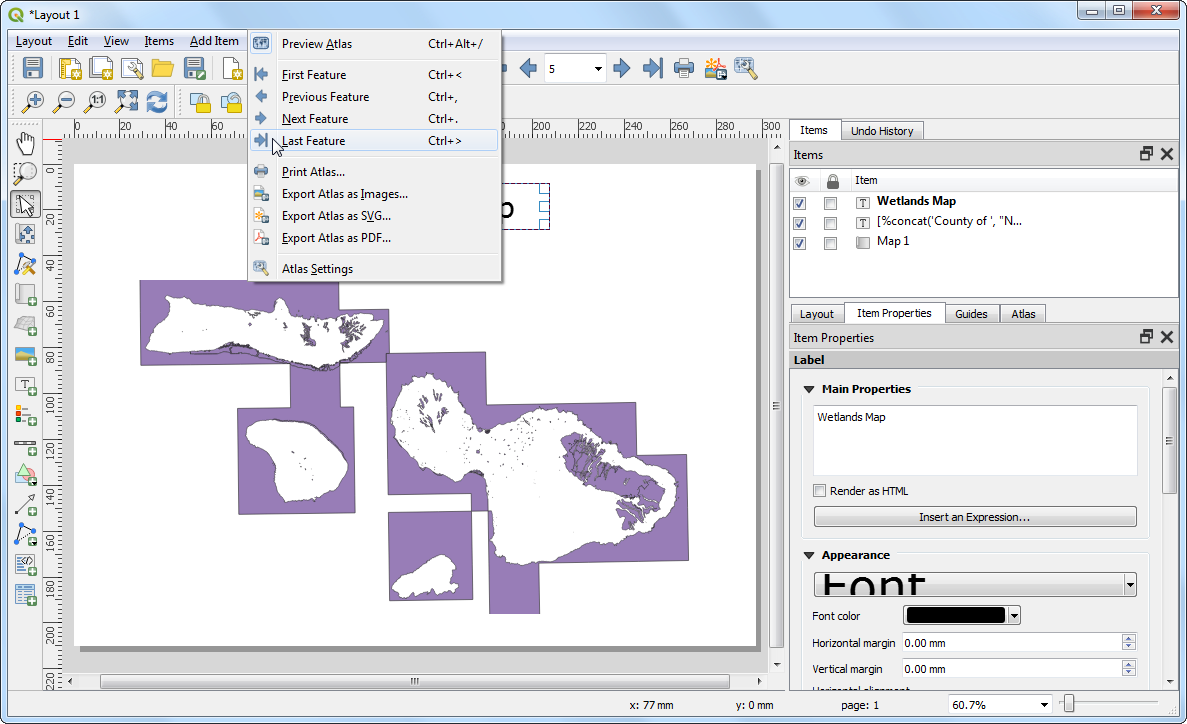
Once you are satisfied with the map layout and styling, go to .
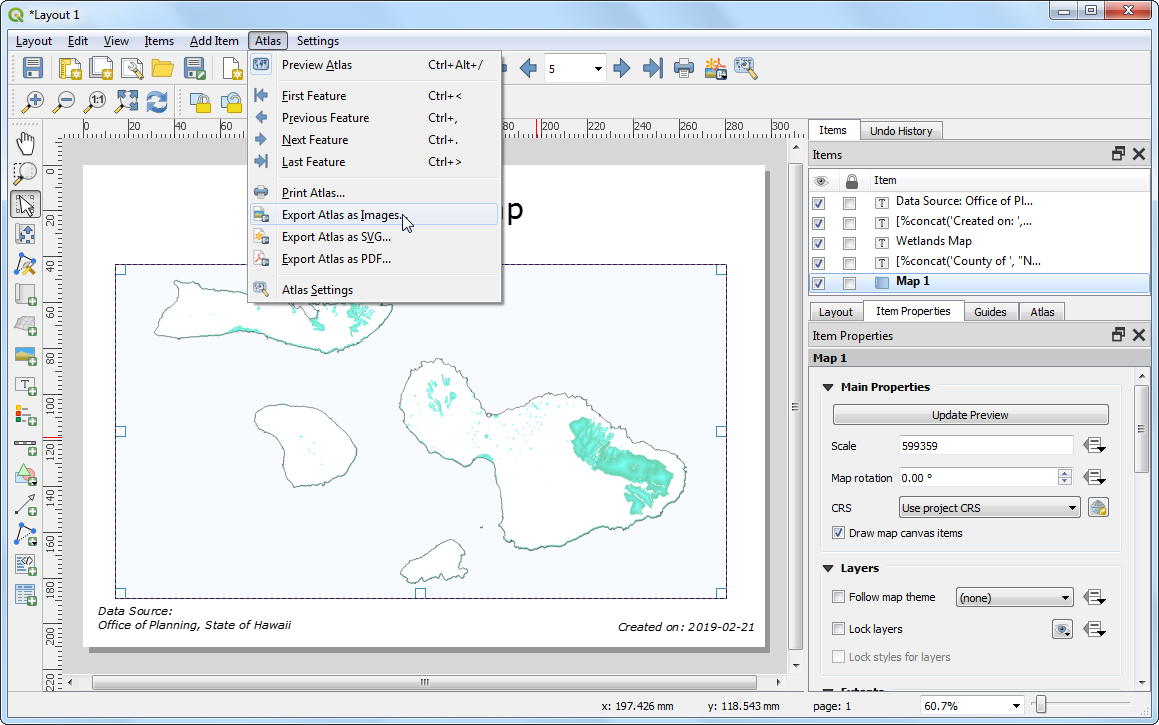
Select a directory on your computer and click Choose.

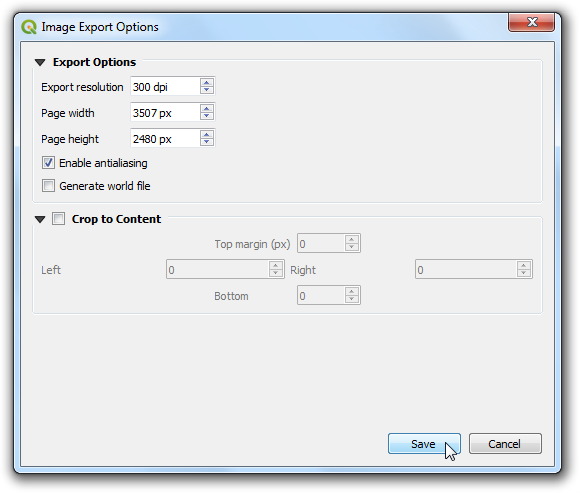
Leave the default options in the Image Export Options and click Save.
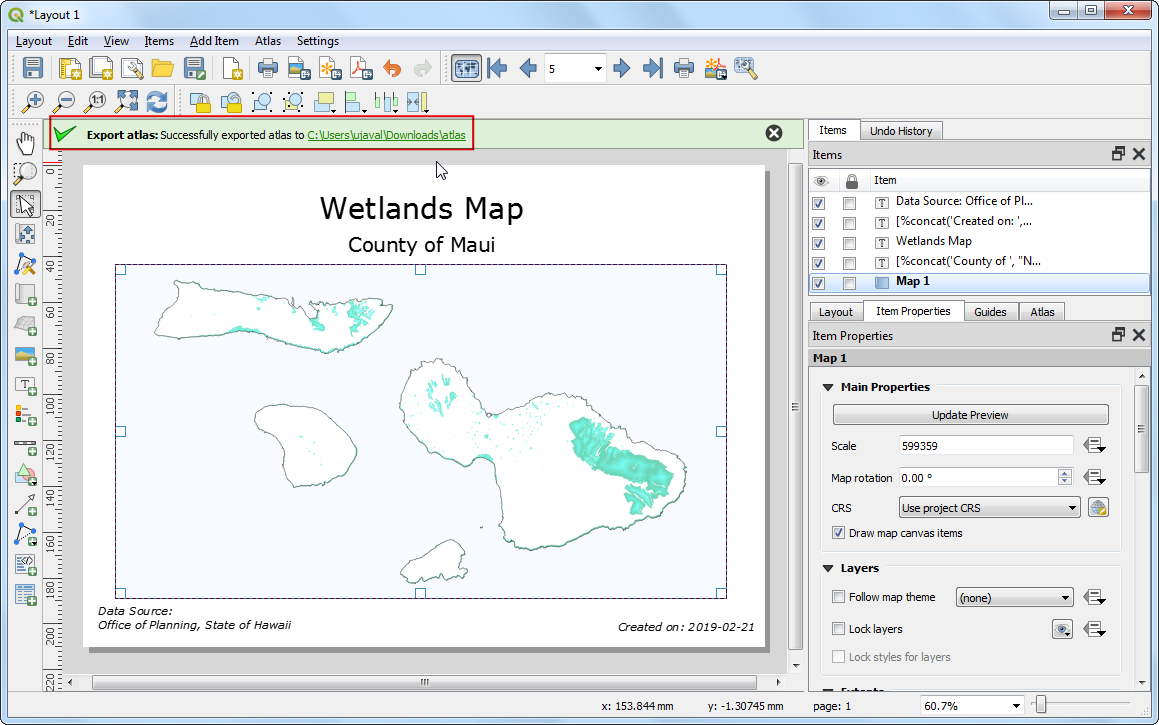
The Atlas tool will now iterate through each feature in the coverage layer and create a separate map image based on the template we created. You can see the images in the directory once the process completes.
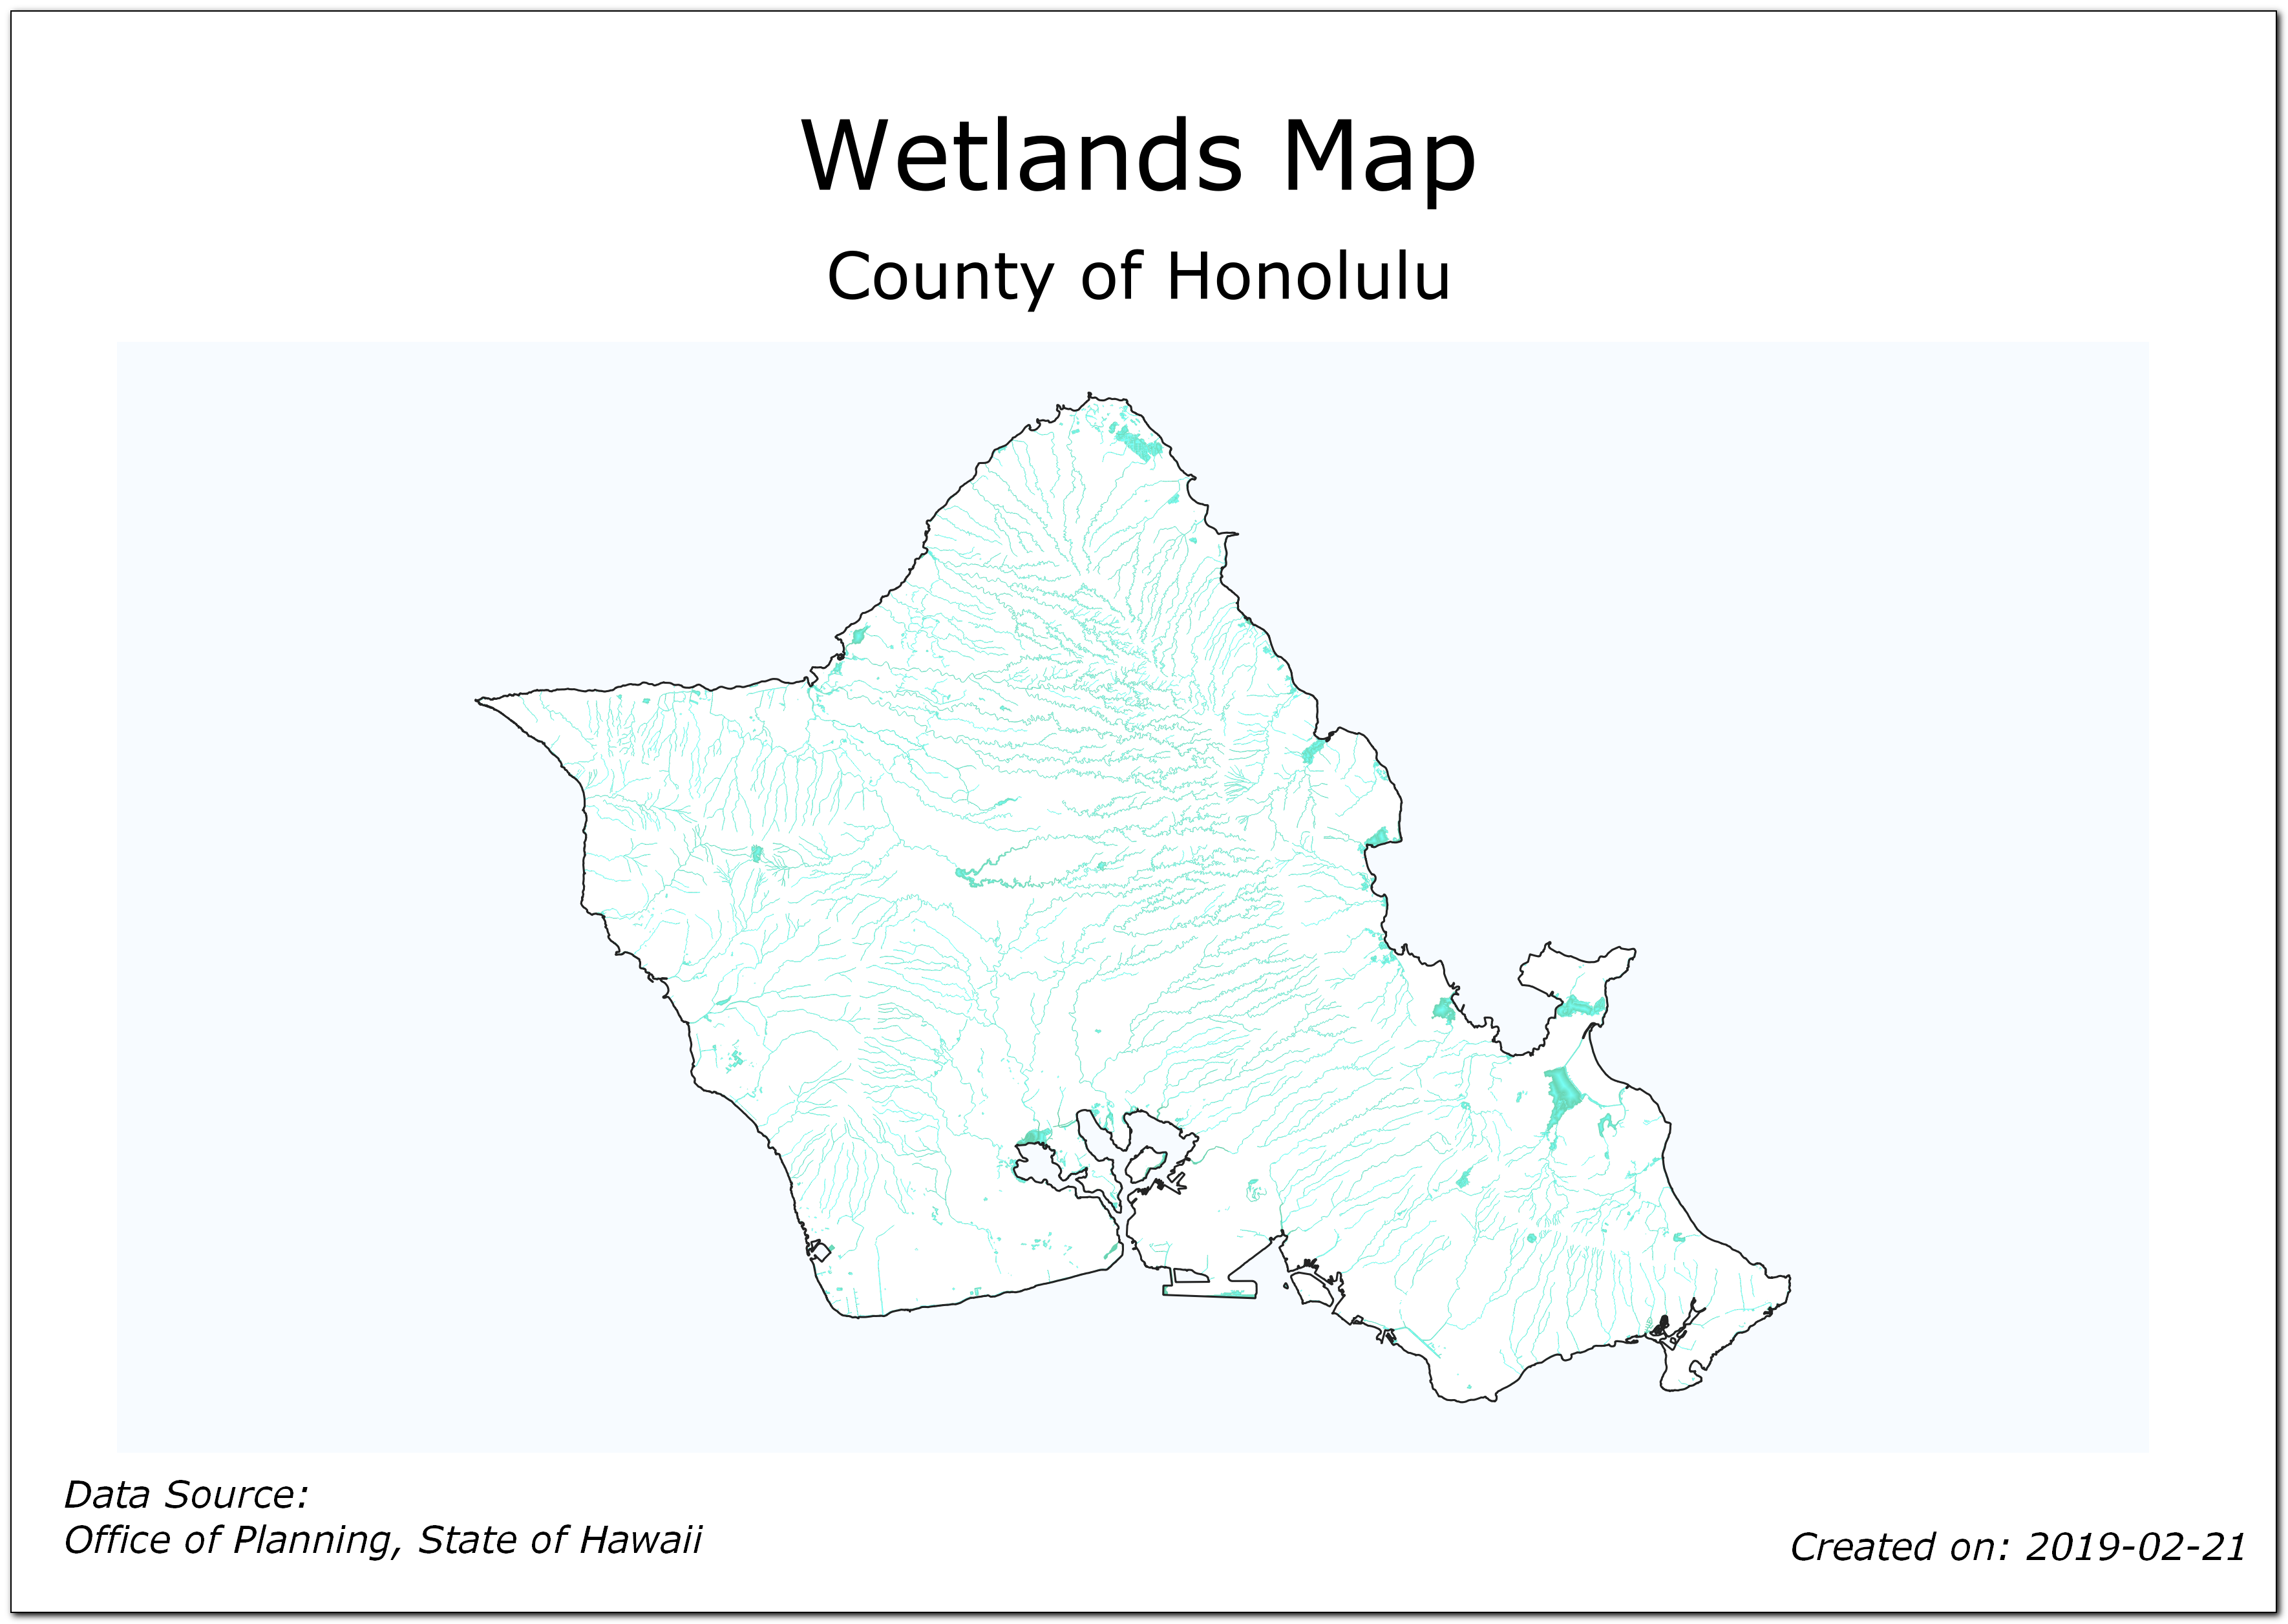
Here are the map images for refeence.
If you want to report any issues with this tutorial, please comment below. (requires GitHub account)