Автоматизація створення мап за допомогою Print Composer Atlas
Попередження
A new version of this tutorial is available at Автоматизація створення мап за допомогою Print Composer Atlas (QGIS3)
If your organization publishes printed or online maps, you often would need to
create many maps with the same template - usually one for each administrative
unit or a region of interest. Creating these maps manually can take a long time
and if you want to update these on a regular basis, it can turn into a chore.
QGIS has a tool called Atlas that can help you create a map template and
easily publish a large number of maps for different geographic regions. If you
are not familiar with the basics of Print Composer, please go through the
Створення мапи tutorial.
Огляд завдання
В цьому уроці показано як створити мапу водно-болотяних угідь для кожного округу штату Гаваї.
Додаткові навички
How to use the
Inverted Polygonsstyle renderer to fill areas outside of polygons.How to use an expression in the
Rule Basedstyle renderer to show only the current feature in Atlas.Apply expressions to create dynamic labels in Print Composer.
Отримання даних
We will use the GIS Data Layers from State of Hawaii - Office of Planning
Download the Wetlands layer from Biologic and Ecologic category.
Download the Census County Boundaries 2010 layer from the Cultural and Demographic category.
Для зручності, ви можете безпосередньо завантажити копію обох наборів даних за допомогою наведених нижче посилань:
Джерело даних [HAWAII]
Виконання
Запустіть QGIS і перейдіть у меню .

Виберіть файл
HI_Wetlands.shp.zipі натисніть кнопку Open.

Виберіть шар
HI_Wetlands_Polyі натисніть кнопку OK.

You will see the polygons representing the wetlands in the entire state of Hawaii. Since we want to make separate wetlands map for each county in the state, we will need the county boundaries layer. Go to and browse to the
county10.shp.zipfile. Click Open.

Перейдіть у .

Leave the composer title field empty and click OK.

Перейдіть у .

Drag a rectangle while holding the left mouse button where you would like to insert the map.

Scroll down in the Item Properties tab and check the Controlled by atlas box. This will indicate the composer that the extent of the map displayed in this item will be determined by the
Atlastool.

Switch to the Atlas generation tab. Check the Generate an atlas box. Select the
county10as the Coverage layer. This will indicate that we want to create 1 map each for every polygon feature in thecounty10layer. You can also check the Hidden coverage layer so that the features themselves will not appear on the map.

You will notice that the map image does not change after configuring the Atlas settings. Go to .

Now you will see the map refresh and show how individual map will look like. Notice that it shows the current feature number from the coverage layer at the bottom right.

You can preview how the map will look for each of the county polygons. Go to .
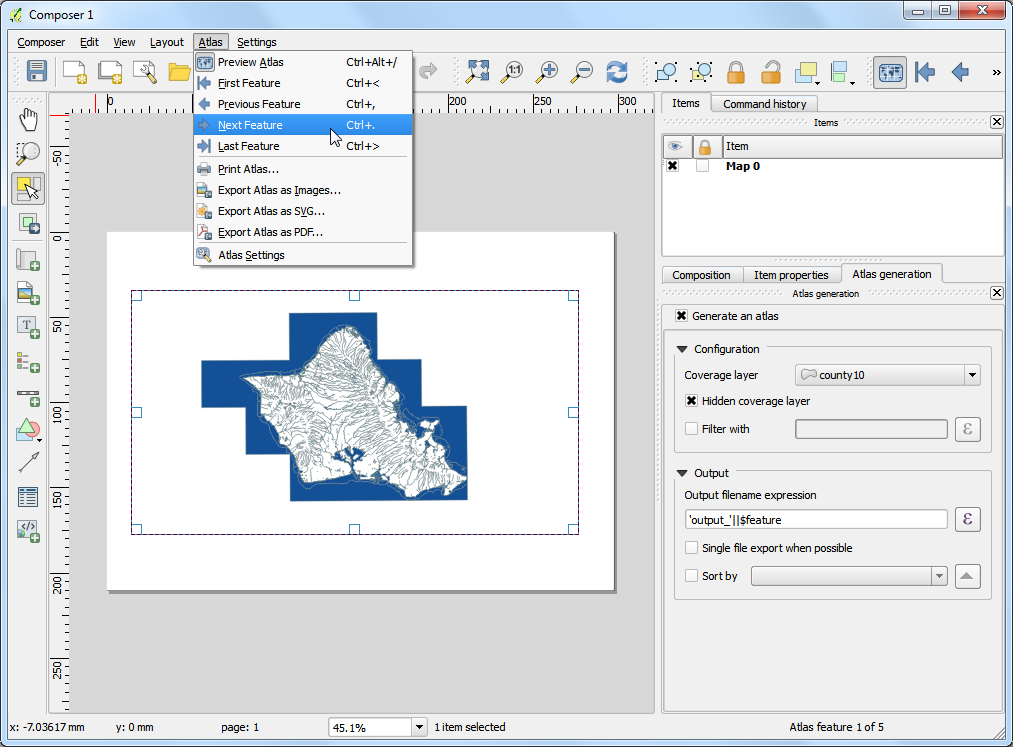
Atlas will render the map to the extent of the next feature in the coverage layer.

Let’s add a label to the map. Go to .

Under the Item properties tab, click Insert an expression… button.

The label of the map can use the attributes from the coverage layer.he
concatfunction is used to join multiple text items into a single text item. In this case we will join the value of theNAME10attribute of thecounty10layer with the textCounty of. Add an expression like below and click OK.
concat('County of ', "NAME10")
Налаштуйте розмір шрифту на ваш смак.

Add another label and enter
Wetlands Mapunder the Main properties. Since there is no expression here, this text will remain the same on all maps.

Go to and verify that the map labels do work as intended. You will notice that the wetland map has polygons extending out in the ocean that looks ugly. We can change the style to that areas outside the county boundaries are hidden.

Switch to the main QGIS window. Right-click the
county10layer and select Properties.

In the Style tab, select the Inverted polygons renderer. This renderer styles the outside of the polygon - not inside. Select white as the fill color and click OK.

Switch to the Print Composer window. If we want the effect of the inverted polygons to show, we need to uncheck the Hidden coverage layer box under Atlas generation. You will now see that the rendered image is clean and areas outside the coverage polygon is not visible.

There is one problem though. You can see areas of the map that are outside the coverage layer boundary but still visible. This is because Atlas doesn’t automatically hide other features. This can be useful in some cases, but for our purpose, we only want to show wetlands of the county whose map is being generated. To fix this, switch back to the main QGIS window and right-click the
county10layer and select Properties.

In the Style tab, select Rule-based renderer as the Sub renderer. Double-click the area under Rule.

Click the … button next to Filter.

In the Expression string builder, expand the Atlas group of functions. The
$atlasfeatureidfunction will return the currently selected feature. We will construct an expression that will select only the currently selected Atlas feature. Enter the expression as below:
$id = $atlasfeatureid

Back in the Print Composer window, click the Update preview button under Item properties tab to see the changes. Notice that now only the area covering the county boundary is shown.

We will now add another dynamic label to show the current date. Go to and select the area on the map. Click Insert an expression button.

Expand the Date and Time functions group and you will find the
$nowfunction. This holds the current system time. The functiontodate()will convert this to a date string. Enter the expression as below:
concat('Created on: ', todate($now))

Add another label citing the data source. You may also add other map elements such as a north arrow, scalebar etc. as described in Створення мапи tutorial.

Once you are satisfied with the map layout, go to .

Виберіть директорію на вашому комп’ютері і натисніть Вибрати.

The Atlas tool will now iterate through each feature in the coverage layer and create a separate map image based on the template we created. You can see the images in the directory once the process completes.

Here are the map images for refeence.


If you want to report any issues with this tutorial, please comment below. (requires GitHub account)