UAV imagery
Near-nadir drone and aerial frames from four public sources in three countries. Every frame shown here was registered to the map; from each source we sample 3,500 frames for the benchmark, spread over the flights to keep scenes diverse.
Sampled frames
Thirty frames per source, drawn from the benchmark sample and chosen to cover different kinds of scenes: 400 sampled frames with more than four SAM3 buildings are embedded with DINOv2 and grouped into 30 appearance clusters, and each cluster contributes its most building-rich typical frame. Open a frame to see its detections, or drape it over the satellite basemap.
Four sources, three countries
Platforms range from a consumer DJI drone over Austin to survey cameras flown along the US coasts before and after hurricanes. All frames look nearly straight down.
| Dataset | Country and area | Camera | In the source dataset | Candidates | Registered to the map | With ≥ 4 SAM3 buildings | Sampled | Image size | Median GSD | Median footprint | Years |
|---|
GSD: ground sampling distance, the ground size of one pixel. Footprint: ground area covered by one frame, from the registered corners. GSD, footprint and years are for the sampled frames. Candidates: AirLock frames subsampled from 10 Hz video; USGS frames with at least four mapped OSM buildings under the GNSS footprint and at most 10% overlap within a flight; all VETRA and UAV-VisLoc frames.
From candidate frames to the benchmark sample
frames per source
How the 3,500 frames per source are chosen
Each source contributes the same number of frames, so no single platform dominates. Within a source, frames are spread over a grid of 1 km cells, every cell getting the same quota in turn, so that densely flown trajectories do not crowd out the rest of the flight area.
Frames with at least four SAM3 buildings come first: four is the minimum for every option of a grounding question to be a real, distinct building, and enough anchors to estimate the image–map offset. Within a cell, frames with more buildings are preferred.
Where the frames are
Each dot is the GNSS position logged with an original UAV image that passed UAV-to-map registration. Switch to the benchmark sample to see the 3,500 frames chosen per source. Zoom in to see the registered footprints, and select a dot for its metadata.
How the sources differ
The same building can be 20 pixels wide or 400. Computed over the 3,500 sampled frames per source: dots mark the median, the band the middle half, the line the 5th to 95th percentile. Hover a row for exact values.
Ground sampling distance
centimetres per pixel, log scale
Ground footprint
area covered by one frame, log scale
SAM3 buildings per frame
detections with score ≥ 0.5, log scale
SAM3 cars per frame
detections with score ≥ 0.5, log scale; frames without cars are left out
Which way the image's top edge faces
Heading of the image's up direction, clockwise from north, from the registered corners. Few frames are north-up, so a model cannot assume the image and the map share an orientation.
Altitude and footprint
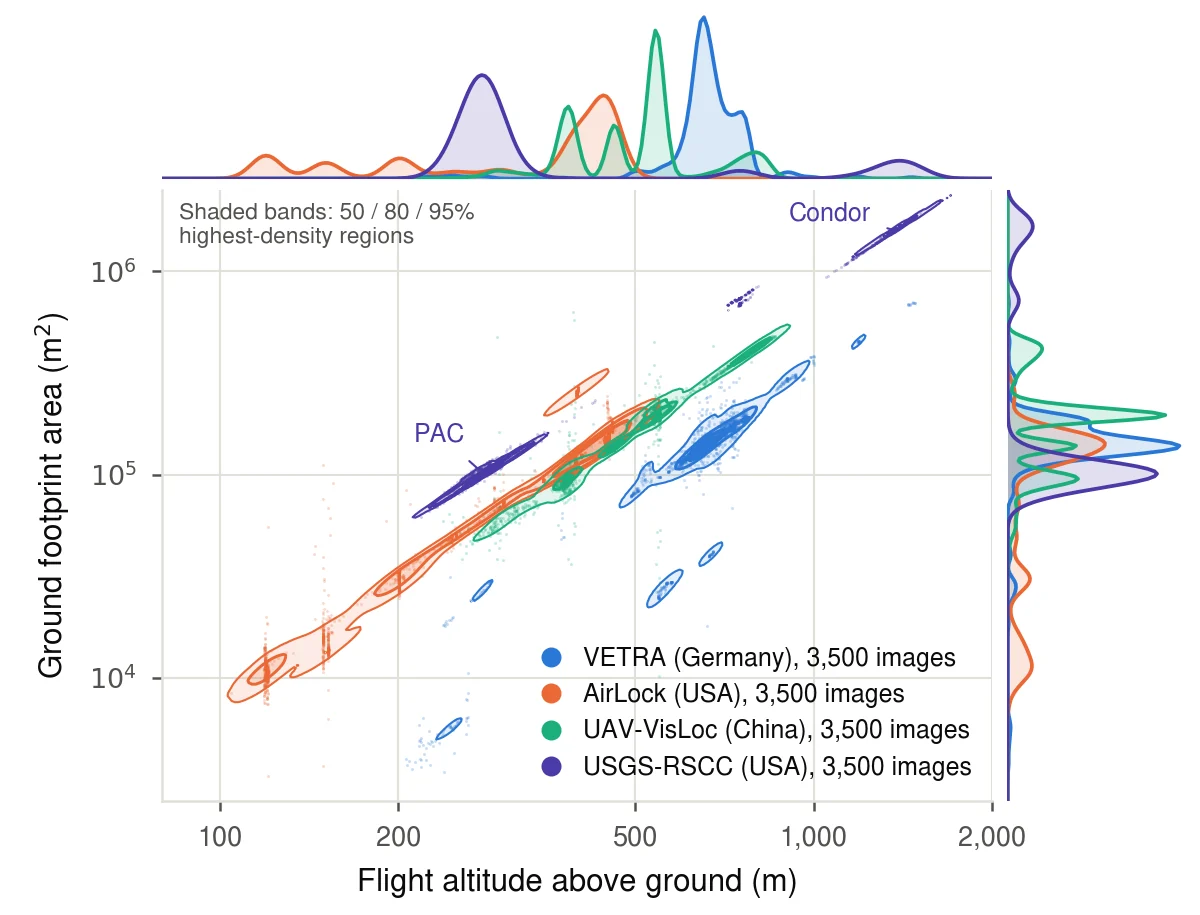
The sources record altitude against different references, so the paper reports altitude above ground level (AGL). Across the 14,000 benchmark frames, AGL ranges from 104 to 1,508 m with a median of 452 m. AirLock covers the low range, UAV-VisLoc and VETRA the middle, and USGS-RSCC mostly flies at about 280 m.
Footprint area grows with the square of altitude, so each camera forms a line of slope two on log axes, offset by its field of view.
| Source | Images | AGL median | AGL range | Footprint median |
|---|---|---|---|---|
| USGS-RSCC | 3,500 | 281 m | 218–1,508 m | 103,700 m² |
| AirLock | 3,500 | 397 m | 104–462 m | 118,200 m² |
| UAV-VisLoc | 3,500 | 538 m | 220–860 m | 191,100 m² |
| VETRA | 3,500 | 662 m | 206–1,480 m | 141,200 m² |
| Total | 14,000 | 452 m | 104–1,508 m | 133,600 m² |
Benchmark sample, from the paper's appendix.