UAV-MapVQA

UAV-MapVQA

Evaluating foundation models on instance-to-entity grounding question answering across UAV imagery and vector maps

Anonymous authors. Under review at ICLR 2027.

Overview video · 8 minSubtitles via CC · Download MP4 (62 MB)

One building, two views

Each highlighted building in the UAV image is matched to its OpenStreetMap entity. This instance-to-entity link is what UAV-MapVQA tests.

UAV image UAV image
OpenStreetMap of the same area, north up OpenStreetMap, north up

Point at a building in either view to see its match.

Loading the scene…

No zero-shot model reaches 50%. People reach 94.8%.

We evaluate 13 foundation models, from GPT-5.5 and Claude Opus 4.7 to open-weight Qwen2.5-VL and the remote-sensing model GeoChat. Fine-tuning on UAV-MapVQA helps, but the gap to people stays wide.

Overall accuracy, mean over the eight tasks. Proprietary models on Test-0.8K, the others on Test-3.2K. Chance is 22.8% because T3 has 14 possible answer sets. Full results by task

In brief

Aerial benchmarks test class-level recognition inside the image, not whether a model can tell which real-world entity in a vector map a visual instance is. UAV-MapVQA is the first benchmark for this instance-to-entity grounding and the geospatial reasoning built on it: 336K multiple-choice questions over 14,000 registered UAV images from the USA, Germany and China, in eight tasks across four levels, each with the map as a rendered raster or as an entity table.

The question behind the benchmark

Can a foundation model ground a drone-observed visual instance to its exact real-world entity in a vector map, and then reason with what the map knows about it?

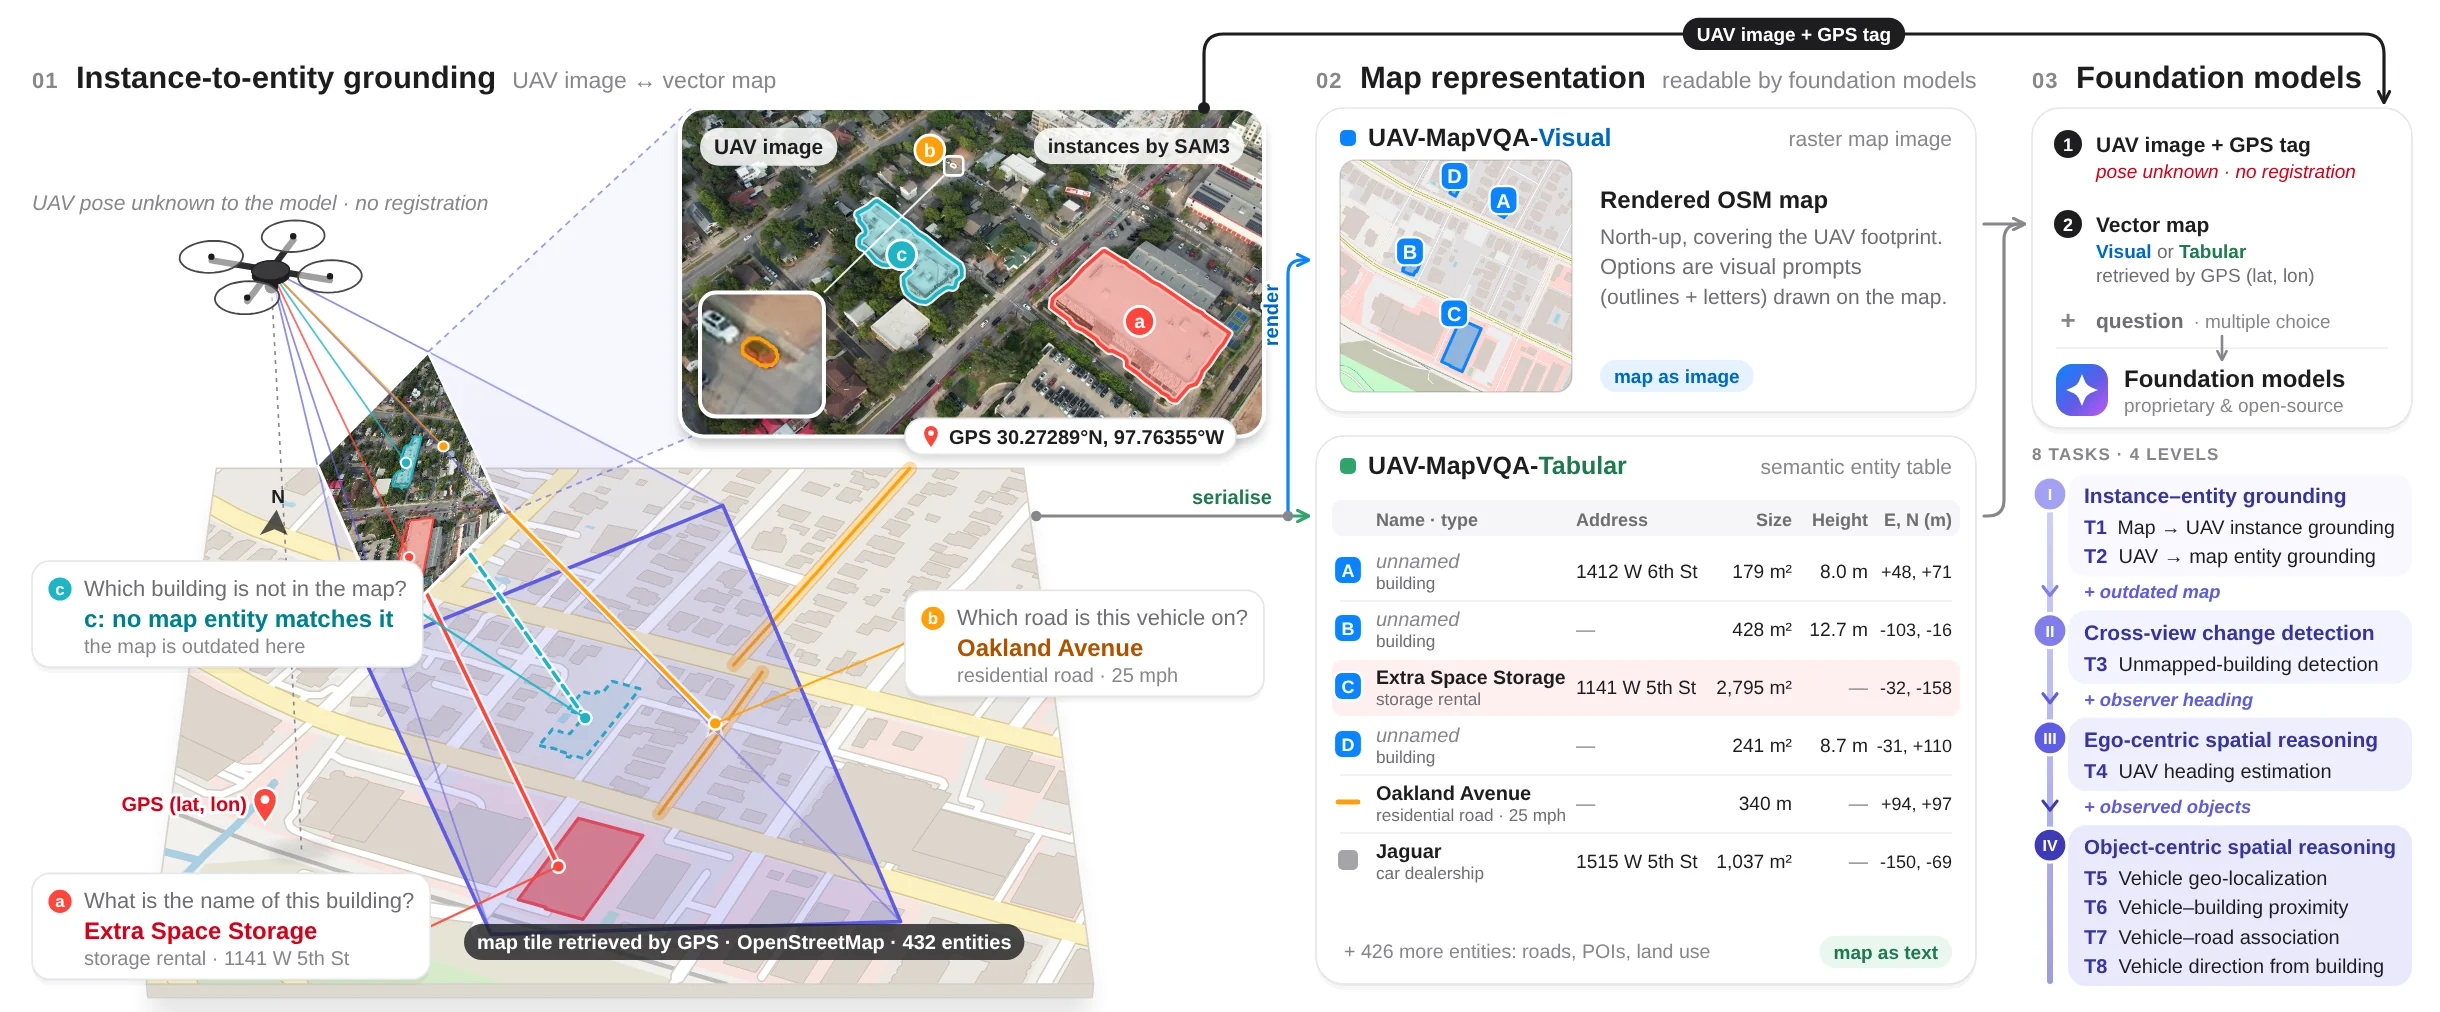
Figure 1: a drone photographs a neighbourhood; the model gets the UAV image, its GPS tag and the vector map, either rendered as an image or serialised as an entity table, and answers questions across eight tasks in four levels.
Figure 1. We instantiate the question with 336K automatically generated QA pairs over 14K registered real-world UAV images from 3 countries and more than 1,000 km of flights, pairing UAV imagery with vector maps for instance-to-entity grounding and map-conditioned geospatial reasoning. Select the figure to enlarge it.
  1. Instance-to-entity grounding

    The model gets a UAV image and its GPS tag, but not the drone's pose and no registration. It must work out which mapped building, road or location a visual instance is: the building that is Extra Space Storage, 1141 W 5th St, the road that is Oakland Avenue, or a structure the outdated map does not have.

  2. Two map representations

    The same OpenStreetMap window comes in two forms. UAV-MapVQA-Visual renders it as a north-up raster with visual prompts drawn on it. UAV-MapVQA-Tabular serialises it as an entity table with names, types, addresses, sizes and positions. Both share the images, questions, options and answers.

  3. Foundation models, eight tasks

    Questions are multiple choice and grouped in four levels that add one dependency at a time, so the task where a model fails tells you whether it is correspondence, map-update reasoning, orientation or object-context reasoning.

From drone frames to verified questions

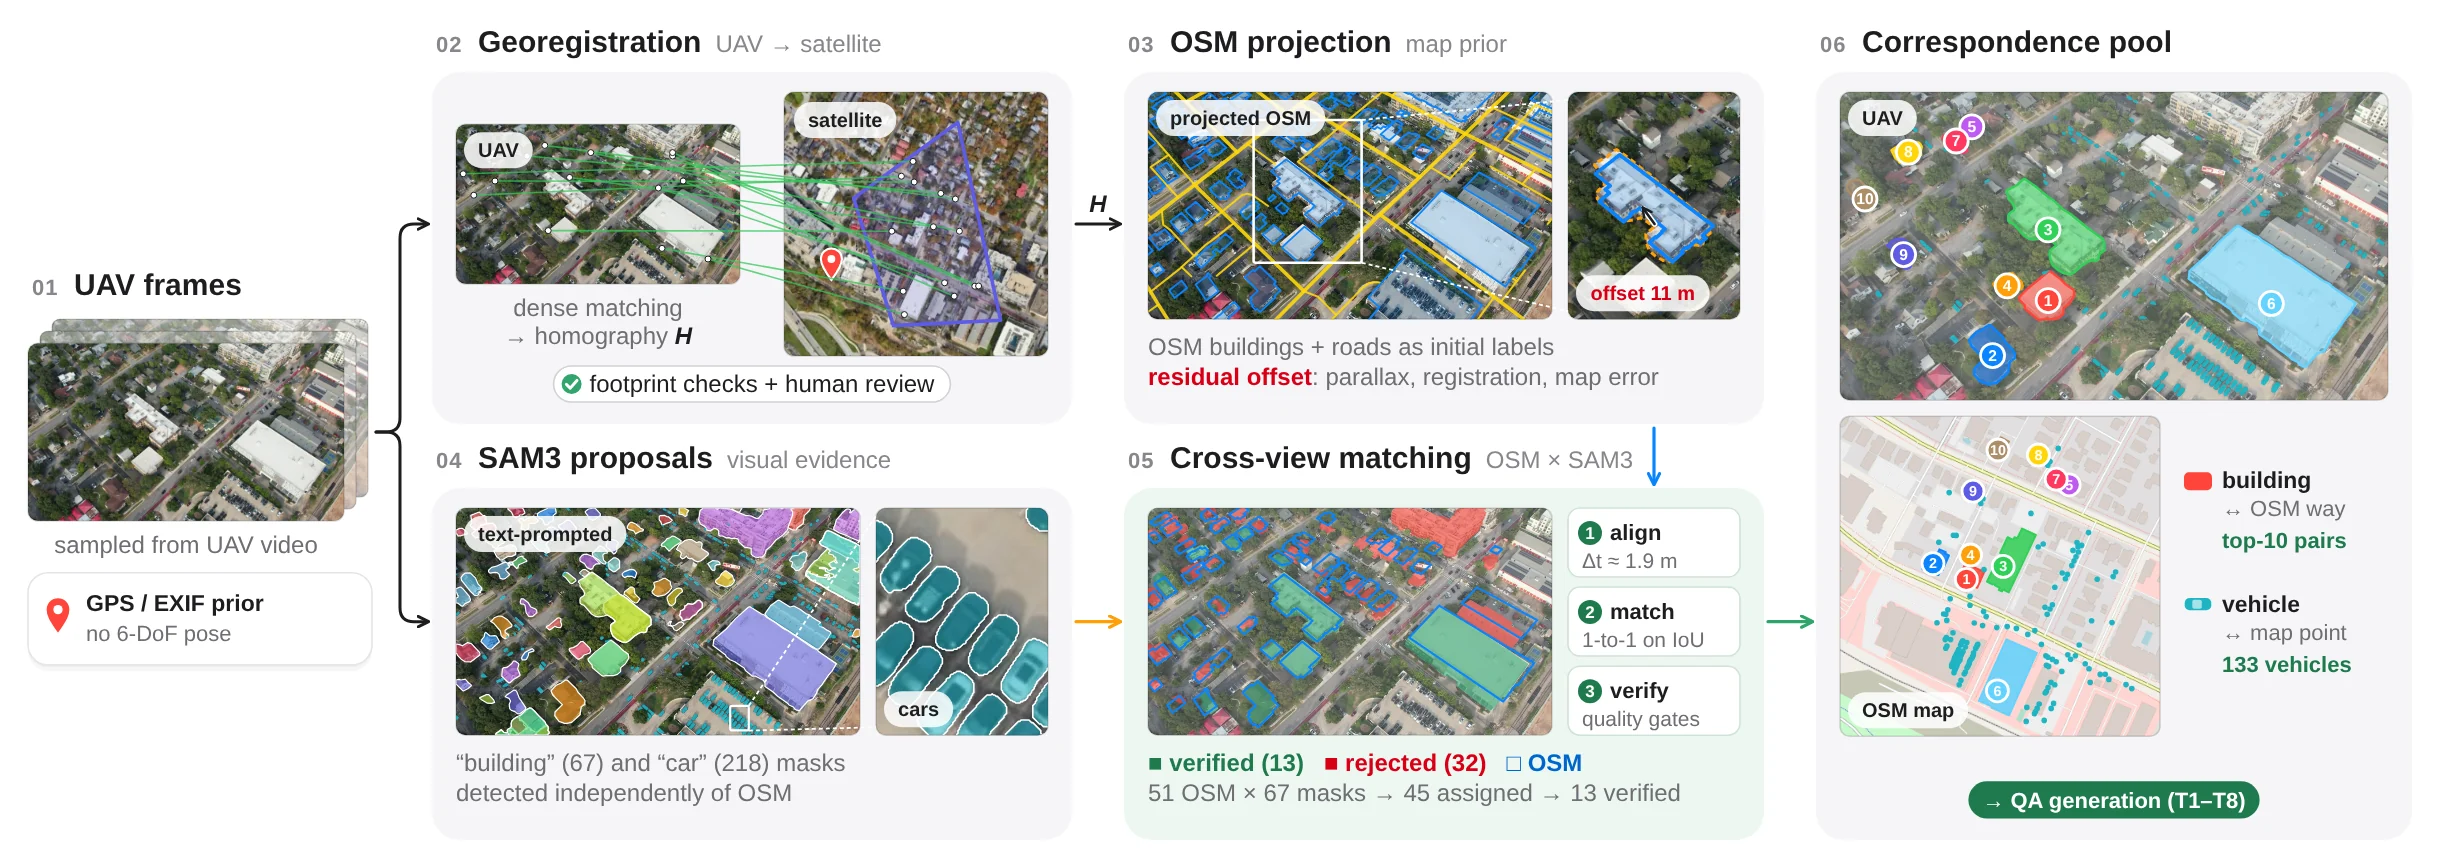
UAV frames are registered to satellite imagery, OpenStreetMap entities are projected into them, and only building pairs that the map and an independent SAM3 detector agree on become ground truth. Each stage has its own page with live data.

Dataset construction pipeline: UAV frames, georegistration to satellite, OSM projection, SAM3 proposals, cross-view matching, correspondence pool.
Dataset construction. Projected OSM buildings and roads give a map prior that still carries residual offsets, so SAM3 proposals detected independently of OSM are aligned and matched to it, and only pairs supported by both sources are kept.
  1. 1UAV imagery26,319 frames registered to the map from four public sources in the USA, Germany and China, and 3,500 sampled from each.
  2. 2UAV-to-map registrationDense matching to satellite imagery gives each frame a footprint, heading and ground resolution. Drape any frame over the basemap.
  3. 3UAV × map scene graphSAM3 instances joined to OSM entities, with change labels and vehicle–road–building relations. Ask it questions.
  4. 4UAV-MapVQA datasetReal questions from Test-3.2K for all eight tasks. Answer them yourself and compare with the models.
336K
multiple-choice questions
14,000
UAV image–map pairs
3
countries: USA, Germany, China
1,000+ km
of flights
3.34M
OpenStreetMap features
1.9 m
median registration error

What we found

Three questions guide the experiments: is the benchmark valid, how does the map representation matter, and does training on it help?

Challenging, but solvable

The best zero-shot scores are 44.0% on Visual (GPT-5.5) and 49.3% on Tabular (GPT-5). Four of 13 models stay within three points of chance. People reach 94.8% with one minute per question. Heading (T4) and compass direction (T8), which depend most on how the two views are oriented, are the hardest.

Raster and table have complementary strengths

Tables help strong reasoners: GPT-5 gains 9.0 points. After fine-tuning, the raster leads, but only in dense scenes, where serialised maps need 2.7× more tokens and fine-tuned Tabular models lose up to 13.7 points. The fixed-size raster loses at most 2.0.

Training helps, orientation is part of the gap

QLoRA fine-tuning lifts Qwen2.5-VL-32B from 23.0% to 57.2%, above every zero-shot model. Rotating the map to the UAV heading adds up to 8.7 points for GPT-5.5, so orientation errors propagate into reasoning, yet they explain only part of the gap to people.