Last Updated: 2021-10-11
This is the fourth and final part of a tutorial that guides you through the process of building a Koivu Cloud spreadsheet-database app. As it's always helpful to focus on a concrete example, we have been building an app for sales personnel who need a tool to create quotes. The other parts of this tutorial series are:
This final part concludes our tutorial, and at the end, you should have an overview of how to design and implement a new Solution using the Koivu Cloud platform. By now you should have noticed that the cloud tables function as the backbone of a Solution, and that you build functionality by adding scripts into these cloud tables. Also, you've probably noticed that each column of every table in your solution is listed in the Column Definitions table. Similarly, each cloud table is listed in the Table Definitions table, which itself is also a cloud table. These two tables are essential when you're configuring your app, and in this final part we'll continue to set up our app using these cloud tables.
What you'll learn
In this final part we'll finish our quote builder with the Koivu Cloud Excel add-in. You'll learn how to:
- Create a secondary view of a table
- Build an analytics page
What you'll need
Creating a Koivu Cloud solution is a relatively easy task, however, you should at least have the following:
- Koivu Cloud account
- Basic knowledge of the Koivu Cloud Excel add-in - see Introduction to Koivu Cloud Excel add-in
- Working knowledge of Excel, including tables
- You know what cloud tables are and can create one - see Get your spreadsheet into a database - Cloud Tables
Koivu Cloud enables you to create different views from the same cloud table. You can use a view to, for example, display only a subset of the cloud table's columns. We'll use this feature to create a printable page of the quote, where we use the same table, but use only specific columns from the table. In essence, a view is a convenient way to customize and filter how and what data will be displayed in the sheet. And as a matter of fact, every time you open a cloud table in Excel, you're displaying a view.
The Table Definitions cloud table lists all of the cloud tables of your Solution, and the easiest way to create a new view from an existing cloud table is to clone its row. In summary, find the appropriate row from the Table Definitions table, clone it and enter a new ID (Key value). As a result, the new entry will be listed as its own cloud table option in the add-in's Select Table drop-down list, and you can open it into a new spreadsheet. Lastly, you can choose which columns you want to display in the spreadsheet.
To make a new view:
- Access the Table Definitions cloud table, for example, on the Table Definitions sheet of the template workbook.
- Select a cell from the Quote row.
- In the add-in, select Clone > Table Rows Below to create a clone of the row below it.
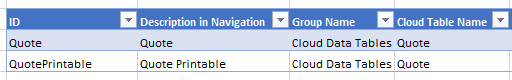
- Enter new values for the cloned row: ID: QuotePrintable, Description in Navigation: Quote Printable.
- In the add-in, click Save, and then Submit to save the changes.
- Create a new sheet titled
Quote Printable. - Open the new Quote Printable cloud table in the Quote Printable sheet: select the new Quote Printable cloud table from Select Table list, and click Search.
We now have a new view into the same data that is used in the Quote cloud table. Next, we can remove data that we do not need, and add information that we want to have. When you open a cloud table into a blank sheet, all of its columns are retrieved. You can customize the view simply by removing the columns you do not need, click Clear to clear it from the data, and perform any additional customizations for the template. For example, you could create a printable quote page that looks like this:
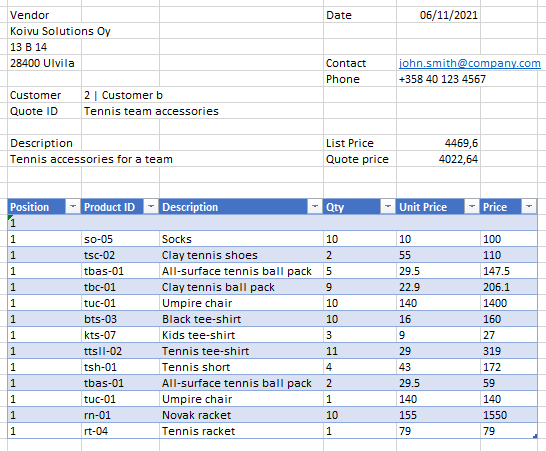
The above example has the following changes in the Excel template:
- vendor information has been added to the header
- the table has only six columns (e.g. all additional rows have been removed)
- level 2 fields have been moved to the header
Also, you can create similar search fields for the table as we built previously for the Quote cloud table. This time we will not go into any further details as we've already discussed how these settings are done. However, please go ahead and customize your own printable quote page. For example, in Excel you could select View > Gridlines to hide the gridlines, and make the layout differ from a traditional spreadsheet.
Finally, we'll create another view that is used to display an analytics page. Our aim is to build a page that can present historical data using Excel charts. However, we don't want information about individual items, and therefore we want to limit the view to only include data about the customer and the Quote ID, for example. We're going to build the view in the Table Definitions table, and the view will only return the rows that we previously relocated to the header of the Quote sheet. You can limit the query to return only the header rows by adding a "level" query parameter into the Read URL column. That is, we'll retrieve only rows that have their level set as 2.
To create a view with query parameters:
- Access the Table Definitions cloud table, for example, on the Table Definitions sheet of the template workbook.
- Select a cell from the Quote row.
- In the add-in, select Clone > Table Rows Below to create a clone of the row below it.
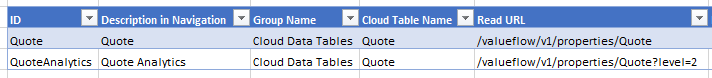
- Enter new values for the cloned row: ID: QuoteAnalytics, Description in Navigation: Quote Analytics.
- Add a "level" query parameter into the Read URL field:
/valueflow/v1/properties/Quote?level=2. The level here matches the number of key columns being used; only the rows that have two or less key values will be returned. If the level is not defined, all are returned.
- Save the changes.
Customize the view
Next, we want to customize our new view in the Excel template. Also, we need some additional fields for our analytics view, and therefore we need to create new columns. In summary, we need to:
- add new columns to Quote for order date and status
- move the fields into the header section of the sheet
- create a secondary key for searches
- filter the view
- attach the new columns to the view
- configure the search fields
To add new columns:
- Open the Quote cloud table on the Quote sheet of the Excel template.
- In Excel, add a new column to the table. There are a number of ways you can do this in Excel, for example, you can right-click a cell in the table and insert a new column.
- Enter a name for the column heading. You'll need two columns:
Order dateandStatus. See the image below. - Pick any cell that is in the new column, and from the Koivu Cloud add-in select Tools > Development Tools > Create Column.
- Enter the appropriate information. You'll need to repeat the steps for each column.
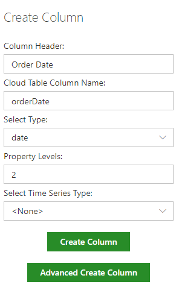
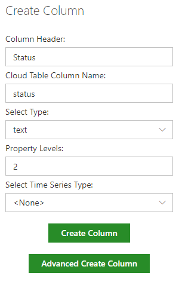
- Click Create Column after you've entered the required data. Alternatively, click Advanced Create Column to access the Column Definitions sheet, where you can specify more detailed settings.
- In the add-in, click Save to save the changes, and Submit to submit the values.
- Click Close and Go to Original Sheet to return to your original sheet.
- We'll use these columns only in the analytics view, so you can remove the columns from the table of the Quote sheet.
We defined the property level of the new columns to be 2, which means that they will be used in the header only. Therefore, the next step is to move the columns to their correct location.
To move the fields out of the table:
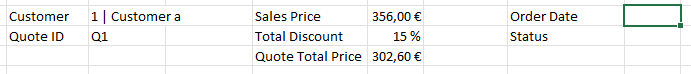
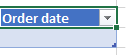
- In the header section of the Quote sheet, create entries for Order Date and Status, as illustrated in the image below.
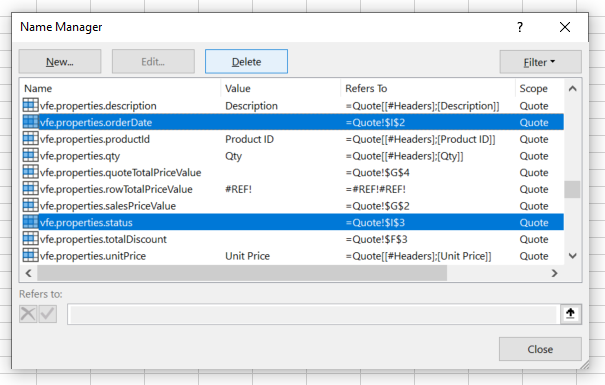
- In Excel, select Formulas > Name manager.
- To edit the name entries for Order date and Status, double-click the entry, or select it, and click Edit.
- In the Refers to field, change the reference to refer to the cell next to the new Order date and Status cells, and click OK.
- Remove the Order date and Status columns from the table: select a cell from the column, right-click and select Delete > Table Columns. The column is no longer needed in the Excel template, as the information will be displayed in the header section.
- In the add-in, click Search to refresh the data. The value that you had in the Order date and Status columns are now displayed in the header section, although they currently have no values. You can set an order date, e.g.
21/09/2021and status, e.g.Awaiting delivery, in the new fields for a quote. Alternatively, you can use the web app to set the values.
We also want to use the Order Date and Status columns as search criteria in the analytics view, and to this end, we'll use the secondary indices.
To define a secondary index:
- In the Excel add-in, open the Table Definitions cloud table.
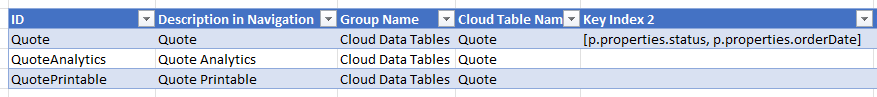
- On the Quote row of the table, enter
[p.properties.status, p.properties.orderDate]in the Key Index 2 column. The secondary key indices are defined as arrays in the Key Index 2, Key Index 3 or Key Index 4 columns. You can enter properties, keys, or expressions as a value. We have to use Quote table instead of the QuoteAnalytics view, because the QuoteAnalytics, QuotePrintable view tables search from the original one:
- In the Quote sheet, refresh the data for each row. That is, change a value in each row and save the changes. For example, set all cells to
999in the Level column. The level field is automatically generated, so the changes you make won't persist. - Save the changes.
We can remove all columns that we don't need from the Excel template. The workbook functions as the UI for the quote builder, and therefore, if you remove a column, its data is not retrieved from the cloud. In other words, you can filter the view by removing unnecessary columns from the sheet.
To filter the view:
- Open the Quote Analytics cloud table on the Quote Analytics sheet of the Excel template. If you do not yet have one, create a blank sheet and open the table.
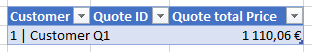
- In Excel, remove all unnecessary columns from the table. We only need Customer, Quote ID, Quote Total Price Value, together with the Order Date and Status columns, and you can remove the other columns. Also, you can change the name of the Quote Total Price Value column to simply Quote Total Price. There are a number of ways you can do this in Excel, for example, you can right-click a cell in the table column and select Delete > Table Columns to delete the column.

- Save the changes to the template.
Note that if you have opened the Quote Analytics into a new sheet before you created the Order Date and Status columns, you can attach these columns into the view. That is, if you only have these columns in your view:
To attach columns:
- Open the Quote Analytics cloud table on the Quote Analytics sheet of the Excel template.
- In Excel, create a new column to the table. There are a number of ways you can do this in Excel, for example, you can right-click a cell in the table and insert a new column. We need new columns for Order date and Status.
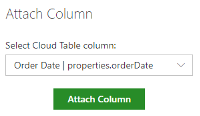
- Select a cell in the new column, and in the add-in, select Tools > Development tools > Attach column to attach an existing column from a cloud table to the Excel table. For example:
- Save the changes.
Search fields
We'll end this tutorial by defining the search fields for the Quote analytics page.
To configure the search fields for the Quote Analytics view:
- On the Quote Analytics sheet of your workbook, make sure that the Table is set as Quote Analytics in the add-in.
- Select Tools > Development Tools > Search Field Builder. We'll configure the search fields the same way as before, with the exception that we'll use the secondary key index in the search. Please refer to the previous sections to search fields in this tutorial for more information about configuring search fields.
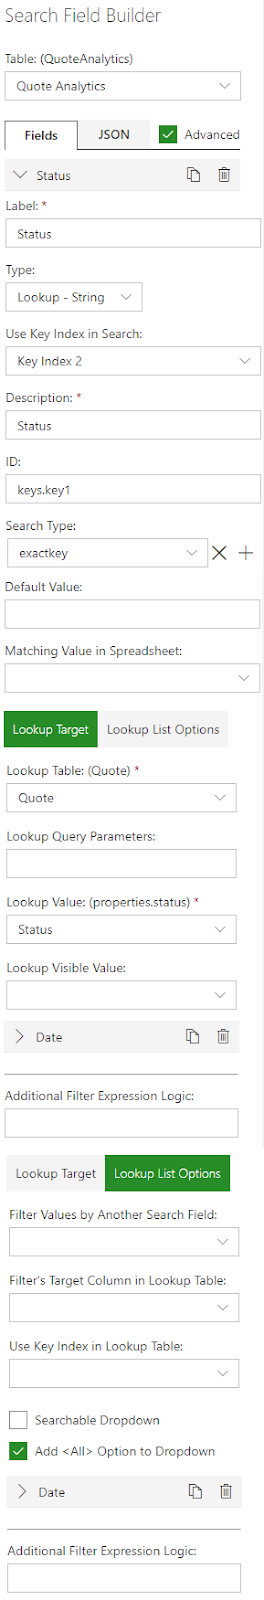
- Create a search field for Status and Date, in this order. For example:
|
|
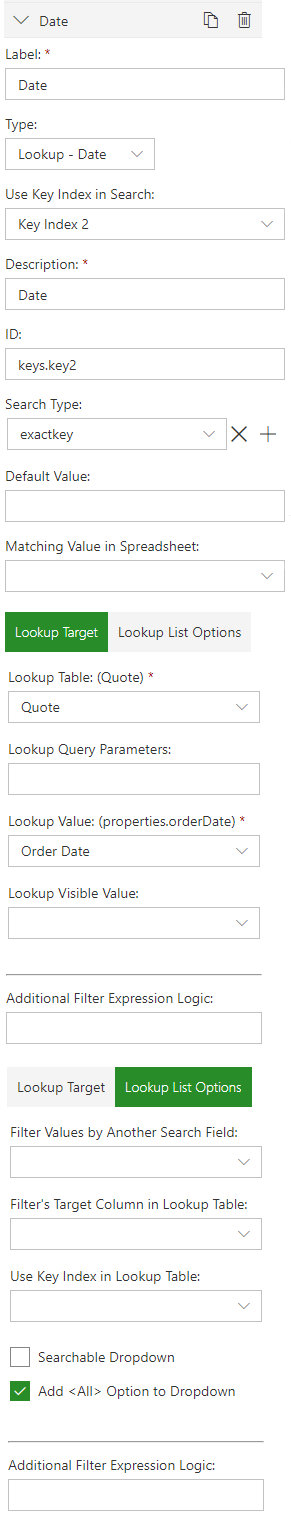
- Click Save to save the search fields.
You should now have two drop-down search fields in the add-in for the Quote Analytics view.
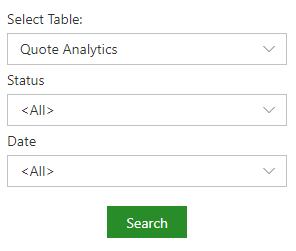
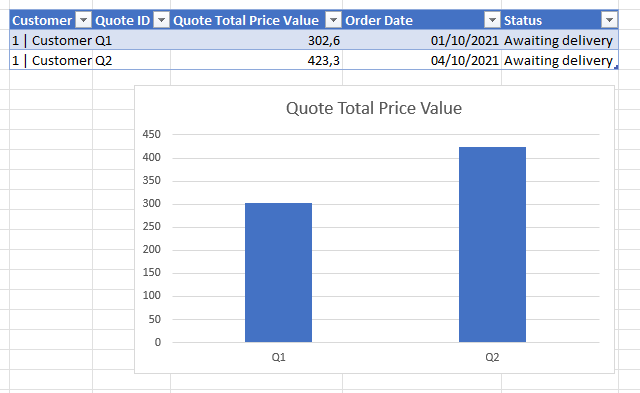
Now you can, for example, create a chart in Excel that displays your quote data, and you can use the search fields to filter by status and date:
Congratulations, you have now completed the tutorial and you can now build your own Koivu Cloud Solutions!
Additional training material
Explore these tutorials to learn more about what you can do with Koivu Cloud:
- Introduction to Koivu Cloud Excel add-in
- Get your spreadsheet into a database - Cloud Tables
- Design a Solution - Part 1
- Design a Solution - Part 2
Further information
Make sure to visit our community site and learn more about Koivu Cloud.