
Dear old grandpa Rupert has found a cherry in some climate data, and has been excitedly pointing at it on twitter and demanding that Al Gore explain it to him. Al’s not biting, but it would probably be good news for everyone if the world’s biggest newspaper mogul understood the world’s biggest news story, so here goes.
Last year, the Arctic Sea Ice retreated by a hitherto unprecedented extent, and we had less ice by area than had ever been measured before, by quite a big margin. The cherry Rupert picked is not this unique, ground-breaking new development, but something called ‘regression to the mean’, the principle by which extreme outliers in a dataset tend to be followed by less extreme values, or in other words, the principle that you’re unlikely to get two all-time world records in a row. It’s a pretty simple principle.
So, as 2012’s Arctic Sea Ice extent was not only the all-time world record minimum, but significantly lower than the previous record, all the glaciologists, oceanographers and climatologists working in the field predicted a higher minimum this year, which we look very likely to get. Lower than average, of course, because the long-term downward trend hasn’t changed, but higher than last year.
However, to uncle Roop’s somewhat jaundiced eye, ‘regression to the mean’ looks like ‘reversal of the trend’. This kind of misidentification requires a bit of squinting, but I can help you to visualise it for yourself.
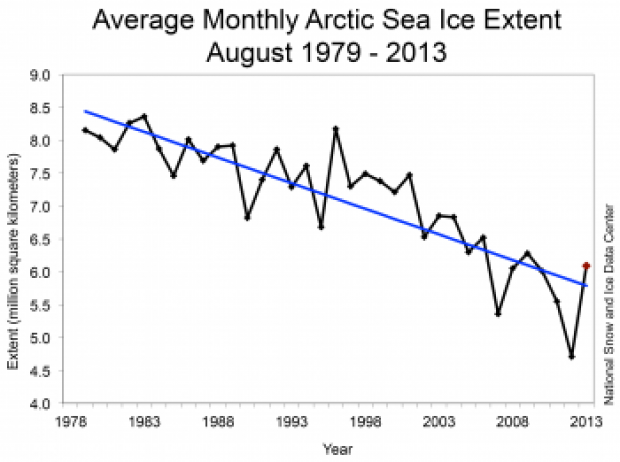
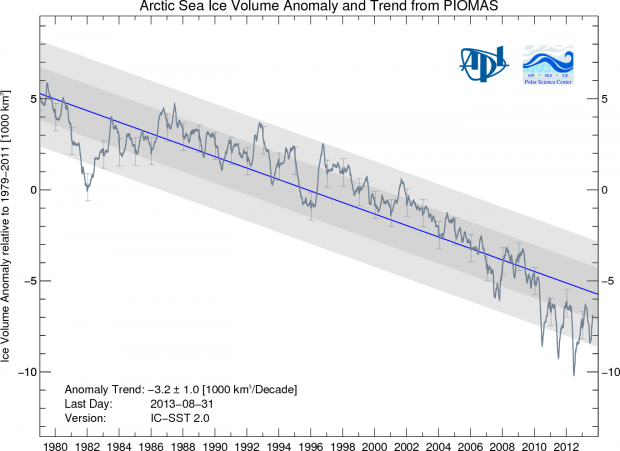
There are two graphs at the bottom of this post showing how Arctic Sea Ice extent and Arctic Sea Ice volume have varied over the last thirty to forty years. To the casual observer, they all appear to show rapid and fairly relentless decline. But to experience a Roop’s-eye view of the data, all you need is a common-or-garden toilet roll. Simply close your left eye, hold the toilet roll up to your right eye, and point it at the bottom right-hand corner of a graph so that you can only see the last two data points. You’ll need to be very careful that you don’t accidentally see any of the other data points, as that will ruin the experiment. Here’s a handy little list of the main things to ignore –
- Ignore all trend lines – they may look convincing, but they’re just computer model-type nonsense.
- Ignore the way that the Arctic ice has been disappearing much faster than any of the models predicted. Models, eh?
- Ignore the fact that we’ve already lost over 70% of the Arctic Sea Ice by volume. Most of that was under water anyway.
- Ignore the last decade –it was the hottest on record, but that could have been a fluke.
- Ignore the last century – it’s just so last century.
Now, if you hold the toilet roll steady to block all of that out, and sort of squint a bit to make things go a little out of focus, you should be able to see a blurry little V shape at the end of the toilet roll. If you ignore the downward stroke of the V, and just look at the upstroke, that’s global cooling. Furthermore, if you keep squinting and point the toilet roll at Fox News, you’ll be able to see that climate change is really just a communist conspiracy.

