Data#
In God we trust, all others bring data.
—William Edwards Deming
Data is a broad term that refers to facts, statistics, or information in a raw, unprocessed, or organized form. Data can take many forms, including numbers, text, images, audio recordings, and more.
Data processing#
The process of preparing raw data for machine learning involves several stages of data processing and manipulation to transform it into a structured and suitable format. The most common stages are:
data collection;
data cleaning:
handling missing values;
remove duplicates;
outlier detection;
data type conversions;
data exploration and visualization;
feature engineering.
The result of these manipulation is what is usually called a dataset: a specific collection of data that is organized and structured in a way that makes it suitable for analysis, processing, or machine learning tasks.
Data types#
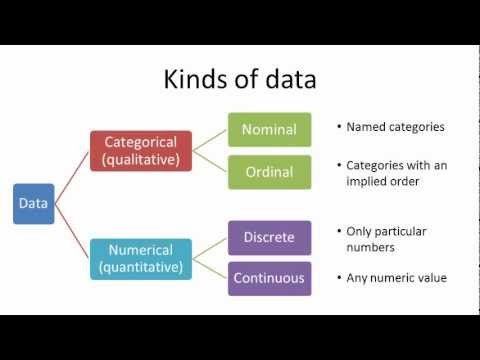
Numerical continuous data#
Continuous data can take on any real[1] value within a range and often involves measurements. For instance:
height
temperature
distance
time
Numerical discrete data#
Discrete data consists of distinct, separate values and often involves counts or categorizations, e.g.
number of children
shoe size
test scores
Important
The distiction between continuous and discrete data can be occasionally ambiguous. For example, age in years probably should be considered as a discrete variable. However, if we allow fractional ages, e.g. \(30.2\) years, it becomes a continuous variable.
Categorical nominal variables#
Nominal data consists of categories with no inherent order or ranking. For example:
colors
fruits
gender
countries
Categorical ordinal variables#
Ordinal data includes categories with a meaningful order or ranking. Examples:
education level
customer satisfaction
movie rating
top-10 items suggested by a search engine
Examples of datasets#
There are several way how you can import some famous datasets in Python.
Tip
To install Python library scikit-learn (aka sklearn), run the command pip install scikit-learn
For instance, we can use helpers from sklearn.datasets module.
Iris dataset#
from sklearn.datasets import load_iris
iris_data = load_iris(as_frame=True)
iris_data['data']
| sepal length (cm) | sepal width (cm) | petal length (cm) | petal width (cm) | |
|---|---|---|---|---|
| 0 | 5.1 | 3.5 | 1.4 | 0.2 |
| 1 | 4.9 | 3.0 | 1.4 | 0.2 |
| 2 | 4.7 | 3.2 | 1.3 | 0.2 |
| 3 | 4.6 | 3.1 | 1.5 | 0.2 |
| 4 | 5.0 | 3.6 | 1.4 | 0.2 |
| ... | ... | ... | ... | ... |
| 145 | 6.7 | 3.0 | 5.2 | 2.3 |
| 146 | 6.3 | 2.5 | 5.0 | 1.9 |
| 147 | 6.5 | 3.0 | 5.2 | 2.0 |
| 148 | 6.2 | 3.4 | 5.4 | 2.3 |
| 149 | 5.9 | 3.0 | 5.1 | 1.8 |
150 rows × 4 columns
This is a tabular dataset. The targets are encoded by digits \(0\), \(1\), \(2\):
iris_data['target'].value_counts()
target
0    50
1    50
2    50
Name: count, dtype: int64
What does these values mean?
iris_data.target_names
array(['setosa', 'versicolor', 'virginica'], dtype='<U10')
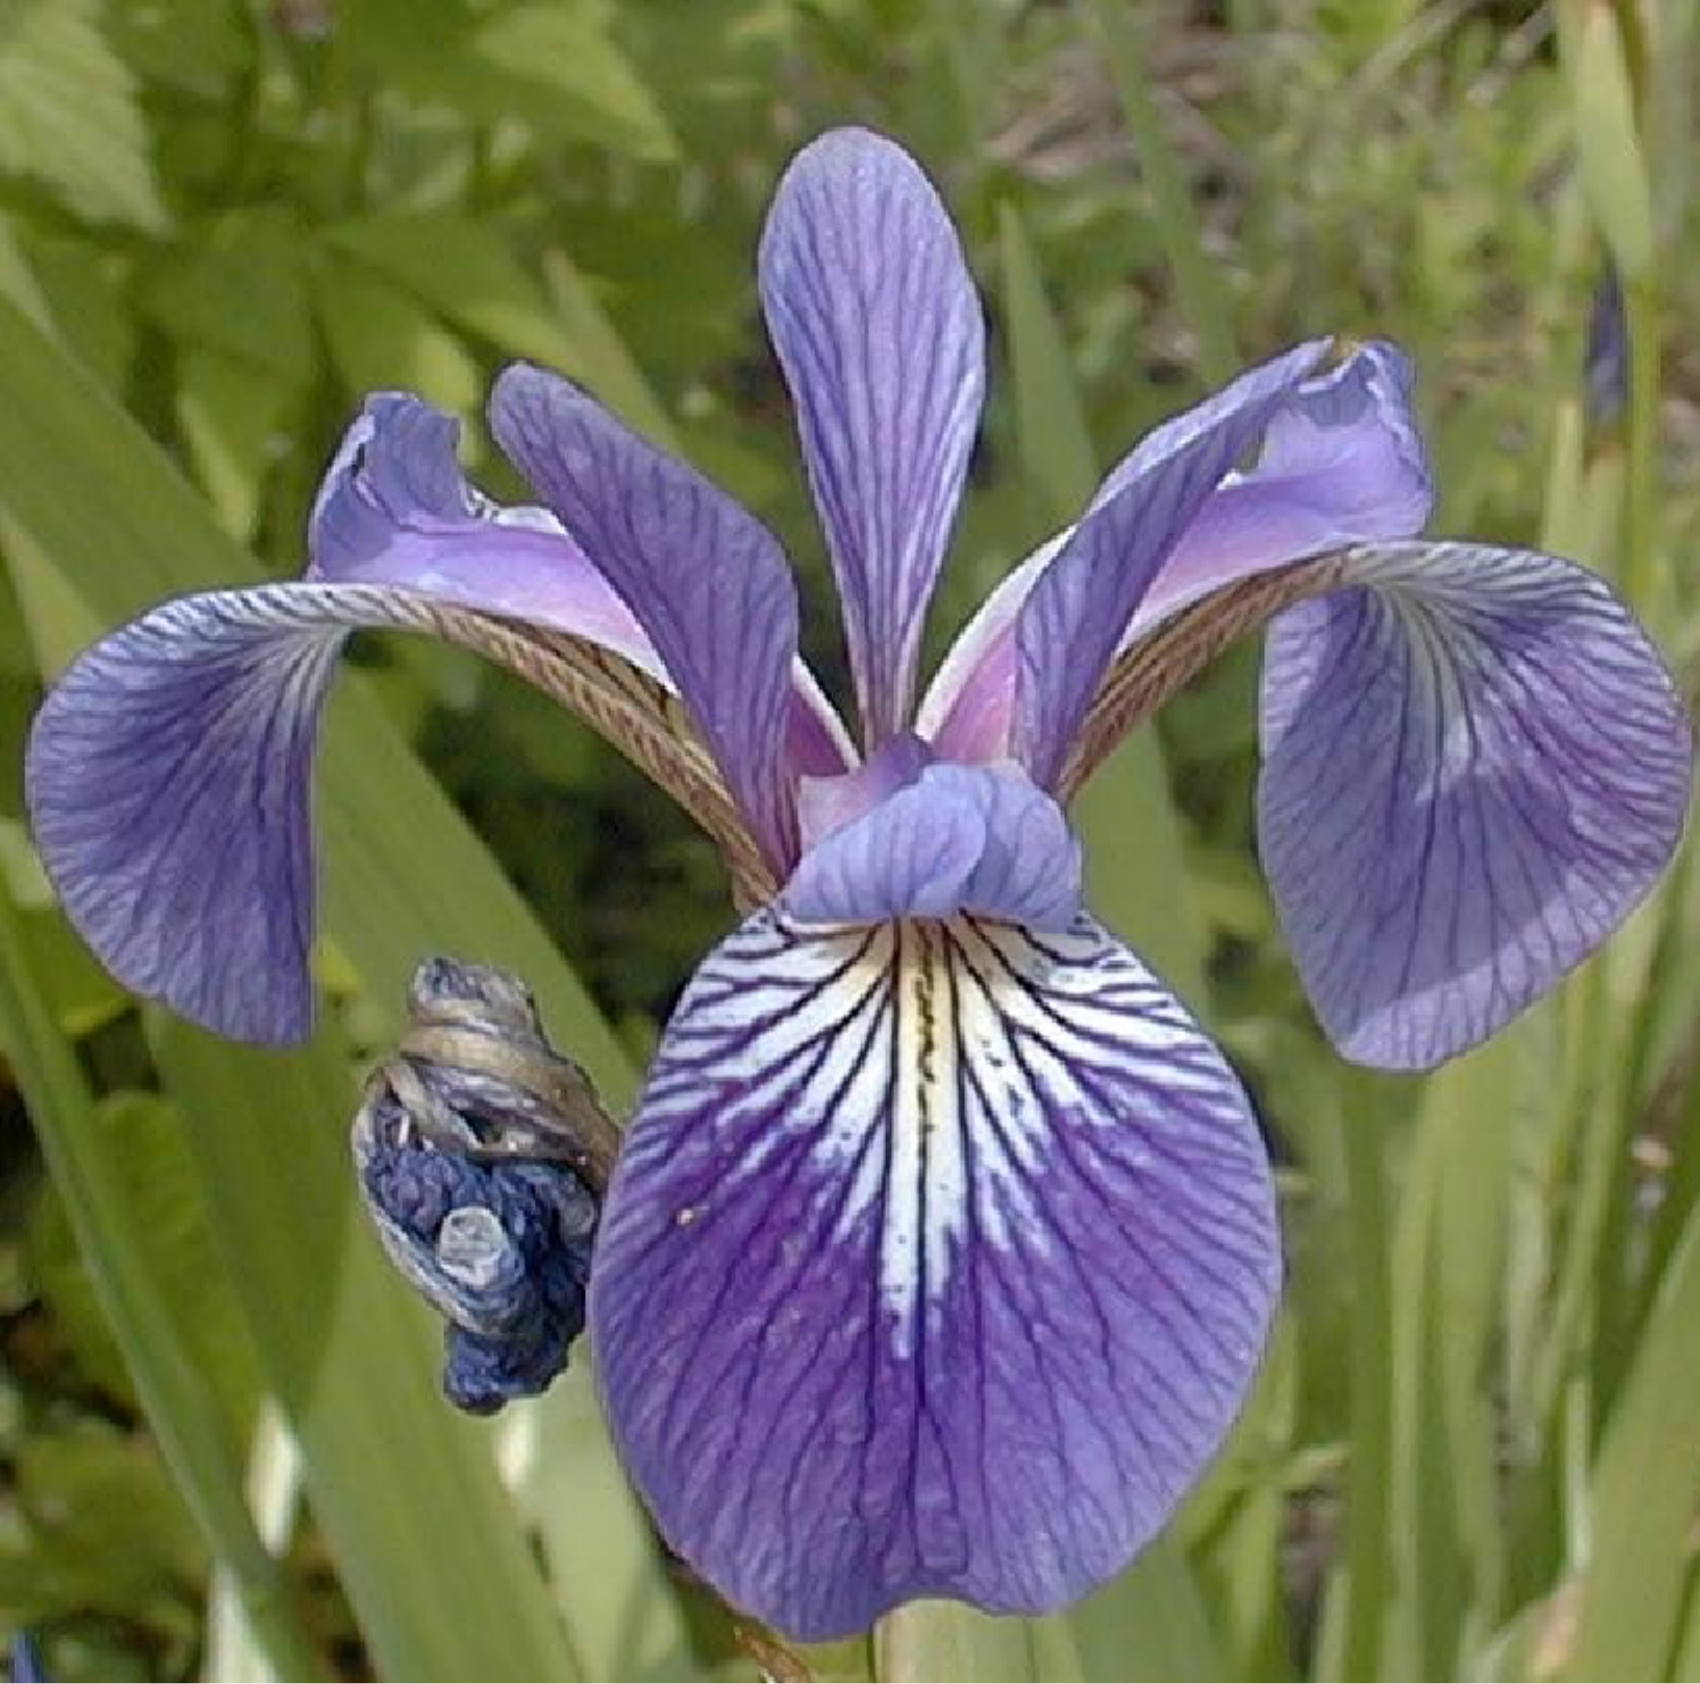
Here is how they look like in the wild (figure 1.1 from [Murphy, 2022])
setosa |
versicolor |
virginica |
|---|---|---|
|
|
|


MNIST dataset#
A classical dataset of handwritten digits.
from sklearn.datasets import fetch_openml

X, Y = fetch_openml('mnist_784', return_X_y=True, parser='auto')
X.shape, Y.shape
((70000, 784), (70000,))
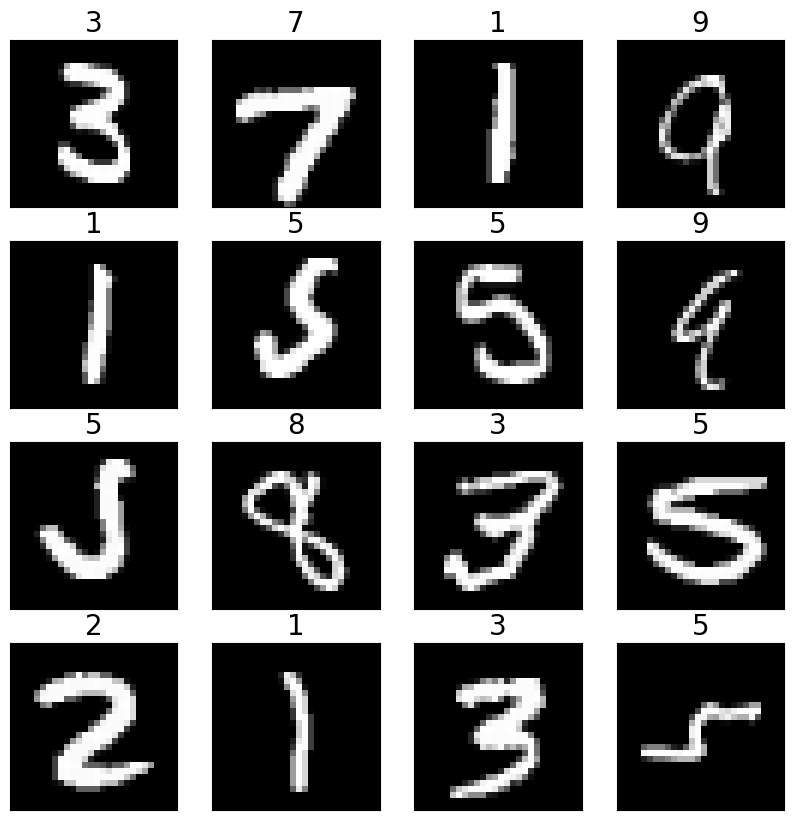
Q. What type of data is MNIST dataset?
One-hot encoding#
Before feeding categorical data into machine learning models, we need to convert them to a numerical scale. The standard way to do it is to use a one-hot encoding, also called a dummy encoding.
If a feature belongs to the final set \( \{1, \ldots, K\}\), it is encoded by a binary vector
Thus each categorical variable, which takes \(K\) different values, is converted to \(K\) numeric variables.
Note
In fact, it is enough to have \(K-1\) dummy variables since the value of \(\delta_K\) can be automatically deduced from the values of \(\delta_1, \ldots, \delta_{K-1}\).
Feature matrix#
A tabular numerical dataset can be represented as a feature matrix (or design matrix) \(\boldsymbol X\) of shape \(N\times D\) where
\(N\) — number of samples (rows)
\(D\) — number of features (columns)
Each sample \(\boldsymbol x_i\) is therefore represented by \(i\)-th row of the feature matrix \(\boldsymbol X\).
Important
A sample \(\boldsymbol x_i\) is a row vector with \(D\) coordinates. However, in linear algebra a vector is by default a column vector. That’s why in vector-matrix operations a training sample is often denoted as \(\boldsymbol x_i^\top\) to emphasize that it is a row.
TODO
Give other examples of datasets
Investigate the type of data in them (all columns of
irisdataset are numerical continuous, but this isn’t always the case)Describe the ways of fetching datasets in Python
Add info about image and text datasets (see also [Murphy, 2022], pp. 19—22)
Add more visualizations and quizzes