Types of ML#
Supervised Learning#
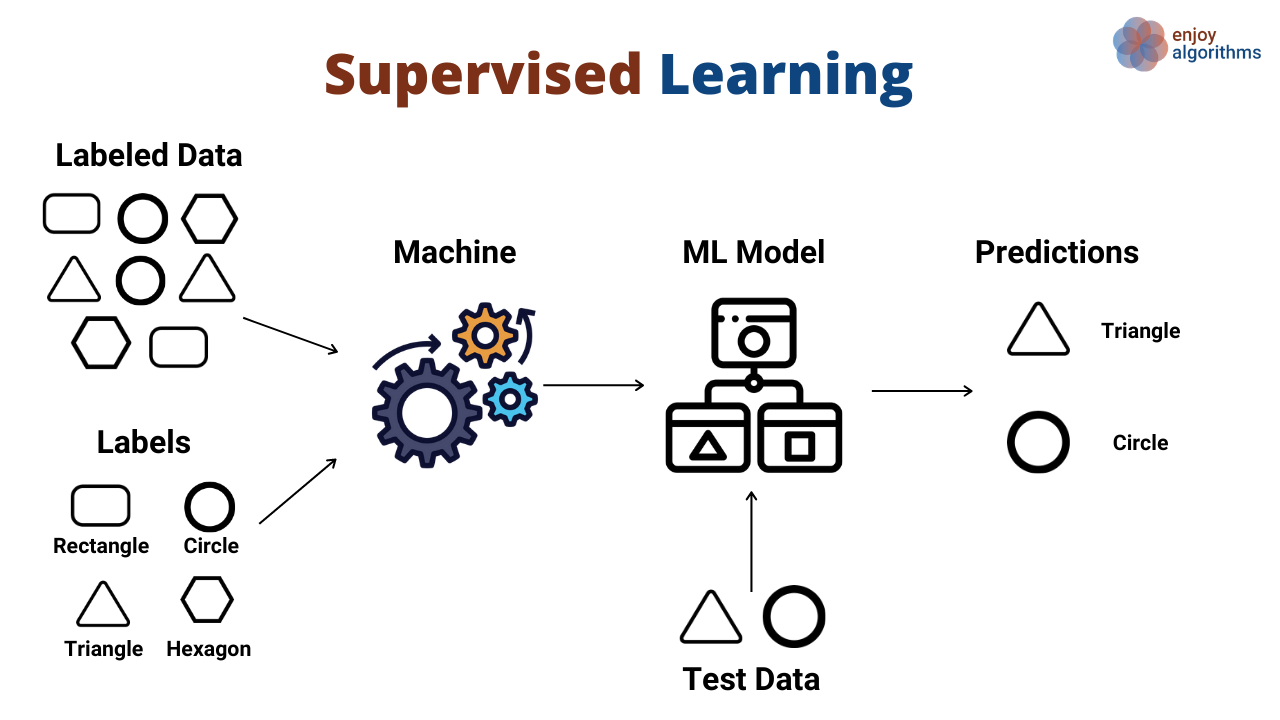
Supervised learning is a popular category of machine learning algorithms that involves training a model on labeled data to make predictions or decisions. In this approach, the algorithm learns from a given set of input-output pairs and uses this knowledge to predict the output for new, unseen inputs. The goal is to find a mapping function that generalizes well to unseen data.
Now put it more mathematically. Denote
training dataset \(\mathcal D = \{(\boldsymbol x_i, y_i)\}_{i=1}^N\);
features \(\boldsymbol x \in \mathcal X\) (usually \(\mathcal X = \mathbb R^D\));
targets (labels) \(y_i \in \mathcal Y\).
The goal of the supervised learning is to find a mapping \(f\colon \mathcal X \to \mathcal Y\) which would minimize the cost (loss) function
Note that the loss \(\ell(y_i, f(\boldsymbol x_i))\) is calculated separately on each training object \((\boldsymbol x_i, y_i)\), and then averaged over the whole training dataset.
Predictive model#
The mapping \(f_{\boldsymbol \theta}\colon \mathcal X \to \mathcal Y\) is usually taken from some parametric family
which is also called a model.
To fit a model means to find \(\boldsymbol \theta\) which minimizes the loss function
Classification#

Binary classification
\(\mathcal Y = \{0, 1\}\) or \(\mathcal Y = \{-1, +1\}\)
denote model predictions as \(\hat y_i = f_{\boldsymbol \theta}(\boldsymbol x_i)\)
typical loss function is misclassification rate
(1)#\[ \mathcal L(\boldsymbol \theta) = \frac 1N \sum\limits_{i=1}^N \big[y_i \ne \hat y_i\big]\](it actually equals one minus accuracy)
this loss is not a smooth function, that’s why they often predict which is treated as probability of class \(1\), and then use cross-entropy loss
Important
The value \(0\log 0 = 0\) by definition
Example
Suppose that true labels \(y\) and predictions \(\hat y\) are as follows:
\(y\) |
\(\hat y\) |
|---|---|
\(0\) |
\(0\) |
\(0\) |
\(1\) |
\(1\) |
\(0\) |
\(1\) |
\(1\) |
\(0\) |
\(0\) |
Calculate the missclassification rate and cross-entropy loss.
To avoid such problems with loss (2) models usually predict numbers from \((0, 1)\), which are interpreted as probabilities of class \(1\).
Multiclass classification
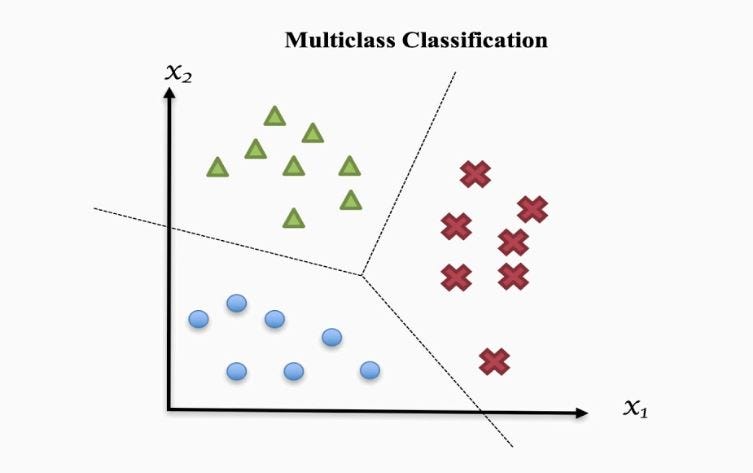
\(\mathcal Y = \{1, 2, \ldots, K\}\)
one-hot encoding: \(\boldsymbol y_i \in \{0, 1\}^K\), \(\sum\limits_{k=1}^K y_{ik} = 1\)
\(\hat{\boldsymbol y}_i = f_{\boldsymbol \theta}(\boldsymbol x_i) \in [0, 1]^K\) is now the vector of probabilities of belonging to class \(k\):
\[ \hat y_{ik} = \mathbb P(\boldsymbol x_i \in \text{ class }k) \]the cross-entropy loss is now written as follows:
Example
Classifying into \(3\) classes, model produces the following outputs:
\(y\) |
\(\boldsymbol {\hat y}\) |
|---|---|
\(0\) |
\((0.25, 0.4, 0.35)\) |
\(0\) |
\((0.5, 0.3, 0.2)\) |
\(1\) |
\(\big(\frac 12 - \frac 1{2\sqrt 2}, \frac 1{\sqrt 2}, \frac 12 - \frac 1{2\sqrt 2}\big)\) |
\(2\) |
\((0, 0, 1)\) |
Calculate the cross-entropy loss (3). Assume that log base is \(2\).
Regression#
\(\mathcal Y = \mathbb R\) or \(\mathcal Y = \mathbb R^n\)
the common choice is the quadratic loss
\[ \ell_2(y, \hat y) = (y - \hat y)^2 \]then the overall loss function — mean squared error:
\[ \mathcal L(\boldsymbol \theta) = \mathrm{MSE}(\boldsymbol \theta) = \frac 1N\sum\limits_{i=1}^N (y_i - f_{\boldsymbol \theta}(\boldsymbol x_i))^2 \]
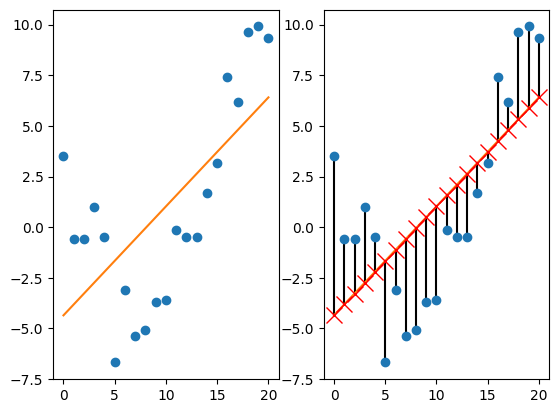
If the function \(f_{\boldsymbol \theta}(\boldsymbol x_i) = \boldsymbol {\theta^\top x}_i + b\) is linear, then the model is called linear regression.
Example of one-dimensional linear regression (figure 1.5 from [Murphy, 2022]):
Q. Suppose that training dataset has only one sample (\(N=1\)) and one feature (\(n=1\)). How would linear regression look like in this case? What if \(N=2\)?
Unsupervised learning#
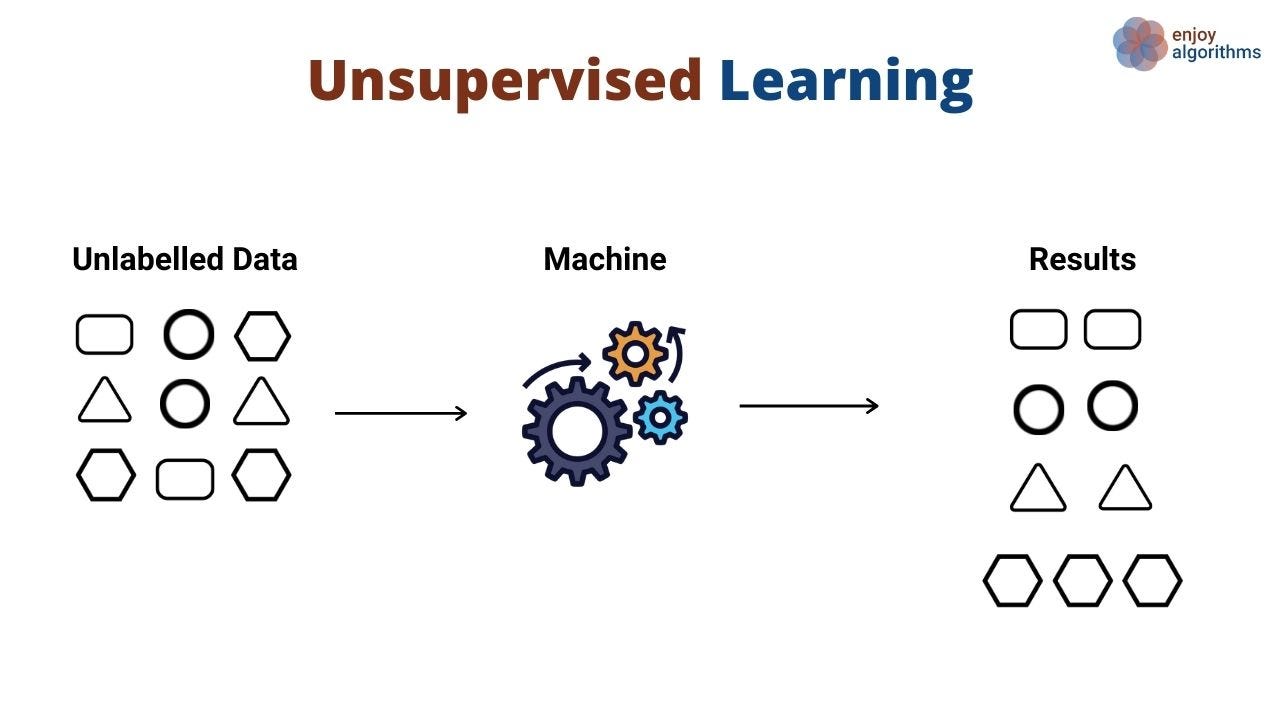
No targets anymore! The training dataset \(\mathcal D = (\boldsymbol x_i)_{i=1}^N\).
Examples of unsupervised learning tasks:
clustering
dimension reduction
discovering latent factors
searching for association rules
Clusterisation made on Iris dataset (figure 1.8 from [Murphy, 2022]):
---------------------------------------------------------------------------
FileNotFoundError                         Traceback (most recent call last)
File ~/.local/lib/python3.12/site-packages/matplotlib/texmanager.py:250, in TexManager._run_checked_subprocess(cls, command, tex, cwd)
    249 try:
--> 250     report = subprocess.check_output(
    251         command, cwd=cwd if cwd is not None else cls._texcache,
    252         stderr=subprocess.STDOUT)
    253 except FileNotFoundError as exc:

File /usr/local/lib/python3.12/subprocess.py:466, in check_output(timeout, *popenargs, **kwargs)
    464     kwargs['input'] = empty
--> 466 return run(*popenargs, stdout=PIPE, timeout=timeout, check=True,
    467            **kwargs).stdout

File /usr/local/lib/python3.12/subprocess.py:548, in run(input, capture_output, timeout, check, *popenargs, **kwargs)
    546     kwargs['stderr'] = PIPE
--> 548 with Popen(*popenargs, **kwargs) as process:
    549     try:

File /usr/local/lib/python3.12/subprocess.py:1026, in Popen.__init__(self, args, bufsize, executable, stdin, stdout, stderr, preexec_fn, close_fds, shell, cwd, env, universal_newlines, startupinfo, creationflags, restore_signals, start_new_session, pass_fds, user, group, extra_groups, encoding, errors, text, umask, pipesize, process_group)
   1023             self.stderr = io.TextIOWrapper(self.stderr,
   1024                     encoding=encoding, errors=errors)
-> 1026     self._execute_child(args, executable, preexec_fn, close_fds,
   1027                         pass_fds, cwd, env,
   1028                         startupinfo, creationflags, shell,
   1029                         p2cread, p2cwrite,
   1030                         c2pread, c2pwrite,
   1031                         errread, errwrite,
   1032                         restore_signals,
   1033                         gid, gids, uid, umask,
   1034                         start_new_session, process_group)
   1035 except:
   1036     # Cleanup if the child failed starting.

File /usr/local/lib/python3.12/subprocess.py:1950, in Popen._execute_child(self, args, executable, preexec_fn, close_fds, pass_fds, cwd, env, startupinfo, creationflags, shell, p2cread, p2cwrite, c2pread, c2pwrite, errread, errwrite, restore_signals, gid, gids, uid, umask, start_new_session, process_group)
   1949         err_msg = os.strerror(errno_num)
-> 1950     raise child_exception_type(errno_num, err_msg, err_filename)
   1951 raise child_exception_type(err_msg)

FileNotFoundError: [Errno 2] No such file or directory: 'latex'

The above exception was the direct cause of the following exception:

RuntimeError                              Traceback (most recent call last)
File ~/.local/lib/python3.12/site-packages/IPython/core/formatters.py:340, in BaseFormatter.__call__(self, obj)
    338     pass
    339 else:
--> 340     return printer(obj)
    341 # Finally look for special method names
    342 method = get_real_method(obj, self.print_method)

File ~/.local/lib/python3.12/site-packages/IPython/core/pylabtools.py:152, in print_figure(fig, fmt, bbox_inches, base64, **kwargs)
    149     from matplotlib.backend_bases import FigureCanvasBase
    150     FigureCanvasBase(fig)
--> 152 fig.canvas.print_figure(bytes_io, **kw)
    153 data = bytes_io.getvalue()
    154 if fmt == 'svg':

File ~/.local/lib/python3.12/site-packages/matplotlib/backend_bases.py:2164, in FigureCanvasBase.print_figure(self, filename, dpi, facecolor, edgecolor, orientation, format, bbox_inches, pad_inches, bbox_extra_artists, backend, **kwargs)
   2161     # we do this instead of `self.figure.draw_without_rendering`
   2162     # so that we can inject the orientation
   2163     with getattr(renderer, "_draw_disabled", nullcontext)():
-> 2164         self.figure.draw(renderer)
   2165 if bbox_inches:
   2166     if bbox_inches == "tight":

File ~/.local/lib/python3.12/site-packages/matplotlib/artist.py:95, in _finalize_rasterization.<locals>.draw_wrapper(artist, renderer, *args, **kwargs)
     93 @wraps(draw)
     94 def draw_wrapper(artist, renderer, *args, **kwargs):
---> 95     result = draw(artist, renderer, *args, **kwargs)
     96     if renderer._rasterizing:
     97         renderer.stop_rasterizing()

File ~/.local/lib/python3.12/site-packages/matplotlib/artist.py:72, in allow_rasterization.<locals>.draw_wrapper(artist, renderer)
     69     if artist.get_agg_filter() is not None:
     70         renderer.start_filter()
---> 72     return draw(artist, renderer)
     73 finally:
     74     if artist.get_agg_filter() is not None:

File ~/.local/lib/python3.12/site-packages/matplotlib/figure.py:3154, in Figure.draw(self, renderer)
   3151         # ValueError can occur when resizing a window.
   3153 self.patch.draw(renderer)
-> 3154 mimage._draw_list_compositing_images(
   3155     renderer, self, artists, self.suppressComposite)
   3157 for sfig in self.subfigs:
   3158     sfig.draw(renderer)

File ~/.local/lib/python3.12/site-packages/matplotlib/image.py:132, in _draw_list_compositing_images(renderer, parent, artists, suppress_composite)
    130 if not_composite or not has_images:
    131     for a in artists:
--> 132         a.draw(renderer)
    133 else:
    134     # Composite any adjacent images together
    135     image_group = []

File ~/.local/lib/python3.12/site-packages/matplotlib/artist.py:72, in allow_rasterization.<locals>.draw_wrapper(artist, renderer)
     69     if artist.get_agg_filter() is not None:
     70         renderer.start_filter()
---> 72     return draw(artist, renderer)
     73 finally:
     74     if artist.get_agg_filter() is not None:

File ~/.local/lib/python3.12/site-packages/matplotlib/axes/_base.py:3070, in _AxesBase.draw(self, renderer)
   3067 if artists_rasterized:
   3068     _draw_rasterized(self.figure, artists_rasterized, renderer)
-> 3070 mimage._draw_list_compositing_images(
   3071     renderer, self, artists, self.figure.suppressComposite)
   3073 renderer.close_group('axes')
   3074 self.stale = False

File ~/.local/lib/python3.12/site-packages/matplotlib/image.py:132, in _draw_list_compositing_images(renderer, parent, artists, suppress_composite)
    130 if not_composite or not has_images:
    131     for a in artists:
--> 132         a.draw(renderer)
    133 else:
    134     # Composite any adjacent images together
    135     image_group = []

File ~/.local/lib/python3.12/site-packages/matplotlib/artist.py:72, in allow_rasterization.<locals>.draw_wrapper(artist, renderer)
     69     if artist.get_agg_filter() is not None:
     70         renderer.start_filter()
---> 72     return draw(artist, renderer)
     73 finally:
     74     if artist.get_agg_filter() is not None:

File ~/.local/lib/python3.12/site-packages/matplotlib/axis.py:1388, in Axis.draw(self, renderer, *args, **kwargs)
   1385 renderer.open_group(__name__, gid=self.get_gid())
   1387 ticks_to_draw = self._update_ticks()
-> 1388 tlb1, tlb2 = self._get_ticklabel_bboxes(ticks_to_draw, renderer)
   1390 for tick in ticks_to_draw:
   1391     tick.draw(renderer)

File ~/.local/lib/python3.12/site-packages/matplotlib/axis.py:1315, in Axis._get_ticklabel_bboxes(self, ticks, renderer)
   1313 if renderer is None:
   1314     renderer = self.figure._get_renderer()
-> 1315 return ([tick.label1.get_window_extent(renderer)
   1316          for tick in ticks if tick.label1.get_visible()],
   1317         [tick.label2.get_window_extent(renderer)
   1318          for tick in ticks if tick.label2.get_visible()])

File ~/.local/lib/python3.12/site-packages/matplotlib/text.py:956, in Text.get_window_extent(self, renderer, dpi)
    951     raise RuntimeError(
    952         "Cannot get window extent of text w/o renderer. You likely "
    953         "want to call 'figure.draw_without_rendering()' first.")
    955 with cbook._setattr_cm(self.figure, dpi=dpi):
--> 956     bbox, info, descent = self._get_layout(self._renderer)
    957     x, y = self.get_unitless_position()
    958     x, y = self.get_transform().transform((x, y))

File ~/.local/lib/python3.12/site-packages/matplotlib/text.py:373, in Text._get_layout(self, renderer)
    370 ys = []
    372 # Full vertical extent of font, including ascenders and descenders:
--> 373 _, lp_h, lp_d = _get_text_metrics_with_cache(
    374     renderer, "lp", self._fontproperties,
    375     ismath="TeX" if self.get_usetex() else False, dpi=self.figure.dpi)
    376 min_dy = (lp_h - lp_d) * self._linespacing
    378 for i, line in enumerate(lines):

File ~/.local/lib/python3.12/site-packages/matplotlib/text.py:69, in _get_text_metrics_with_cache(renderer, text, fontprop, ismath, dpi)
     66 """Call ``renderer.get_text_width_height_descent``, caching the results."""
     67 # Cached based on a copy of fontprop so that later in-place mutations of
     68 # the passed-in argument do not mess up the cache.
---> 69 return _get_text_metrics_with_cache_impl(
     70     weakref.ref(renderer), text, fontprop.copy(), ismath, dpi)

File ~/.local/lib/python3.12/site-packages/matplotlib/text.py:77, in _get_text_metrics_with_cache_impl(renderer_ref, text, fontprop, ismath, dpi)
     73 @functools.lru_cache(4096)
     74 def _get_text_metrics_with_cache_impl(
     75         renderer_ref, text, fontprop, ismath, dpi):
     76     # dpi is unused, but participates in cache invalidation (via the renderer).
---> 77     return renderer_ref().get_text_width_height_descent(text, fontprop, ismath)

File ~/.local/lib/python3.12/site-packages/matplotlib/backends/backend_svg.py:1287, in RendererSVG.get_text_width_height_descent(self, s, prop, ismath)
   1285 def get_text_width_height_descent(self, s, prop, ismath):
   1286     # docstring inherited
-> 1287     return self._text2path.get_text_width_height_descent(s, prop, ismath)

File ~/.local/lib/python3.12/site-packages/matplotlib/textpath.py:52, in TextToPath.get_text_width_height_descent(self, s, prop, ismath)
     49 fontsize = prop.get_size_in_points()
     51 if ismath == "TeX":
---> 52     return TexManager().get_text_width_height_descent(s, fontsize)
     54 scale = fontsize / self.FONT_SCALE
     56 if ismath:

File ~/.local/lib/python3.12/site-packages/matplotlib/texmanager.py:363, in TexManager.get_text_width_height_descent(cls, tex, fontsize, renderer)
    361 if tex.strip() == '':
    362     return 0, 0, 0
--> 363 dvifile = cls.make_dvi(tex, fontsize)
    364 dpi_fraction = renderer.points_to_pixels(1.) if renderer else 1
    365 with dviread.Dvi(dvifile, 72 * dpi_fraction) as dvi:

File ~/.local/lib/python3.12/site-packages/matplotlib/texmanager.py:295, in TexManager.make_dvi(cls, tex, fontsize)
    293     with TemporaryDirectory(dir=cwd) as tmpdir:
    294         tmppath = Path(tmpdir)
--> 295         cls._run_checked_subprocess(
    296             ["latex", "-interaction=nonstopmode", "--halt-on-error",
    297              f"--output-directory={tmppath.name}",
    298              f"{texfile.name}"], tex, cwd=cwd)
    299         (tmppath / Path(dvifile).name).replace(dvifile)
    300 return dvifile

File ~/.local/lib/python3.12/site-packages/matplotlib/texmanager.py:254, in TexManager._run_checked_subprocess(cls, command, tex, cwd)
    250     report = subprocess.check_output(
    251         command, cwd=cwd if cwd is not None else cls._texcache,
    252         stderr=subprocess.STDOUT)
    253 except FileNotFoundError as exc:
--> 254     raise RuntimeError(
    255         f'Failed to process string with tex because {command[0]} '
    256         'could not be found') from exc
    257 except subprocess.CalledProcessError as exc:
    258     raise RuntimeError(
    259         '{prog} was not able to process the following string:\n'
    260         '{tex!r}\n\n'
   (...)
    267             exc=exc.output.decode('utf-8', 'backslashreplace'))
    268         ) from None

RuntimeError: Failed to process string with tex because latex could not be found
<Figure size 640x480 with 1 Axes>
Semisupervised learning#
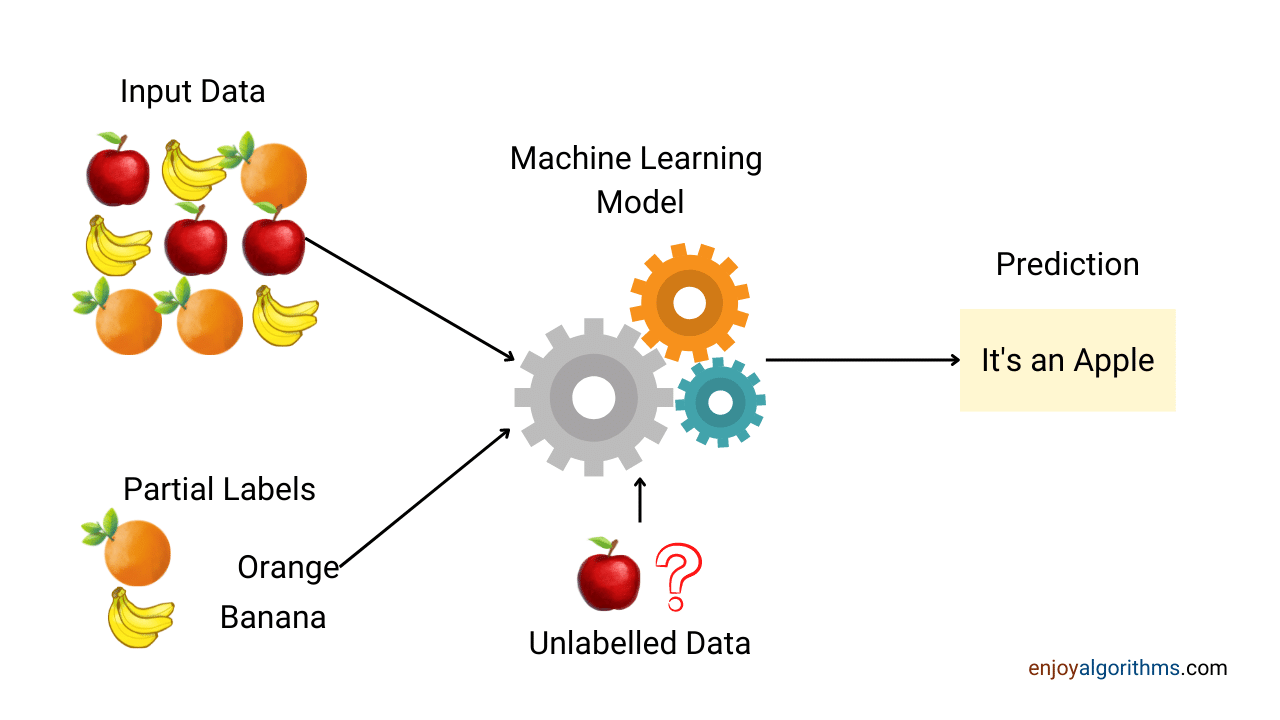
Semi-supervised learning comes into play when you have a dataset that contains both labeled and unlabeled data. Semi-supervised learning is often used in scenarios where obtaining labeled data is expensive, time-consuming, or otherwise challenging.
Reinforcement learning#
Reinforcement learning is a machine learning paradigm where an agent learns to make sequential decisions by interacting with an environment. It aims to maximize a cumulative reward signal by exploring actions and learning optimal strategies through trial and error.
TODO
Pictures from the internet is a temporary solution, try to create original ones
Add a subsection about dummy model (move something from the next chapter if necessary)
Write more about ML beyond supervised learning
Convert \(N\) and \(D\) into \(n\) and \(d\)