Pathway Analysis Kidney
Ann Wells
April 23, 2023
Introduction
This dataset contains nine tissues (heart, hippocampus, hypothalamus, kidney, liver, prefrontal cortex, skeletal muscle, small intestine, and spleen) from C57BL/6J mice that were fed 2-deoxyglucose (6g/L) through their drinking water for 96hrs or 4wks. 96hr mice were given their 2DG treatment 2 weeks after the other cohort started the 4 week treatment. The organs from the mice were harvested and processed for metabolomics and transcriptomics. The data in this document pertains to the transcriptomics data only. The counts that were used were FPKM normalized before being log transformed. It was determined that sample A113 had low RNAseq quality and through further analyses with PCA, MA plots, and clustering was an outlier and will be removed for the rest of the analyses performed. This document will determine which pathways are significantly altered by each module.
needed.packages <- c("tidyverse", "here", "functional", "gplots", "dplyr", "GeneOverlap", "R.utils", "reshape2","magrittr","data.table", "RColorBrewer","preprocessCore", "ARTool","emmeans", "phia", "gprofiler2","rlist", "plotly","downloadthis")
for(i in 1:length(needed.packages)){library(needed.packages[i], character.only = TRUE)}

source(here("source_files","WGCNA_source.R"))
Module Bar plot
This bar plot shows the number of genes in each module.
modules<-read.csv(here("Data","Kidney","log.tdata.FPKM.sample.info.subset.kidney.WGCNA.module.membership.csv"), header=T)

module_barplot(modules)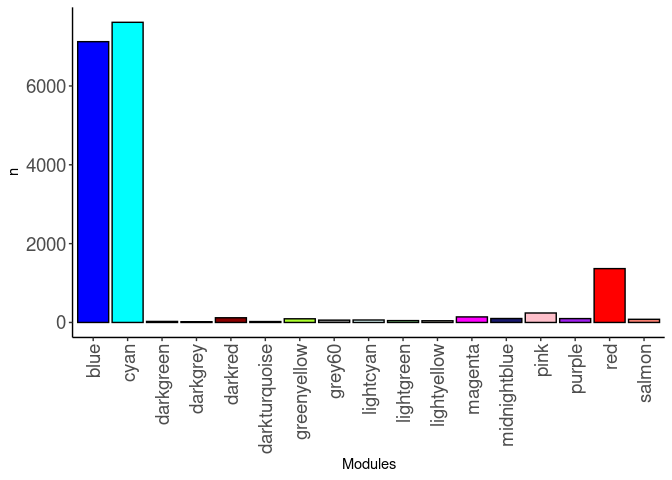
Pathway Analysis
Pathway analysis was performed using the gprofiler package. Genes associated with each module were compared against KEGG and REACTOME databases. Modules that did not contain any significant pathways are blank.
Pathway plots
WGCNA<-read.table(here("Data","Kidney","log.tdata.FPKM.sample.info.subset.kidney.WGCNA.module.membership.csv"), header=T)

Data_setup(WGCNA, file = "Annotated_genes_in_kidney_WGCNA_Chang_B6_96hr_4wk.RData", folder="Kidney")

Matched<-readRDS(here("Data","Kidney","Annotated_genes_in_kidney_WGCNA_Chang_B6_96hr_4wk.RData"))

pathways(Matched, pathwayfile = "Chang_B6_96hr_4wk_gprofiler_pathway_annotation_list_kidney_WGCNA.RData", genefile = "Chang_B6_96hr_4wk_gprofiler_gene_annotation_list_kidney_WGCNA.RData", folder = "Kidney")

WGCNA.pathway <-readRDS(here("Data","Kidney","Chang_B6_96hr_4wk_gprofiler_pathway_annotation_list_kidney_WGCNA.RData"))
blue
cyan
darkgreen
darkgrey
darkred
darkturquoise
greenyellow
grey60
lightcyan
lightgreen
lightyellow
magenta
midnightblue
pink
purple
red
salmon
Table of Pathways
WGCNA.pathway <- readRDS(here("Data","Kidney","Chang_B6_96hr_4wk_gprofiler_pathway_annotation_list_kidney_WGCNA.RData"))Blue
if(class(WGCNA.pathway[[1]]) == "numeric"){
   print("No pathways significantly overrepresented")
   } else {DT.table.path(WGCNA.pathway[[1]][c(11,3:6)])}
Cyan
if(class(WGCNA.pathway[[2]]) == "numeric"){
   print("No pathways significantly overrepresented")
   } else {DT.table.path(WGCNA.pathway[[2]][c(11,3:6)])}
Darkgreen
if(class(WGCNA.pathway[[3]]) == "numeric"){
   print("No pathways significantly overrepresented")
   } else {DT.table.path(WGCNA.pathway[[3]][c(11,3:6)])}
Darkgrey
if(class(WGCNA.pathway[[4]]) == "numeric"){
   print("No pathways significantly overrepresented")
   } else {DT.table.path(WGCNA.pathway[[4]][c(11,3:6)])}
[1] “No pathways significantly overrepresented”
Darkred
if(class(WGCNA.pathway[[5]]) == "numeric"){
   print("No pathways significantly overrepresented")
   } else {DT.table.path(WGCNA.pathway[[5]][c(11,3:6)])}
Darkturquoise
if(class(WGCNA.pathway[[6]]) == "numeric"){
   print("No pathways significantly overrepresented")
   } else {DT.table.path(WGCNA.pathway[[6]][c(11,3:6)])}
Greenyellow
if(class(WGCNA.pathway[[7]]) == "numeric"){
   print("No pathways significantly overrepresented")
   } else {DT.table.path(WGCNA.pathway[[7]][c(11,3:6)])}
[1] “No pathways significantly overrepresented”
Grey60
if(class(WGCNA.pathway[[8]]) == "numeric"){
   print("No pathways significantly overrepresented")
   } else {DT.table.path(WGCNA.pathway[[8]][c(11,3:6)])}
Lightcyan
if(class(WGCNA.pathway[[9]]) == "numeric"){
   print("No pathways significantly overrepresented")
   } else {DT.table.path(WGCNA.pathway[[9]][c(11,3:6)])}
[1] “No pathways significantly overrepresented”
Lightgreen
if(class(WGCNA.pathway[[10]]) == "numeric"){
   print("No pathways significantly overrepresented")
   } else {DT.table.path(WGCNA.pathway[[10]][c(11,3:6)])}
Lightyellow
if(class(WGCNA.pathway[[11]]) == "numeric"){
   print("No pathways significantly overrepresented")
   } else {DT.table.path(WGCNA.pathway[[11]][c(11,3:6)])}
Magenta
if(class(WGCNA.pathway[[12]]) == "numeric"){
   print("No pathways significantly overrepresented")
   } else {DT.table.path(WGCNA.pathway[[12]][c(11,3:6)])}
Midnightblue
if(class(WGCNA.pathway[[13]]) == "numeric"){
   print("No pathways significantly overrepresented")
   } else {DT.table.path(WGCNA.pathway[[13]][c(11,3:6)])}
[1] “No pathways significantly overrepresented”
Pink
if(class(WGCNA.pathway[[14]]) == "numeric"){
   print("No pathways significantly overrepresented")
   } else {DT.table.path(WGCNA.pathway[[14]][c(11,3:6)])}
Purple
if(class(WGCNA.pathway[[15]]) == "numeric"){
   print("No pathways significantly overrepresented")
   } else {DT.table.path(WGCNA.pathway[[15]][c(11,3:6)])}
[1] “No pathways significantly overrepresented”
Red
if(class(WGCNA.pathway[[16]]) == "numeric"){
   print("No pathways significantly overrepresented")
   } else {DT.table.path(WGCNA.pathway[[16]][c(11,3:6)])}
Salmon
if(class(WGCNA.pathway[[17]]) == "numeric"){
   print("No pathways significantly overrepresented")
   } else {DT.table.path(WGCNA.pathway[[17]][c(11,3:6)])}
Pathway Frequency
WGCNA.pathway <- readRDS(here("Data","Kidney","Chang_B6_96hr_4wk_gprofiler_pathway_annotation_list_kidney_WGCNA.RData"))

#pdf("Counts_of_each_pathway_identified_within_kidney.pdf")
count <- count.pathways(WGCNA.pathway)
[1] 547 [1] 477
#dev.off()Frequency Table
DT.table.freq(count)Frequency Plot
  #pdf("Counts_of_each_pathway_identified_within_jaccard_index.pdf")
  p <- ggplot(data=count,aes(x=list.pathways,y=Freq))
  p <- p + geom_bar(color="black", fill=colorRampPalette(brewer.pal(n = 12, name = "Paired"))(length(count[,1])), stat="identity",position="identity") + theme_classic()
  p <- p + theme(axis.text.x = element_text(angle = 90, hjust =1, size = 3)) + scale_x_discrete(labels=count$list.pathways) + xlab("Modules")
  print(p)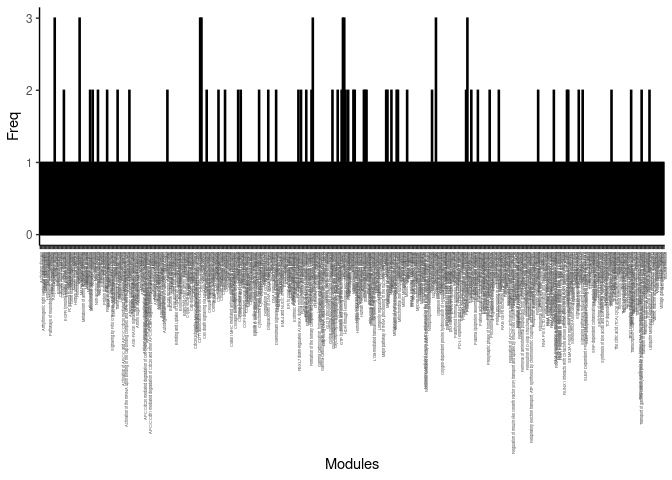
#dev.off()Analysis performed by Ann Wells
The Carter Lab The Jackson Laboratory 2023
ann.wells@jax.org