Summary Prefrontal Cortex
Ann Wells
April 23, 2023
Summary
needed.packages <- c("tidyverse", "here", "functional", "gplots", "dplyr", "GeneOverlap", "R.utils", "reshape2","magrittr","data.table", "RColorBrewer","preprocessCore", "ARTool","emmeans", "phia", "gProfileR","rlist", "pheatmap")
for(i in 1:length(needed.packages)){library(needed.packages[i], character.only = TRUE)}

source(here("source_files","WGCNA_source.R"))
There were 16 samples (4 per time and treatment). Mice were fed 2DG (6g/L) or nothing in their water for 96hrs or 2 weeks. WGCNA analysis was performed to determine gene clustering. A soft-thresholding power was chosen so that the scale-free topology correlation attempts to hit 0.9. The power chosen for prefrontal cortex was 15, which allowed the correlations to hover around 0.80. This power clustered the genes into 263 modules originally, however, modules that were highly correlated (0.75 or higher) were further merged together to create 36 modules.
modules<-read.csv(here("Data","Prefrontal Cortex","log.tdata.FPKM.sample.info.subset.prefrontal.cortex.WGCNA.module.membership.csv"), header=T)

module_barplot(modules)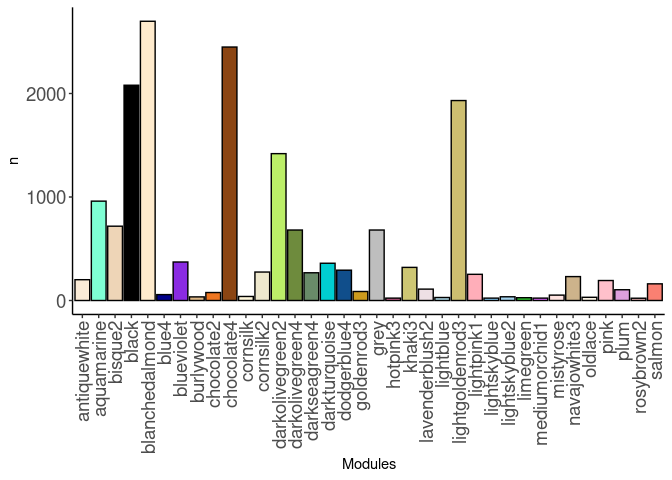
Pathways were assessed for each module. Out of 36 modules, only 24 modules had pathway hits of any kind. The pathways that had the highest frequency across modules were metabolism of RNA and RNA polymerase II transcription, as well as glucose metabolism. The aquamarine, bisque2, black, darkolivegreen2, darkolivegreen4, hotpink3, and salmon modules all contained these pathways.
Aquamarine
14 Pathways were identified in the Aquamarine module. The pathways were related to mRNA, gene expression and transcription, SUMOylation, and RNA polymerase II.
Bisque2
15 modules were identified in the Bisque2 module. The pathways were related to gene transcription, protein processing in the ER, RNA polymerase II, PERK, mRNA, and RNA transport.
Black
120 genes were identified in the Black module. The pathways were related to APC, cell cycle, DNA, metabolism, mitochondrial metabolism, nonsense mediated decay, oxidative phosphorylation, rRNA, RNA polymerase, TCA cycle, transcriptional regulation, translesion, and ubiquitin.
Blanchedalmond
9 pathways were identified in the Blanchedalmond module. The pathways were related to various aspects of cancer, such as ECM-interaction, calcium signaling, wnt signaling, and tight junctions.
Blueviolet
6 pathways were identified in the Blueviolet module. The pathways were related to all aspects of collagen.
Chocolate4
169 pathways were identified in the Chocolate4 module. The pathways were related to AMPK signaling, autophagy, axon guidance, cAMP, cardiac function, chemokine signaling, cardiac function, estrogen, glycosaminoglycan biosynthesis, glucagon signaling, insulin, mTOR signaling, MAPK, MyD88, neuronal, cancer, platelets, signaling, T cell receptors, Th1 and 2 differentiation, Th17 differentiation, toll like receptors, and vasopressin and VEGF.
Cornsilk
2 pathways were identified in the Cornsilk module. The pathways were Th1 and Th2 cell differentiation and Th17 cell differentiation.
Cornsilk2
120 pathways were identified in the Cornsilk2 module. The pathways were related to adaptive immunity, NF-kappa B, APC, antigen processing-cross presentation, cell cycle, cellular responses, interleukin-1, MAPK, p53, signaling, transcriptional regulation, and ubiquitin.
Darkolivegreen2
35 pathways were identified in the Darkolivegreen2 module. The pathways were related to neurodegenerative diseases, metabolism, mitochondrial metabolism, oxidative phosphorylation, post-translational protein modification, respiratory electron transport, TCA cycle, thermogenesis, and translation.
Darkolivegreen4
35 pathways were identified in the Darkolivegreen4 module. The pathways were related to mRNA, glucose metabolism, SUMOylation, and transport.
Darkturquoise
27 pathways were identified in the Darkturquoise module. The pathways were related to cAMP, GPCR, cortisol, cardiac function, platelets, purine metabolism, MAPK, and signal transduction.
Dodgerblue4
18 pathways were identified in the Dodgerblue4 module. The pathways were related to oxidative phosphorylation, neurodegenerative disease, RNA transport, TCA cycle, thermogenesis, and vesicle-mediate transport.
Grey
5 pathways were identified in the Grey module. The pathways were related to gamma-carboxylation and cell cycle.
Hotpink3
7 pathways were identified in the Hotpink3 module. The pathways were related to glycolysis, gluconeogenesis, carbon metabolism, amino acids, and glucose metabolism.
Khaki3
34 pathways were identified in the Khaki3 module. The pathways were related to collagen, extracellular matrix, MET, protein digestion and absorption, smooth muscle contraction, and TGF-beta signaling.
Lightblue
2 pathways were identified in the Lightblue module. The pathways were Metabolism of angiotensinogen to angiotensins and peptide hormone metabolism.
Lightgoldenrod3
44 pathways were identified in the Lightgoldenrod3 module. The pathways were related to MAPK, mTOR, cancer, B cell receptor signaling, protein processing in the ER, VEGF signaling, T cell receptor signaling, and vitamin digestion and absorption.
Lightpink1
11 pathways were identified in the Lightpink1 module. The pathways were related to cancer, MAPK signaling, type 2 diabetes, osteoclast differentiation, and wnt signaling.
Lightskyblue
7 pathways were identified in the Lightskyblue module. The pathways were related to estrogen, steroids, and vitamin D metabolism.
Mediumorchid1
9 pathways were identified in the Mediumorchid1 module. The pathways were related to digestion, carbohydrate digestion, pancreatic and salivary secretions.
Pink
37 pathways were identified in the Pink module. The pathways were related to innate immunity, natural killer cells, neutrophils, NF-kappa B, NOD-like receptors, toll like receptors, and osteoclast differentiation.
Salmon
46 pathways were identified in the Salmon module. The pathways were related to amino acid metabolism, AMPK, drug metabolism, fatty acid metabolism, gluconeogensis, glycolysis, gluconeogenesis, metabolism, sodium channels, and transport.
tdata.FPKM.sample.info <- readRDS(here("Data","20190406_RNAseq_B6_4wk_2DG_counts_phenotypes.RData"))

tdata.FPKM <- readRDS(here("Data","20190406_RNAseq_B6_4wk_2DG_counts_numeric.RData"))

log.tdata.FPKM <- log(tdata.FPKM + 1)
log.tdata.FPKM <- as.data.frame(log.tdata.FPKM)

log.tdata.FPKM.sample.info <- cbind(log.tdata.FPKM, tdata.FPKM.sample.info[,27238:27240])

log.tdata.FPKM.sample.info <- log.tdata.FPKM.sample.info %>% rownames_to_column() %>% filter(rowname != "A113") %>% column_to_rownames()

log.tdata.FPKM.subset <- log.tdata.FPKM[,colMeans(log.tdata.FPKM != 0) > 0.5]

log.tdata.FPKM.subset <- log.tdata.FPKM.subset %>% rownames_to_column() %>% filter(rowname != "A113") %>% column_to_rownames()

log.tdata.FPKM.sample.info.subset.prefrontal.cortex <- log.tdata.FPKM.sample.info %>% rownames_to_column() %>% filter(Tissue == "Pre-frontal Cortex") %>% column_to_rownames()

log.tdata.FPKM.subset <- subset(log.tdata.FPKM.sample.info.subset.prefrontal.cortex, select = -c(Time,Treatment,Tissue))

WGCNA.pathway <-readRDS(here("Data","Prefrontal Cortex","Chang_B6_96hr_4wk_gprofiler_pathway_annotation_list_prefrontal_cortex_WGCNA.RData"))

Matched<-readRDS(here("Data","Prefrontal Cortex","Annotated_genes_in_prefrontal_cortex_WGCNA_Chang_B6_96hr_4wk.RData"))


module.names <- Matched$X..Module.
name <- str_split(module.names,"_")
samples <-c()
for(i in 1:length(name)){
samples[[i]] <- name[[i]][2]
}
name <- str_split(samples,"\"")
name <- unlist(name)

Treatment <- unclass(as.factor(log.tdata.FPKM.sample.info.subset.prefrontal.cortex[,27238]))
Time <- unclass(as.factor(log.tdata.FPKM.sample.info.subset.prefrontal.cortex[,27237]))
Treat.Time <- paste0(Treatment, Time)
phenotype <- data.frame(cbind(Treatment, Time, Treat.Time))

nSamples <- nrow(log.tdata.FPKM.sample.info.subset.prefrontal.cortex)

MEs0 <- read.csv(here("Data","Prefrontal Cortex","log.tdata.FPKM.sample.info.subset.prefrontal.cortex.WGCNA.module.eigens.csv"),header = T, row.names = 1)
name <- str_split(names(MEs0),"_")
samples <-c()
for(i in 1:length(name)){
samples[[i]] <- name[[i]][2]
}
name <- str_split(samples,"\"")
name <- unlist(name)
colnames(MEs0) <-name
MEs <- orderMEs(MEs0)
moduleTraitCor <- cor(MEs, phenotype, use = "p");
moduleTraitPvalue <- corPvalueStudent(moduleTraitCor, nSamples)
Relationship between Modules and Traits
#sizeGrWindow(10,6)
# Will display correlations and their p-values
textMatrix = paste(signif(moduleTraitCor, 2), "\n(",
                        signif(moduleTraitPvalue, 1), ")", sep = "");
dim(textMatrix) = dim(moduleTraitCor)

# Display the correlation values within a heatmap plot
heat <- pheatmap(moduleTraitCor, main = paste("Module-trait relationships"), display_numbers = textMatrix,color=colorRampPalette(brewer.pal(n = 11, name = "Paired"))(10), cluster_rows = F, cluster_cols = F, fontsize_number = 4, angle_col = 45, number_color = "black", border_color = "white")
heat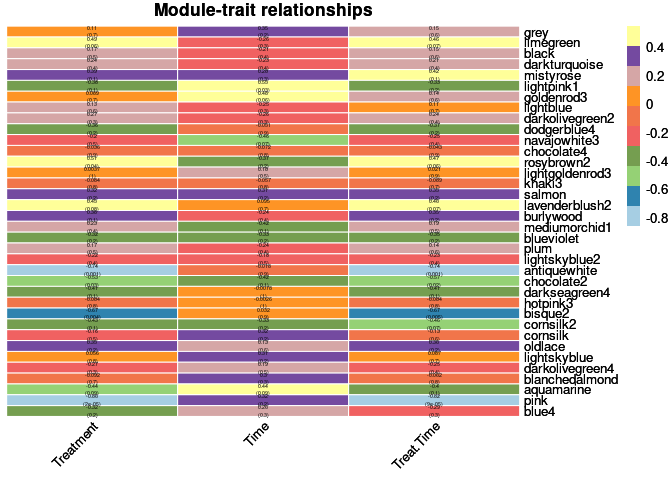
Treatment
The top 10 genes that were significant for treatment within the limegreen module and had the highest correlation with limegreen were:
- BC002059
- ENSMUSG00000045928
- Tmem165
- Klhl26
- Ado
- ENSMUSG00000097444
- Cyp2j6
- ENSMUSG00000050625
- ENSMUSG00000084370
- Slc25a44
The top 10 genes that were significant for treatment within the rosybrown2 module and had the highest correlation with rosybrown2 were:
- Uimc1
- Aars
- ENSMUSG00000039358
- Klhdc8b
- Eps8l2
- Cym
- Ttll4
- Gpr81
- Alkbh6
- Cadm3
The top 10 genes that were significant for treatment within the lavenderblush2 module and had the highest correlation with lavenderblush2 were:
- Smo
- Rpn2
- Rassf2
- Zfp945
- Grrp1
- Rnaset2b
- Rgl3
- Bloc1s5
- Sema4d
- ENSMUSG00000064982
The top 10 genes that were significant for treatment within the antiquewhite module and had the highest correlation with antiquewhite were:
- Fam19a2
- ENSMUSG00000028584
- Tmem86b
- Ctnnbip1
- Gpc1
- Rps6kb2
- Cxcr3
- Arhgap25
- Khdrbs3
- Ube2q1
The top 10 genes that were significant for treatment within the pink module and had the highest correlation with pink were:
- ENSMUSG00000028876
- Zzz3
- Bcl3
- Pitpnc1
- Ass1
- ENSMUSG00000097387
- 4930426L09Rik
- Camk2g
- ENSMUSG00000071516
- ENSMUSG00000092452
Time
The top 10 genes that were significant for time within the lightpink1 module and had the highest correlation with lightpink1 were:
- Chd3
- Mpp2
- Nop10
- 36598
- 9330158H04Rik
- Rdh1
- Rer1
- Cdc25c
- Psmg1
- Dcst1
The top 10 genes that were significant for time within the goldenrod3 module and had the highest correlation with goldenrod3 were:
- Sbk1
- Gm3194
- Rad23a
- Gm5822
- Prickle1
- Afap1l2
- Alox12
- ENSMUSG00000079644
- Lurap1
- Aqp11
The top 10 genes that were significant for time within the aquamarine module and had the highest correlation with aquamarine were:
- ENSMUSG00000052295
- Prelid1
- Fbxl2
- Sytl2
- Xpa
- Adpgk
- C130071C03Rik
- Repin1
- Lix1l
- Psma5
Treatment by time
The top 10 genes that were significant for treatment by time within the limegreen module and had the highest correlation with limegreen were:
- BC002059
- Mrpl44
- ENSMUSG00000045928
- Tmem165
- Tmem109
- Klhl26
- ENSMUSG00000097444
- Cyp2j6
- ENSMUSG00000050625
- ENSMUSG00000084370
The top 10 genes that were significant for treatment by time within the mistyrose module and had the highest correlation with mistyrose were:
- ENSMUSG00000041165
- Zfp652
- Cdk12
- Lrrfip1
- Ciapin1
- Lhfpl2
- Nisch
- Alas1
- Sall2
- Nhsl2
The top 10 genes that were significant for treatment by time within the rosybrown2 module and had the highest correlation with rosybrown2 were:
- Uimc1
- Gm20469
- Aars
- Itgav
- Klhdc8b
- Eps8l2
- Cym
- Gpr81
- Alkbh6
- Cadm3
The top 10 genes that were significant for treatment by time within the lavenderblush2 module and had the highest correlation with lavenderblush2 were:
- Rorc
- Rpn2
- Zfp945
- Grrp1
- Rnaset2b
- Rgl
- Bloc1s5
- Sema4d
- Col6a5
- Zmynd10
The top 10 genes that were significant for treatment by time within the antiquewhite module and had the highest correlation with antiquewhite were:
- Rad51ap1
- Fam19a2
- ENSMUSG00000028584
- Tmem86b
- Ctnnbip1
- Gpc1
- Cxcr3
- Arhgap25
- Khdrbs3
- Ube2q1
The top 10 genes that were significant for treatment by time within the pink module and had the highest correlation with pink were:
- Eml6
- Ewsr1
- Gabarapl1
- ENSMUSG00000028876
- ENSMUSG00000013418
- ENSMUSG00000061520
- Zzz3
- ENSMUSG00000059887
- Crebzf
- Pitpnc1
Analysis performed by Ann Wells
The Carter Lab The Jackson Laboratory 2023
ann.wells@jax.org