Summary
Ann Wells
April 23, 2023
Summary
needed.packages <- c("tidyverse", "here", "functional", "gplots", "dplyr", "GeneOverlap", "R.utils", "reshape2","magrittr","data.table", "RColorBrewer","preprocessCore", "ARTool","emmeans", "phia", "gProfileR","rlist", "pheatmap" ,"WGCNA")
for(i in 1:length(needed.packages)){library(needed.packages[i], character.only = TRUE)}

source(here("source_files","WGCNA_source.R"))
There were 143 samples (4 per time and treatment for each tissue). Mice were fed 2DG (6g/L) or nothing in their water for 96hrs or 2 weeks. WGCNA analysis was performed to determine gene clustering. A soft-thresholding power was chosen so that the scale-free topology correlation attempts to hit 0.9. The power chosen for all tissues was 8, which allowed the correlations to hover around 0.9. This power clustered the genes into 47 modules originally, however, modules that were highly correlated (0.75 or higher) were further merged together to create 20 modules.
modules<-read.csv(here("Data","log.tdata.FPKM.sample.info.subset.WGCNA.module.membership.csv"), header=T)

module_barplot(modules)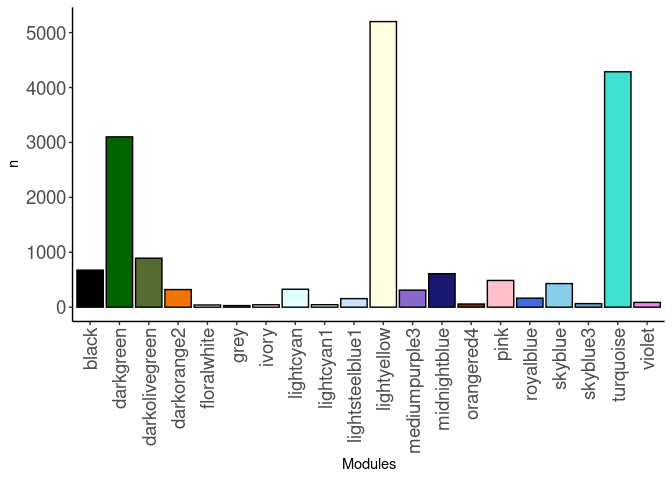
Pathways
Pathways were assessed for each module. Out of 20 modules, all 20 modules had pathway hits of any kind. The pathways that had the highest frequency across modules were metabolic pathways and calcium signaling pathways. The black, darkolivegreen, grey, midnightblue, pink, royalblue, skyblue3, and turquoise modules all contained these pathways.
Black
21 pathways were identified in the Black module. The pathways were related to cardiomyopathy, cardiac function, metabolism, post-translational protein modification, protein processing of the ER, steroid biosynthesis, and striated muscle contraction.
Darkgreen
372 pathways were identified in the Darkgreen module. The pathways were related to adaptive immunity, CD28, caspase activation, cell cycle, cyclins, chemokines, DNA, mRNA, interleukins, innate immune system, rRNA, RNA polymerase II, p53, NF-kappa B, NOD1/2, neutrophil, natural killer cell mediated cytotoxicity, B cells, toll like receptors, Th1 and 2, Th17, and TNF.
Darkolivegreen
37 pathways were identified in the Darkolivegreen module. The pathways were related to digestion, o-linked glycosylation, parathyroid hormone, glycerophospholipid, protein digestion, vascular smooth muscle contraction, TGF-beta signaling, and vitamin digestion and absorption.
Darkorange2
9 pathways were identified in the Darkorange2 module. The pathways were related to extracellular matrix, mTOR signaling, transport of bile salts and small molecules, and cellular response to starvation.
Floralwhite
21 pathways were identified in the Floralwhite module. The pathways were related to cardiac function, cAMP, neurodegenerative diseases, thyroid hormone signaling, and potassium channels.
Grey
8 pathways were identified in the Grey module. The pathways were related to digestion, carbohydrates, pancreatic and salivary secretion.
Lightcyan
85 pathways were identified in the Lightcyan module. The pathways were related to amino acid metabolism, eicosanoids, fatty acid metabolism, insulin, glycolysis, gluconeogenesis, metabolism, nicotinate metabolism, pantothenate and CoA biosynthesis, PPAR signaling, steroids, and synthesis of bile acids.
Lightcyan1
5 pathways were identified in the Lightcyan1 module. The were related to mitochondrial translation, HDL modeling, and plasma lipoprotein remodeling.
Lightsteelblue1
3 pathways were identified in the Lightsteelblue1 module. The pathways were cellular responses to external stimuli, cellular responses to stress, and MAPK signaling pathway.
Lightyellow
252 pathways were identified in the Lightyellow module. The pathways were related to AMPK signaling, antigen processing, asparagine n-linked glycosylation, cell cycle, cellular responses, MHC I mediated antigen processing and presentation, DNA, ERK, glucose metabolism, glycolysis, insulin, MAPK, signaling, RNA polymerase II, mRNA, SUMOylation, transport, VEGF, and ubiquitin.
Mediumpurple3
4 pathways were identified in the Mediumpurple3 module. The pathways were cellular responses to chemical stress, detoxification of reactive oxygen species, metabolic pathways, and parathyroid hormone synthesis, secretion, and action.
Midnightblue
46 pathways were identified in the Midnightblue module. The pathways were related to antigen presentation, caspase activation, metabolism, neutrophil degranulation, nicotinate metabolism, pentose phosphate pathway, purine catabolism, protein processing in the ER, TNF signaling, TRAIL signaling, and zinc transporters.
Orangered4
2 pathways were identified in the Orangered4 module. The pathways were apelin signaling pathway and fluid shear stress and atherosclerosis.
Pink
70 pathways were identified in the Pink module. The pathways were related to bile acid, complement, extracellular matrix formation, fibrin, gamma-carboxylation, metabolism of amino acids, vitamins, lipids, porphyrins, and steroids, mitochondrial metabolism, platelets, PPAR signaling, regulation of IGF, synthesis of bile acids, and transport.
Royalblue
36 pathways identified in the Royalblue module. The pathways were related to the TCA cycle, neurodegenerative diseases, mitochondrial metabolism, pyruvate metabolism, respiratory electron transport, thermogenesis, and TP53 related pathways.
Skyblue
57 pathways identified in the Skyblue module. The pathways were related to amino acid metabolism, fatty acid metabolism, metabolism of lipids, amino acids, and vitamins, HDL remodeling, plasma lipoprotein, pantothenate and CoA biosynthesis, steroid synthesis, and urea cycle.
Skylblue3
11 pathways were identified in the Skyblue3 module. The pathways were related to signaling, cardiac function, and muscle contraction.
Turquoise
204 pathways were identified in the Turquoise module. The pathways were related to calcium, signaling, dopamine, estrogen, GABA, glycosaminoglycans, insulin, neuronal systems, type 2 diabetes, trafficking various molecules, smooth muscle contraction, and vasopressin.
Violet
13 pathways were identified in the Violet module. The pathways were related to collagen, the extracellular matrix, and vasculature.
tdata.FPKM.sample.info <- readRDS(here("Data","20190406_RNAseq_B6_4wk_2DG_counts_phenotypes.RData"))

tdata.FPKM <- readRDS(here("Data","20190406_RNAseq_B6_4wk_2DG_counts_numeric.RData"))

log.tdata.FPKM <- log(tdata.FPKM + 1)
log.tdata.FPKM <- as.data.frame(log.tdata.FPKM)

log.tdata.FPKM.sample.info <- cbind(log.tdata.FPKM, tdata.FPKM.sample.info[,27238:27240])

log.tdata.FPKM.sample.info <- log.tdata.FPKM.sample.info %>% rownames_to_column() %>% filter(rowname != "A113") %>% column_to_rownames()

log.tdata.FPKM.subset <- log.tdata.FPKM[,colMeans(log.tdata.FPKM != 0) > 0.5]

log.tdata.FPKM.subset <- log.tdata.FPKM.subset %>% rownames_to_column() %>% filter(rowname != "A113") %>% column_to_rownames()

WGCNA.pathway <-readRDS(here("Data","Chang_B6_96hr_4wk_gprofiler_pathway_annotation_list_WGCNA.RData"))

Matched<-readRDS(here("Data","Annotated_genes_in_WGCNA_Chang_B6_96hr_4wk.RData"))

module.names <- Matched$X..Module.
name <- str_split(module.names,"_")
samples <-c()
for(i in 1:length(name)){
samples[[i]] <- name[[i]][2]
}
name <- str_split(samples,"\"")
name <- unlist(name)

Treatment <- unclass(as.factor(log.tdata.FPKM.sample.info[,27238]))
Tissue <- unclass(as.factor(log.tdata.FPKM.sample.info[,27239]))
Time <- unclass(as.factor(log.tdata.FPKM.sample.info[,27237]))
Treat.Tissue <- paste0(Treatment,Tissue)
Treat.Time <- paste0(Treatment, Time)
Tissue.Time <- paste0(Tissue, Time)
Treat.Tissue.Time <- paste0(Treatment,Tissue, Time)
phenotype <- data.frame(cbind(Tissue, Treatment, Time, Treat.Tissue, Treat.Time, Tissue.Time, Treat.Tissue.Time))

nSamples <- nrow(log.tdata.FPKM.sample.info)

MEs0 <- read.csv(here("Data","log.tdata.FPKM.sample.info.subset.WGCNA.module.eigens.csv"),header = T, row.names = 1)
name <- str_split(names(MEs0),"_")
samples <-c()
for(i in 1:length(name)){
samples[[i]] <- name[[i]][2]
}
name <- str_split(samples,"\"")
name <- unlist(name)
colnames(MEs0) <-name
MEs <- orderMEs(MEs0)
moduleTraitCor <- cor(MEs, phenotype, use = "p");
moduleTraitPvalue <- corPvalueStudent(moduleTraitCor, nSamples)
Relationship between Modules and Traits
#sizeGrWindow(10,6)
# Will display correlations and their p-values
textMatrix = paste(signif(moduleTraitCor, 2), "\n(",
                        signif(moduleTraitPvalue, 1), ")", sep = "");
dim(textMatrix) = dim(moduleTraitCor)

# Display the correlation values within a heatmap plot
heat <- pheatmap(moduleTraitCor, main = paste("Module-trait relationships"), display_numbers = textMatrix,color=colorRampPalette(brewer.pal(n = 11, name = "Paired"))(10), cluster_rows = F, cluster_cols = F, fontsize_number = 4, angle_col = 45, number_color = "black", border_color = "white")
heat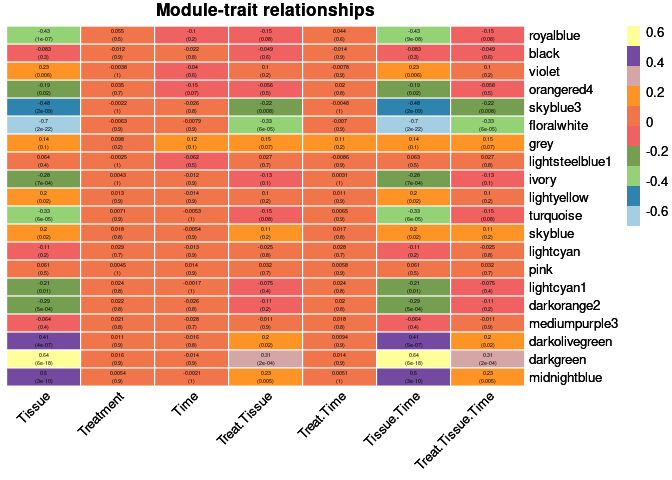
Top 10 Hub genes within each significant module
Tissue
The top 10 genes that were significant for tissue within the floralwhite module and had the highest correlation with floralwhite were:
- Vwf
- Akr1c14
- Gm4952
- Vkorc1
- Cml5
- Cyp2c29
- 4921531C22Rik
- Ccdc109b
- Col5a1
- Kirrel
The top 10 genes that were significant for tissue within the darkgreen module and had the highest correlation with darkgreen were:
- Notch1
- Ska2
- Cdc23
- Gm26760
- Rab21
- Crtap
- Cep70
- Dip2b
- Crtc3
- Zswim8
Treatment
None
Time
None
Treatment by tissue
None
Treatment by time
None
Tissue by time
The top 10 genes that were significant for tissue by time within the floralwhite module and had the highest correlation with floralwhite were:
- Vwf
- Akr1c14
- Gm4952
- Vkorc1
- Cml5
- Cyp2c29
- 4921531C22Rik
- Ccdc109b
- Col5a1
- Kirrel
The top 10 genes that were significant for tissue by time within the darkgreen module and had the highest correlation with darkgreen were:
- Notch1
- Ska2
- Cdc23
- Gm26760
- Rab21
- Crtap
- Cep70
- Dip2b
- Crtc3
- Zswim8
Treatment by tissue by time
None
Analysis performed by Ann Wells
The Carter Lab The Jackson Laboratory 2023
ann.wells@jax.org