Summary Skeletal Muscle, Small Intestine, and Spleen
Ann Wells
April 23, 2023
Summary
needed.packages <- c("tidyverse", "here", "functional", "gplots", "dplyr", "GeneOverlap", "R.utils", "reshape2","magrittr","data.table", "RColorBrewer","preprocessCore", "ARTool","emmeans", "phia", "gProfileR","rlist", "pheatmap", "WGCNA")
for(i in 1:length(needed.packages)){library(needed.packages[i], character.only = TRUE)}

source(here("source_files","WGCNA_source.R"))
There were 47 samples (4 per time and treatment minus skeletal muscle 96 hr control). Mice were fed 2DG (6g/L) or nothing in their water for 96hrs or 4 weeks. WGCNA analysis was performed to determine gene clustering. A soft-thresholding power was chosen so that the scale-free topology correlation attempts to hit 0.9. The power chosen for skeletal muscle, small intestine, and spleen was 1, which allowed the correlations to hover around 0.98. This power clustered the genes into 6 modules originally, however, modules that were highly correlated (0.75 or higher) were further merged together to create 4 modules.
modules<-read.csv(here("Data","SM.SI.spleen","log.tdata.FPKM.sample.info.subset.SM.SI.spleen.WGCNA.module.membership.csv"), header=T)

module_barplot(modules)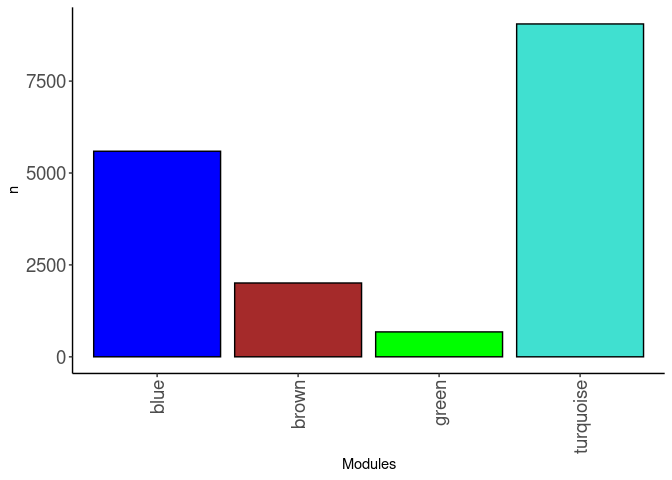
Pathways
Pathways were assessed for each module. Out of 4 modules, only 3 modules had pathway hits of any kind. The pathways that had the highest frequency across modules were cell cycle and metabolism. The blue, brown, and turquoise modules all contained these pathways.
Blue
234 pathways were identified for the blue module. The pathways identified were involved in cell cycle, cardiac function, cancer, immunity, metabolism, and mitochondrial function.
Brown
45 pathways were identified for the brown module. The pathways identified were involved in calcium signaling, fructose catabolism and metabolism, lipid metabolism, and amino acid metabolism.
Turquoise
174 pathways were identified for the turquoise module. The pathways identified were involved in Alzheimer disease, b cell receptor signaling pathway, cell cycle, chromatin, multiple DNA pathways, mRNA and RNA pathways, and Toll like receptor pathways.
tdata.FPKM.sample.info <- readRDS(here("Data","20190406_RNAseq_B6_4wk_2DG_counts_phenotypes.RData"))

tdata.FPKM <- readRDS(here("Data","20190406_RNAseq_B6_4wk_2DG_counts_numeric.RData"))

log.tdata.FPKM <- log(tdata.FPKM + 1)
log.tdata.FPKM <- as.data.frame(log.tdata.FPKM)

log.tdata.FPKM.sample.info <- cbind(log.tdata.FPKM, tdata.FPKM.sample.info[,27238:27240])

log.tdata.FPKM.sample.info <- log.tdata.FPKM.sample.info %>% rownames_to_column() %>% filter(rowname != "A113") %>% column_to_rownames()

log.tdata.FPKM.subset <- log.tdata.FPKM[,colMeans(log.tdata.FPKM != 0) > 0.5]

log.tdata.FPKM.subset <- log.tdata.FPKM.subset %>% rownames_to_column() %>% filter(rowname != "A113") %>% column_to_rownames()

log.tdata.FPKM.sample.info.subset.SM.SI.spleen <- log.tdata.FPKM.sample.info %>% rownames_to_column() %>% filter(Tissue %in% c("Skeletal Muscle", "Spleen", "Small Intestine")) %>% column_to_rownames()

log.tdata.FPKM.subset <- subset(log.tdata.FPKM.sample.info.subset.SM.SI.spleen, select = -c(Time,Treatment,Tissue))

WGCNA.pathway <-readRDS(here("Data","SM.SI.spleen","Chang_B6_96hr_4wk_gprofiler_pathway_annotation_list_SM_SI_spleen_WGCNA.RData"))

Matched<-readRDS(here("Data","SM.SI.spleen","Annotated_genes_in_SM_SI_spleen_WGCNA_Chang_B6_96hr_4wk.RData"))


module.names <- Matched$X..Module.
name <- str_split(module.names,"_")
samples <-c()
for(i in 1:length(name)){
samples[[i]] <- name[[i]][2]
}
name <- str_split(samples,"\"")
name <- unlist(name)

Treatment <- unclass(as.factor(log.tdata.FPKM.sample.info.subset.SM.SI.spleen[,27238]))
Tissue <- unclass(as.factor(log.tdata.FPKM.sample.info.subset.SM.SI.spleen[,27239]))
Time <- unclass(as.factor(log.tdata.FPKM.sample.info.subset.SM.SI.spleen[,27237]))
Treat.Tissue <- paste0(Treatment,Tissue)
Treat.Time <- paste0(Treatment, Time)
Tissue.Time <- paste0(Tissue, Time)
Treat.Tissue.Time <- paste0(Treatment,Tissue, Time)
phenotype <- data.frame(cbind(Tissue, Treatment, Time, Treat.Tissue, Treat.Time, Tissue.Time, Treat.Tissue.Time))

nSamples <- nrow(log.tdata.FPKM.sample.info.subset.SM.SI.spleen)

MEs0 <- read.csv(here("Data","SM.SI.spleen","log.tdata.FPKM.sample.info.subset.SM.SI.spleen.WGCNA.module.eigens.csv"),header = T, row.names = 1)
name <- str_split(names(MEs0),"_")
samples <-c()
for(i in 1:length(name)){
samples[[i]] <- name[[i]][2]
}
name <- str_split(samples,"\"")
name <- unlist(name)
colnames(MEs0) <-name
MEs <- orderMEs(MEs0)
moduleTraitCor <- cor(MEs, phenotype, use = "p");
moduleTraitPvalue <- corPvalueStudent(moduleTraitCor, nSamples)
Relationship between Modules and Traits
#sizeGrWindow(10,6)
# Will display correlations and their p-values
textMatrix = paste(signif(moduleTraitCor, 2), "\n(",
                        signif(moduleTraitPvalue, 1), ")", sep = "");
dim(textMatrix) = dim(moduleTraitCor)

# Display the correlation values within a heatmap plot
heat <- pheatmap(moduleTraitCor, main = paste("Module-trait relationships"), display_numbers = textMatrix,color=colorRampPalette(brewer.pal(n = 11, name = "Paired"))(10), cluster_rows = F, cluster_cols = F, fontsize_number = 4, angle_col = 45, number_color = "black", border_color = "white")
heat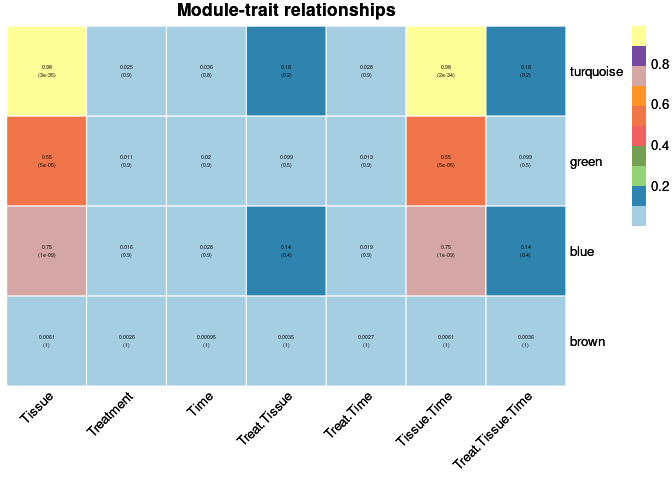
Top 10 Hub genes within each significant module
Tissue
The top 10 genes that were significant for tissue within the brown module and had the highest correlation with brown were:
- Trim23
- Gsta1
- ENSMUSG00000074445
- Tff3
- Agr2
- ENSMUSG00000074441
- Rdh9
- ENSMUSG00000095328
- Tom1l1
- ENSMUSG00000025528
When assessing the overall sample contribution through their summary eigengenes it appears that for brown all skeletal muscle had a negative effect, spleen had a negative effect, and intestine had a positive effect. Muscle and spleen had mostly under-expressed genes while intestine had mostly over-expressed genes.
Treatment
The top 10 genes that were significant for treatment within the turquoise module and had the highest correlation with turquoise were:
- Fnbp1
- Prkd2
- Poli
- Vav1
- Gimap1
- Snx5
- Ncf2
- Malt1
- Sla
- Itgb3
When assessing the overall sample contribution through their summary eigengenes it appears that for turquoise all skeletal muscle had a negative effect, independent of treatment, spleen had a positive effect, independent of treatment, and intestine had a negative effect with the exception of one 96 hr control sample. Muscle and intestine had mostly under-expressed genes and spleen had mostly over-expressed genes.
The top 10 genes that were significant for treatment within the green module and had the highest correlation with green were:
- Cst6
- Tcp11l2
- Cep170
- Rcsd1
- Rbp7
- Sh3kbp1
- Mtch2
- Neo1
- Rev1
- Arhgef6
When assessing the overall sample contribution through their summary eigengenes it appears that for green all intestine had a negative effect, spleen had a positive effect, all independent of treatment, and skeletal muscle had a mostly negative effect with the exception of 2DG, which had a half positive and negative effect for muscle. Muscle and spleen had mostly under-expressed genes while intestine had mostly over-expressed genes.
The top 10 genes that were significant for treatment within the blue module and had the highest correlation with blue were:
- Tes
- Tnni2
- Epm2a
- Gm20204
- Copb1
- Gak
- Ampd1
- Rxrg
- Fbxl19
- Ucp3
When assessing the overall sample contribution through their summary eigengenes it appears that for blue all intestine had a positive effect, spleen had a positive effect, and skeletal muscle had a negative effect, all independent of treatment. Muscle and spleen had mostly under-expressed genes while intestine had mostly over-expressed genes.
The top 10 genes that were significant for treatment within the brown module and had the highest correlation with brown were:
- Sgpp2
- Mpzl2
- Nlrp6
- Otc
- Gcnt4
- Sema4g
- Hkdc1
- Hnf4a
- Anks4b
- Sh3gl2
When assessing the overall sample contribution through their summary eigengenes it appears that for brown all skeletal muscle had a negative effect, spleen had a negative effect, and intestine had a positive effect, all independent of treatment. Muscle and spleen had mostly under-expressed genes while intestine had mostly over-expressed genes.
Time
The top 10 genes that were significant for time within the turquoise module and had the highest correlation with turquoise were:
- Fnbp1
- Prkd2
- Vav1
- Gimap1
- Rbm43
- H2-Q6
- Ncf2
- Sla
- Itgb3
- Hmg20a
When assessing the overall sample contribution through their summary eigengenes it appears that for turquoise all skeletal muscle had a negative effect, independent of time, spleen had a positive effect, independent of time, and intestine had a negative effect with the exception of one 96 hr control sample. Muscle and intestine had mostly under-expressed genes and spleen had mostly over-expressed genes.
The top 10 genes that were significant for time within the green module and had the highest correlation with green were:
- Cst6
- Rcsd1
- Rbp7
- Sh3kbp1
- Mtch2
- Neo1
- Rev1
- Arhgef6
- Zbtb46
- Ociad2
When assessing the overall sample contribution through their summary eigengenes it appears that for green all intestine had a negative effect, spleen had a positive effect, all independent of treatment, and skeletal muscle had a mostly negative effect some 4 wk and 96 hr samples showing a positive effect. Muscle and spleen had mostly under-expressed genes while intestine had mostly over-expressed genes.
The top 10 genes that were significant for time within the blue module and had the highest correlation with blue were:
- Tes
- Tnni2
- Epm2a
- Gm20204
- Gak
- Ampd1
- Rbm45
- Rxrg
- Fbxl19
- Ucp3
When assessing the overall sample contribution through their summary eigengenes it appears that for blue all intestine had a positive effect, spleen had a positive effect, and skeletal muscle had a negative effect, all independent of time. Muscle and spleen had mostly under-expressed genes while intestine had mostly over-expressed genes.
The top 10 genes that were significant for time within the brown module and had the highest correlation with brown were:
- Sgpp2
- Mpzl2
- Nlrp6
- Otc
- Gcnt4
- Sema4g
- Hkdc1
- Hnf4a
- Anks4b
- Sh3gl2
When assessing the overall sample contribution through their summary eigengenes it appears that for brown all skeletal muscle had a negative effect, spleen had a negative effect, and intestine had a positive effect, all independent of time. Muscle and spleen had mostly under-expressed genes while intestine had mostly over-expressed genes.
Treatment by tissue
The top 10 genes that were significant for treatment by tissue within the green module and had the highest correlation with green were:
- Dhx29
- Bmp5
- Satb1
- Slc35f5
- Thnsl2
- Gpt
- Igf1
- Slc30a2
- Pex11a
- Rragb
When assessing the overall sample contribution through their summary eigengenes it appears that for green all intestine had a negative effect, spleen had a positive effect, all independent of treatment, and skeletal muscle had a mostly negative effect some 2DG samples showing a positive effect. Muscle and spleen had mostly under-expressed genes while intestine had mostly over-expressed genes.
The top 10 genes that were significant for treatment by tissue within the brown module and had the highest correlation with brown were:
- Sgpp2
- Mpzl2
- Nlrp6
- Otc
- Gcnt4
- Sema4g
- Hkdc1
- Hnf4a
- Anks4b
- Sh3gl2
When assessing the overall sample contribution through their summary eigengenes it appears that for brown all skeletal muscle had a negative effect, spleen had a negative effect, and intestine had a positive effect, all independent of treatment but not tissue. Muscle and spleen had mostly under-expressed genes while intestine had mostly over-expressed genes.
Treatment by time
The top 10 genes that were significant for treatment by time within the turquoise module and had the highest correlation with turquoise were:
- Fnbp1
- Prkd2
- Poli
- Vav1
- Gimap1
- Ncf2
- Malt1
- Sla
- Itgb3
- Setdb2
When assessing the overall sample contribution through their summary eigengenes it appears that for turquoise all skeletal muscle had a negative effect, independent of treatment or time, spleen had a positive effect, independent of treatment or time, and intestine had a negative effect with the exception of one 96 hr control sample. Muscle and intestine had mostly under-expressed genes and spleen had mostly over-expressed genes.
The top 10 genes that were significant for treatment by time within the green module and had the highest correlation with green were:
- Cst6
- Tcp11l2
- Cep170
- Rcsd1
- Rbp7
- Sh3kbp1
- Mtch2
- Neo1
- Rev1
- Arhgef6
When assessing the overall sample contribution through their summary eigengenes it appears that for green all intestine had a negative effect, spleen had a positive effect, all independent of treatment, and skeletal muscle had a mostly negative effect some 4 wk and 96 hr samples showing a positive effect. Muscle and spleen had mostly under-expressed genes while intestine had mostly over-expressed genes.
The top 10 genes that were significant for treatment by time within the blue module and had the highest correlation with blue were:
- Tes
- Tnni2
- Epm2a
- Gm20204
- Copb1
- Gak
- Ampd1
- Rxrg
- Fbxl19
- Ucp3
When assessing the overall sample contribution through their summary eigengenes it appears that for blue all intestine had a positive effect, spleen had a positive effect, and skeletal muscle had a negative effect, all independent of treatment and time. Muscle and spleen had mostly under-expressed genes while intestine had mostly over-expressed genes.
The top 10 genes that were significant for treatment by time within the brown module and had the highest correlation with brown were:
- Sgpp2
- Mpzl2
- Nlrp6
- Otc
- Gcnt4
- Sema4g
- Hkdc1
- Hnf4a
- Anks4b
- Sh3gl2
When assessing the overall sample contribution through their summary eigengenes it appears that for brown all skeletal muscle had a negative effect, spleen had a negative effect, and intestine had a positive effect, all independent of treatment and time. Muscle and spleen had mostly under-expressed genes while intestine had mostly over-expressed genes.
Tissue by time
The top 10 genes that were significant for tissue by time within the brown module and had the highest correlation with brown were:
- Sgpp2
- Mpzl2
- Nlrp6
- Otc
- Gcnt4
- Sema4g
- Hkdc1
- Hnf4a
- Anks4b
- Sh3gl2
When assessing the overall sample contribution through their summary eigengenes it appears that for brown all skeletal muscle had a negative effect, spleen had a negative effect, and intestine had a positive effect, all independent of time but not tissue. Muscle and spleen had mostly under-expressed genes while intestine had mostly over-expressed genes.
Treatment by tissue by time
The top 10 genes that were significant for treatment by tissue by time within the green module and had the highest correlation with green were:
- Dhx29
- Bmp5
- Satb1
- Slc35f5
- Thnsl2
- Gpt
- Igf1
- Slc30a2
- Pex11a
- Rragb
When assessing the overall sample contribution through their summary eigengenes it appears that for green all intestine had a negative effect, spleen had a positive effect, all independent of treatment, and skeletal muscle had a mostly negative effect some 2DG 4 wk and 96 hr samples showing a positive effect. Muscle and spleen had mostly under-expressed genes while intestine had mostly over-expressed genes.
The top 10 genes that were significant for treatment by tissue by time within the brown module and had the highest correlation with brown were:
- Sgpp2
- Mpzl2
- Otc
- Nlrp6
- Gcnt4
- Sema4g
- Hkdc1
- Hnf4a
- Anks4b
- Sh3gl2
When assessing the overall sample contribution through their summary eigengenes it appears that for brown all skeletal muscle had a negative effect, spleen had a negative effect, and intestine had a positive effect, all independent of treatment and time but not tissue. Muscle and spleen had mostly under-expressed genes while intestine had mostly over-expressed genes.
Analysis performed by Ann Wells
The Carter Lab The Jackson Laboratory 2023
ann.wells@jax.org