Summary Hypothalamus
Ann Wells
April 23, 2023
Summary
needed.packages <- c("tidyverse", "here", "functional", "gplots", "dplyr", "GeneOverlap", "R.utils", "reshape2","magrittr","data.table", "RColorBrewer","preprocessCore", "ARTool","emmeans", "phia", "gProfileR","rlist", "pheatmap", "WGCNA")
for(i in 1:length(needed.packages)){library(needed.packages[i], character.only = TRUE)}

source(here("source_files","WGCNA_source.R"))
There were 16 samples (4 per time and treatment). Mice were fed 2DG (6g/L) or nothing in their water for 96hrs or 4 weeks. WGCNA analysis was performed to determine gene clustering. A soft-thresholding power was chosen so that the scale-free topology correlation attempts to hit 0.9. The power chosen for hypothalamus was 9, which allowed the correlations to hover around 0.88. This power clustered the genes into 101 modules originally, however, modules that were highly correlated (0.75 or higher) were further merged together to create 25 modules.
modules<-read.csv(here("Data","Hypothalamus","log.tdata.FPKM.sample.info.subset.hypothalamus.WGCNA.module.membership.csv"), header=T)

module_barplot(modules)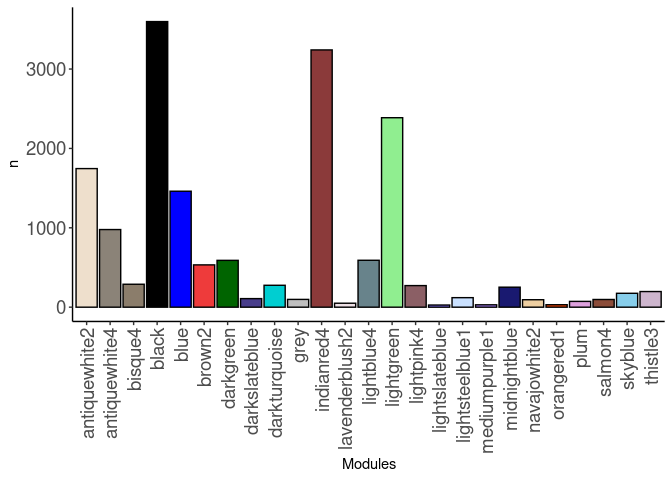
Pathways
Pathways were assessed for each module. Out of 25 modules, only 16 modules had pathway hits of any kind. The pathways that had the highest frequency across modules were innate immune system, metabolism of RNA, and neutrophil degradation. The antiquewhite2, blue, darkgreen, indianred4, midnightblue, and skyblue modules all contained these pathways.
Antiquewhite2
10 pathways were identified for the antiquewhite2 module. The pathways identified were involved in transcription, mRNA splicing.
Antiquewhite4
5 pathways were identified for the antiquewhite4 module. The pathways identified were involved in metabolism, protein processing in the ER, antigen processing, and N-glycan biosynthesis.
Bisque4
9 pathways were identified for the bisque4 module. The pathways identified were involved in fatty acid metabolism, and telomere maintenance.
Black
29 pathways were identified for the black module. The pathways identified were involved in several cancers and cancer pathways.
Blue
198 pathways were identified for the blue module. The pathways identified were involved in Alzheimer’s disease, B-cell processes, external cellular responses (stress, hypoxia), IL-1 signaling, cancer pathways, metabolism and mitochondrial processes, mRNA and RNA pathways, and the TCA cycle.
Brown2
43 pathways were identified for the brown2 module. The pathways identified were involved in collagen, extracellular matrix, protein digestion and absorption, IGF transport and uptake, and transport of bile salts.
Darkslateblue
8 pathways were identified for the darkslateblue module. The pathways identified were involved in collagen and extracellular matrix pathways.
Indianred4
12 pathways were identified for the indianred4 module. The pathways identified were involved in fructose and mannose metabolism, neutrophil degranulation, and RNA pathways.
Lightblue4
16 pathways were identified for the lightblue4 module. The pathways identified were involved in GABA, calmodulin and calcium signaling, and neurotransmitters.
Lightgreen
33 pathways were identified for the lightgreen module. The pathways identified were involved in the TCA cycle, calcium signaling, dopaminergic synapse, hormone pathways, insulin secretion, and gastric acid and hormone pathways.
Lightsteelblue1
11 pathways were identified for the lightsteelblue1 module. The pathways identified were involved in digestion, starch and sucrose metabolism, and the innate immune system.
Midnightblue
33 pathways were identified for the midnightblue module. The pathways identified were involved in immunity, lupus, and toll like receptor pathways.
Orangered1
10 pathways were identified for the orangered1 module. The pathways identified were involved in glycogen metabolism, signaling, and transport of glycerol from adipocytes.
Skyblue
30 pathways were identified for the skyblue module. The pathways identified were involved in fibrin pathways, innate immune system, platelet pathways, pathways of bile acids and salts, regulation of IGF transport and uptake, retinol metabolism, and transport of several molecules.
tdata.FPKM.sample.info <- readRDS(here("Data","20190406_RNAseq_B6_4wk_2DG_counts_phenotypes.RData"))

tdata.FPKM <- readRDS(here("Data","20190406_RNAseq_B6_4wk_2DG_counts_numeric.RData"))

log.tdata.FPKM <- log(tdata.FPKM + 1)
log.tdata.FPKM <- as.data.frame(log.tdata.FPKM)

log.tdata.FPKM.sample.info <- cbind(log.tdata.FPKM, tdata.FPKM.sample.info[,27238:27240])

log.tdata.FPKM.sample.info <- log.tdata.FPKM.sample.info %>% rownames_to_column() %>% filter(rowname != "A113") %>% column_to_rownames()

log.tdata.FPKM.subset <- log.tdata.FPKM[,colMeans(log.tdata.FPKM != 0) > 0.5]

log.tdata.FPKM.subset <- log.tdata.FPKM.subset %>% rownames_to_column() %>% filter(rowname != "A113") %>% column_to_rownames()

log.tdata.FPKM.sample.info.subset.hypothalamus <- log.tdata.FPKM.sample.info %>% rownames_to_column() %>% filter(Tissue == "Hypothanamus") %>% column_to_rownames()

log.tdata.FPKM.subset <- subset(log.tdata.FPKM.sample.info.subset.hypothalamus, select = -c(Time,Treatment,Tissue))

WGCNA.pathway <-readRDS(here("Data","Hypothalamus","Chang_B6_96hr_4wk_gprofiler_pathway_annotation_list_hypothalamus_WGCNA.RData"))

Matched<-readRDS(here("Data","Hypothalamus","Annotated_genes_in_hypothalamus_WGCNA_Chang_B6_96hr_4wk.RData"))


module.names <- Matched$X..Module.
name <- str_split(module.names,"_")
samples <-c()
for(i in 1:length(name)){
samples[[i]] <- name[[i]][2]
}
name <- str_split(samples,"\"")
name <- unlist(name)

Treatment <- unclass(as.factor(log.tdata.FPKM.sample.info.subset.hypothalamus[,27238]))
Time <- unclass(as.factor(log.tdata.FPKM.sample.info.subset.hypothalamus[,27237]))
Treat.Time <- paste0(Treatment, Time)
phenotype <- data.frame(cbind(Treatment, Time, Treat.Time))

nSamples <- nrow(log.tdata.FPKM.sample.info.subset.hypothalamus)

MEs0 <- read.csv(here("Data","Hypothalamus","log.tdata.FPKM.sample.info.subset.hypothalamus.WGCNA.module.eigens.csv"),header = T, row.names = 1)
name <- str_split(names(MEs0),"_")
samples <-c()
for(i in 1:length(name)){
samples[[i]] <- name[[i]][2]
}
name <- str_split(samples,"\"")
name <- unlist(name)
colnames(MEs0) <-name
MEs <- orderMEs(MEs0)
moduleTraitCor <- cor(MEs, phenotype, use = "p");
moduleTraitPvalue <- corPvalueStudent(moduleTraitCor, nSamples)
Relationship between Modules and Traits
#sizeGrWindow(10,6)
# Will display correlations and their p-values
textMatrix = paste(signif(moduleTraitCor, 2), "\n(",
                        signif(moduleTraitPvalue, 1), ")", sep = "");
dim(textMatrix) = dim(moduleTraitCor)

# Display the correlation values within a heatmap plot
heat <- pheatmap(moduleTraitCor, main = paste("Module-trait relationships"), display_numbers = textMatrix,color=colorRampPalette(brewer.pal(n = 11, name = "Paired"))(10), cluster_rows = F, cluster_cols = F, fontsize_number = 4, angle_col = 45, number_color = "black", border_color = "white")
heat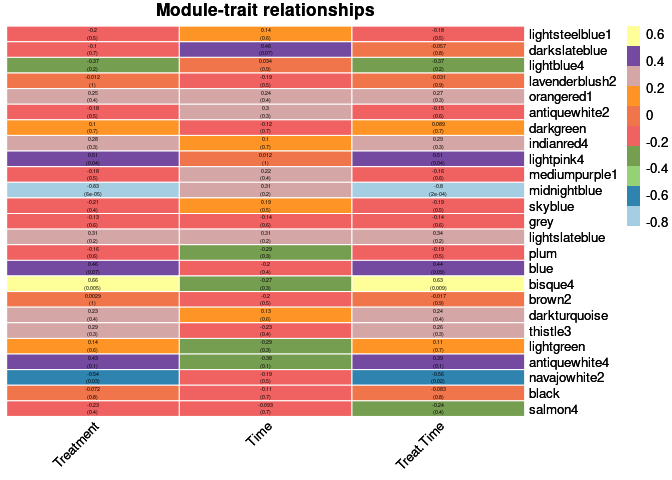
Top 10 Hub genes within each significant module
Treatment
The top 10 genes that were significant for treatment within the midnightblue module and had the highest correlation with midnightblue were:
- Atrx
- Hgf
- Rtp3
- ENSMUSG00000097293
- ENSMUSG00000097435
- Ube3a
- Asrgl1
- Gm26621
- Nxnl2
- ENSMUSG00000001497
When assessing the overall sample contribution through their summary eigengenes it appears that for midnightblue most controls had a negative effect while most 2DG had a positive effect, indicating that there are many under-expressed genes for control mice and over-expressed genes 2DG treated mice.
The top 10 genes that were significant for treatment within the bisque4 module and had the highest correlation with bisque4 were:
- Orai3
- Fblim1
- Tmem8
- Ffar4
- H2-Aa
- Desi2
- ENSMUSG00000089926
- Eva1a
- ENSMUSG00000085872
- Fitm2
When assessing the overall sample contribution through their summary eigengenes it appears that for bisque4 most controls had a positive effect while most 2DG had a negative effect, indicating that there are many over-expressed genes for control mice and under-expressed genes 2DG treated mice.
Time
None
Treatment by time
The top 10 genes that were significant for treatment by time within the midnightblue module and had the highest correlation with midnightblue were:
- Atrx
- Rnasel
- 2610005L07Rik
- Rtp3
- ENSMUSG00000097435
- Cdipt
- Ube3a
- Asrgl1
- Nxnl2
- ENSMUSG00000001497
When assessing the overall sample contribution through their summary eigengenes it appears that for midnightblue most controls had a negative effect while most 2DG had a positive effect, regardless of time point, indicating that there are many under-expressed genes for control mice and over-expressed genes 2DG treated mice.
The top 10 genes that were significant for treatment by time within the bisque4 module and had the highest correlation with bisque4 were:
- Orai3
- Fblim1
- Tmem8
- Ffar4
- Cldn14
- H2-Aa
- Desi2
- Ppp1cc
- ENSMUSG00000089926
- ENSMUSG00000053862
When assessing the overall sample contribution through their summary eigengenes it appears that for bisque4 most controls had a positive effect while most 2DG had a negative effect, regardless of time point, indicating that there are many over-expressed genes for control mice and under-expressed genes 2DG treated mice.
Analysis performed by Ann Wells
The Carter Lab The Jackson Laboratory 2023
ann.wells@jax.org