Summary Brain
Ann Wells
April 23, 2023
Summary
needed.packages <- c("tidyverse", "here", "functional", "gplots", "dplyr", "GeneOverlap", "R.utils", "reshape2","magrittr","data.table", "RColorBrewer","preprocessCore", "ARTool","emmeans", "phia", "gProfileR","rlist", "pheatmap","WGCNA")
for(i in 1:length(needed.packages)){library(needed.packages[i], character.only = TRUE)}

source(here("source_files","WGCNA_source.R"))
There were 48 samples (4 per time and treatment for each tissue). Mice were fed 2DG (6g/L) or nothing in their water for 96hrs or 2 weeks. WGCNA analysis was performed to determine gene clustering. A soft-thresholding power was chosen so that the scale-free topology correlation attempts to hit 0.9. The power chosen for hippocampus, hypothalamus, and pre-frontal cortex was 9, which allowed the correlations to hover around 0.88. This power clustered the genes into 195 modules originally, however, modules that were highly correlated (0.75 or higher) were further merged together to create 41 modules.
modules<-read.csv(here("Data","Brain","log.tdata.FPKM.sample.info.subset.hip.hyp.cortex.WGCNA.module.membership.csv"), header=T)

module_barplot(modules)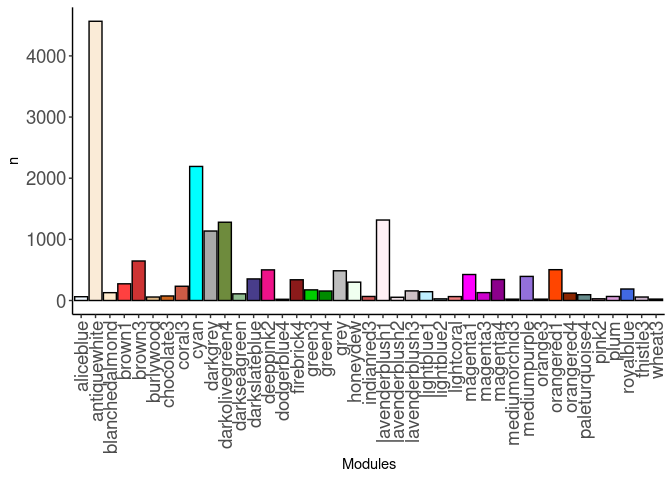
Pathways were assessed for each module. Out of 41 modules, only 28 modules had pathway hits of any kind. The pathways that had the highest frequency across modules were metabolism of proteins, RNA, and arachidonic acid. The brown3, cyan, darkgrey, green3, green4, honeydew, lavenderblush1, lightcoral, magenta1, and orangered4 modules all contained these pathways.
Antiquewhite
60 pathways were identified for the antiquewhite module. The pathways identified were involved in amino acid metabolism, cell signaling, neuronal signaling, insulin regulation, cancer, and immunity.
Blanchedalmond
17 pathways were identified for the blanchedalmond module. The pathways identified were involved in neuronal signaling and calcium signaling.
Brown3
38 pathways were identified for the brown3 module. The pathways identified were involved in metabolism (macro-nutrients, TCA cycle, mitochondrial metabolism, respiratory electron transport), thermogenesis, and neurodegenerative diseases.
Cyan
102 pathways were identified for the cyan module. The pathways identified were involved in cell cycle, metabolism, translation, rRNA, ribosomal, and ubiquitin.
Darkgrey
50 pathways were identified for the darkgrey module. The pathways identified were involved in cell cycle, neurodegenerative diseases, thermogenesis, RNA, and cellular responses to stress and external stimuli.
Darkseagreen
52 pathways were identified for the darkseagreen module. The pathways were related to cAMP, insulin signaling, interleukin-17, cell-cell interactions, MAPK, MyD88, p53, T cell receptor signaling, and TLR cascades.
Deeppink2
7 pathways were identified for the deeppink2 module. The pathways identified were involved in signaling and osteoclast differentiation.
Green3
24 pathways were identified in the green3 module. The pathways were related to autoimmune diseases, mRNA, mitochondrial metabolism, rRNA, and translation.
Green4
5 pathways were identified in the green4 module. The pathways identified were involved in mRNA.
Grey
17 pathways were identified in the grey module. The pathways were related to immunity, complement, bile acids, gamma-carboxylation, steroid hormones, and phenylalanine metabolism.
Honeydew
22 pathways were identified in the honeydew module. The pathways were related to RNA polymerase II, mRNA, SUMOylation, and PERK.
Lavenderblush1
183 pathways were identified in the lavenderblush1 module. The pathways related to APC, cellular responses, antigen processing-cross presentation, MHC I mediated antigen processing and presentation, DNA, metabolism, mitochondrial metabolism, nonsense mediated decay, p53, RNA polymerase I and II, RUNX3, rRNA, transcriptional regulation, thermogenesis, and TCR signaling.
Lavenderblush2
3 pathways were identified in the lavenderblush2 module: fatty acids; incretin synthesis, secretion, and activation: and synthesis, secretion and inactivation of glucagon-like peptide-1 (GLP-1)
Lavenderblush3
1 pathway (axon guidance) was identified in the lavenderblush3 module.
Lightblue1
35 pathways were identified in the lightblue1 module. The pathways were related to beta oxidation, antigen processing and presentation, fatty acid metabolism, MET, extracellular matrix, mitochondrial metabolism, and amino acid metabolism.
Lightcoral
42 pathways were identified in the lightcoral module. The pathways were related to amino acids, AMPK, fatty acid metabolism, gluconeogenesis, glycolysis, insulin resistance, metabolism, sodium/chloride transporters, PPAR signaling, and transport.
Magenta1
23 pathways were identified in the magenta1 module. The pathways were related to collagen, extracellular matrix, fatty acid metabolism, protein digestion and absorption, and arachidonic acid metabolism.
Magenta3
18 pathways were identified in the magenta3 module. The pathways were related to calcium and calmodulin.
Magenta4
5 pathways were identified in the magenta4 module. The pathways identified were related to RNA transcription and Herpes simplex virus 1 infection.
Mediumorchid3
9 pathways were identified in the mediumorchid3 module. The pathways identified were related to potassium and calcium channels, and GLP-1 regulates insulin secretion.
Mediumpurple
43 pathways were identified in the medium orchid3 module. The pathways were related to axon guidance, growth hormone, MAPK signaling, thyroid hormone signaling, TLR signaling, VEGF, and osteoclast differentiation.
Orange3
6 pathways were identified in the orange3 module. The pathways identified were related to muscle contraction.
Orangered1
2 pathways were identified in the orangered1 module. The pathways identified were herpes simplex virus 1 infection and ubiquitin mediated proteolysis.
Orangered4
16 pathways were identified in the orangered4 module. The pathways were related to keratan, complement, sodium/chloride transporter, platelet degranulation, and arachidonic acid metabolism.
Plum
3 pathways were identified in the plum module. The pathways identified were ether lipid metabolism, metabolic pathways, and sphingolipid metabolism.
Royalblue
62 pathways were identified in the royalblue module. The pathways were related to adaptive immunity, B cell receptor signaling, chemokine receptors, complement, cytokine-cytokine, NF-kappa B, NOD-like receptor signaling, TLR cascade, natural killer cells, and autoimmune disease.
Thistle3
14 pathways were identified in the thistle3 module. The pathways were related to defensins, digestion, immune system, neutrophil degranulation, NOD-like receptor signaling, and pancreatic secretion.
tdata.FPKM.sample.info <- readRDS(here("Data","20190406_RNAseq_B6_4wk_2DG_counts_phenotypes.RData"))

tdata.FPKM <- readRDS(here("Data","20190406_RNAseq_B6_4wk_2DG_counts_numeric.RData"))

log.tdata.FPKM <- log(tdata.FPKM + 1)
log.tdata.FPKM <- as.data.frame(log.tdata.FPKM)

log.tdata.FPKM.sample.info <- cbind(log.tdata.FPKM, tdata.FPKM.sample.info[,27238:27240])

log.tdata.FPKM.sample.info <- log.tdata.FPKM.sample.info %>% rownames_to_column() %>% filter(rowname != "A113") %>% column_to_rownames()

log.tdata.FPKM.subset <- log.tdata.FPKM[,colMeans(log.tdata.FPKM != 0) > 0.5]

log.tdata.FPKM.subset <- log.tdata.FPKM.subset %>% rownames_to_column() %>% filter(rowname != "A113") %>% column_to_rownames()

log.tdata.FPKM.sample.info.subset.hip.hypo.cortex <- log.tdata.FPKM.sample.info %>% rownames_to_column() %>% filter(Tissue %in% c("Hippocampus","Hypothanamus","Pre-frontal Cortex")) %>% column_to_rownames()

log.tdata.FPKM.subset <- subset(log.tdata.FPKM.sample.info.subset.hip.hypo.cortex, select = -c(Time,Treatment,Tissue))

WGCNA.pathway <-readRDS(here("Data","Brain","Chang_B6_96hr_4wk_gprofiler_pathway_annotation_list_hip_hyp_cortex_WGCNA.RData"))

Matched<-readRDS(here("Data","Brain","Annotated_genes_in_hip_hyp_cortex_WGCNA_Chang_B6_96hr_4wk.RData"))


module.names <- Matched$X..Module.
name <- str_split(module.names,"_")
samples <-c()
for(i in 1:length(name)){
samples[[i]] <- name[[i]][2]
}
name <- str_split(samples,"\"")
name <- unlist(name)

Treatment <- unclass(as.factor(log.tdata.FPKM.sample.info.subset.hip.hypo.cortex[,27238]))
Tissue <- unclass(as.factor(log.tdata.FPKM.sample.info.subset.hip.hypo.cortex[,27239]))
Time <- unclass(as.factor(log.tdata.FPKM.sample.info.subset.hip.hypo.cortex[,27237]))
Treat.Tissue <- paste0(Treatment,Tissue)
Treat.Time <- paste0(Treatment, Time)
Tissue.Time <- paste0(Tissue, Time)
Treat.Tissue.Time <- paste0(Treatment,Tissue, Time)
phenotype <- data.frame(cbind(Tissue, Treatment, Time, Treat.Tissue, Treat.Time, Tissue.Time, Treat.Tissue.Time))

nSamples <- nrow(log.tdata.FPKM.sample.info.subset.hip.hypo.cortex)

MEs0 <- read.csv(here("Data","Brain","log.tdata.FPKM.sample.info.subset.hip.hyp.cortex.WGCNA.module.eigens.csv"),header = T, row.names = 1)
name <- str_split(names(MEs0),"_")
samples <-c()
for(i in 1:length(name)){
samples[[i]] <- name[[i]][2]
}
name <- str_split(samples,"\"")
name <- unlist(name)
colnames(MEs0) <-name
MEs <- orderMEs(MEs0)
moduleTraitCor <- cor(MEs, phenotype, use = "p");
moduleTraitPvalue <- corPvalueStudent(moduleTraitCor, nSamples)
Relationship between Modules and Traits
#sizeGrWindow(10,6)
# Will display correlations and their p-values
textMatrix = paste(signif(moduleTraitCor, 2), "\n(",
                        signif(moduleTraitPvalue, 1), ")", sep = "");
dim(textMatrix) = dim(moduleTraitCor)

# Display the correlation values within a heatmap plot
heat <- pheatmap(moduleTraitCor, main = paste("Module-trait relationships"), display_numbers = textMatrix,color=colorRampPalette(brewer.pal(n = 11, name = "Paired"))(10), cluster_rows = F, cluster_cols = F, fontsize_number = 4, angle_col = 45, number_color = "black", border_color = "white")
heat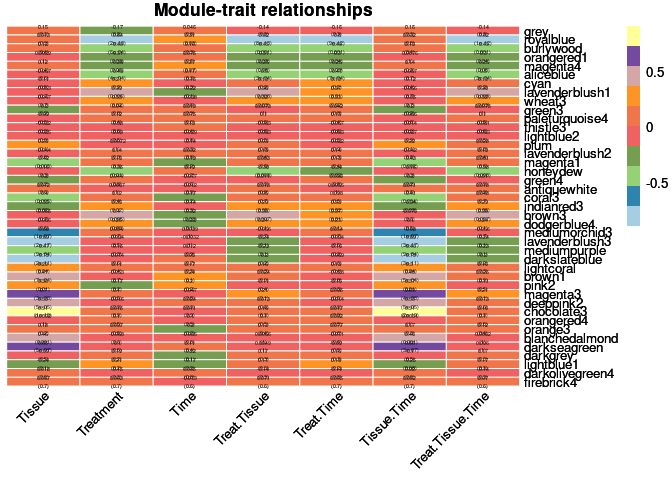
Top 10 Hub genes within each significant module
Tissue
The top 10 genes that were significant for tissue within the lavenderblush3 module and had the highest correlation with lavenderblush3 were:
- lno80e
- Rab7
- ld4
- 4632415L05Rik
- Gtf3c4
- Tagln2
- Map3k19
- Mlc1
- Gm6981
- ENSMUSG00000086732
When assessing the overall sample contribution through their summary eigengenes it appears that for darkslateblue all hippocampus had a positive effect while hypothalamus and prefrontal cortex had a negative effect. Hypothalumus and prefrontal cortex had under-expressed genes while hippocampus had over-expressed genes.
The top 10 genes that were significant for tissue within the chocolate3 module and had the highest correlation with chocolate3 were:
- Rpl10-ps3
- Bcl7a
- Psma2
- Rpl14
- Med1
- Laptm5
- Hsdl2
- Rit2
- Klhdc9
- Mark3
Treatment
The top 10 genes that were significant for treatment within the royalblue module and had the highest correlation with royalblue were:
- Mb21d2
- Vmn1r-ps128
- Pola1
- Elac1
- Fras1
- ENSMUSG00000037469
- Slc39a11
- Ctps
- Pkd2
- ENSMUSG00000083819
When assessing the overall sample contribution through their summary eigengenes it appears that for royalblue most controls had a negative effect while most 2DG had a positive effect. Controls had under-expressed genes while 2DG had over-expressed genes.
Time
None
Treatment by tissue
The top 10 genes that were significant for treatment by tissue within the royalblue module and had the highest correlation with royalblue were:
- Gdi1
- Gucy1b3
- Vmn1r-ps128
- Btbd9
- Pola1
- Trim35
- Elac1
- Pelo
- Ly6e
- Pkd2
When assessing the overall sample contribution through their summary eigengenes it appears that for royalblue most controls had a negative effect while most 2DG had a positive effect, independent of tissue. Controls had under-expressed genes while 2DG had over-expressed genes.
Treatment by time
The top 10 genes that were significant for treatment by time within the royalblue module and had the highest correlation with royalblue were:
- Snx19
- Mb21d2
- Gdi1
- Vmn1r-ps128
- Clptm1
- Pola1
- Trim35
- Elac1
- Fras1
- Pelo
When assessing the overall sample contribution through their summary eigengenes it appears that for royalblue most controls had a negative effect while most 2DG had a positive effect, independent of time. Controls had under-expressed genes while 2DG had over-expressed genes.
Tissue by time
The top 10 genes that were significant for tissue by time within the lavenderblush3 module and had the highest correlation with lavenderblush3 were:
- Herc2
- Ino80e
- Rab7
- Id4
- 4632415L05Rik
- Gtf3c4
- Tagln4
- Map3k19
- Mlc1
- Amer2
The top 10 genes that were significant for tissue by time within the chocolate3 module and had the highest correlation with chocolate3 were:
- Bcl7a
- Psma2
- Rpl14
- Med1
- Laptm5
- Hsdl2
- Rit2
- Klhdc9
- Mark3
- Hcrtr2
Treatment by tissue by time
The top 10 genes that were significant for treatment by tissue by time within the royalblue module and had the highest correlation with royalblue were:
- Gdi1
- Gucy1b3
- Vmn1r-ps128
- Btbd9
- Pola1
- Trim35
- Elac1
- Pelo
- Ly6e
- Pkd2
When assessing the overall sample contribution through their summary eigengenes it appears that for royalblue most controls had a negative effect while most 2DG had a positive effect, independent of tissue and time. Controls had under-expressed genes while 2DG had over-expressed genes.
Analysis performed by Ann Wells
The Carter Lab The Jackson Laboratory 2023
ann.wells@jax.org