Summary Liver
Ann Wells
April 23, 2023
Summary
needed.packages <- c("tidyverse", "here", "functional", "gplots", "dplyr", "GeneOverlap", "R.utils", "reshape2","magrittr","data.table", "RColorBrewer","preprocessCore", "ARTool","emmeans", "phia", "gProfileR","rlist", "pheatmap","WGCNA")
for(i in 1:length(needed.packages)){library(needed.packages[i], character.only = TRUE)}

source(here("source_files","WGCNA_source.R"))
There were 16 samples (4 per time and treatment). Mice were fed 2DG (6g/L) or nothing in their water for 96hrs or 2 weeks. WGCNA analysis was performed to determine gene clustering. A soft-thresholding power was chosen so that the scale-free topology correlation attempts to hit 0.9. The power chosen for liver was 3, which allowed the correlations to hover around 0.93. This power clustered the genes into 50 modules originally, however, modules that were highly correlated (0.75 or higher) were further merged together to create 31 modules.
modules<-read.csv(here("Data","Liver","log.tdata.FPKM.sample.info.subset.liver.WGCNA.module.membership.csv"), header=T)

module_barplot(modules)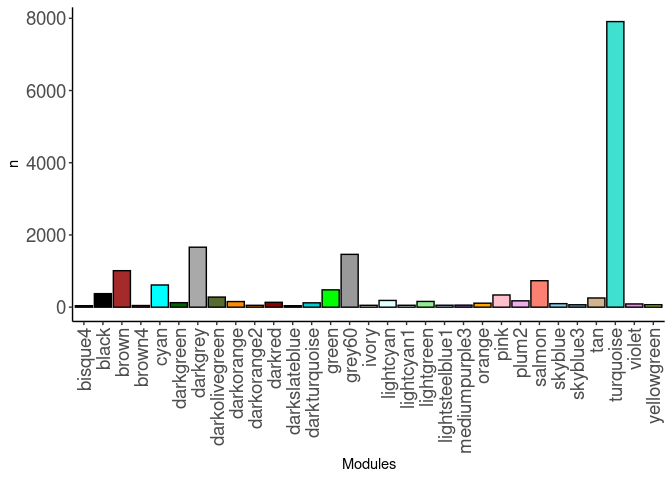
Pathways
Pathways were assessed for each module. Out of 31 modules, only 21 modules had pathway hits of any kind. The pathways that had the highest frequency across modules were metabolism and various aspects of mitochondrial function. The brown, darkorange, darkred, grey60, skyblue3, and turquoise modules all contained these pathways.
Black
14 pathways were identified in the black module. The pathways were related to calcium signaling, Th1 and 2 differentiation, Th17 differentiation, cell adhesion molecules, and autoimmune disease.
Brown
26 pathways were identified in the brown module. The pathways were related to metabolism, mitochondrial metabolism, oxidative phosphorylation, TCA cycle, respiratory electron transport, thermogenesis, neurodegenerative diseases, translation, and branched chain amino acid degradation.
Brown4
2 pathways were identified in the brown4 module. They were adherens junction and steroid biosynthesis.
Darkgrey
1 pathway (protein processing in the endoplasmic reticulum) was identified in the darkgrey module.
Darkolivegreen
1 pathway (nicotinate metabolism) was identified in the darkolivegreen module.
Darkorange
21 pathways were identified in the darkorange module. The pathways were related to cap-dependent translation, rRNA, metabolism of RNA and proteins, and translation.
Darkorange2
6 pathways were identified in the darkorange2 module. The pathways identified were related to ion transport.
Darkred
21 pathways were identified in the darkred module. The pathways were related to fatty acid metabolism, metabolism, mitochondrial metabolism, tryptophan metabolism, retinol metabolism, and sterols.
Darkturquoise
2 pathways were identified in the darkturquoise module. They were influenza A and various types of n-glycan biosynthesis.
Green
26 pathways were identified in the green module. The pathways were related to cardiac function, muscle contraction, insulin secretion, type II diabetes, GABA, and ion homeostasis.
Grey60
13 pathways were identified in the grey60 module. The pathways were related to SUMOylation, complement, metabolism of proteins, RNA polymerase II, cell cycle, and metabolism of proteins.
Lightcyan
2 pathways were identified in the lightcyan module. These pathways were biosynthesis of DPA-derived SPMs and Biosynthesis of DPAn-3 SPMs.
Lightgreen
6 pathways were identified in the lightgreen module. The pathways identified were related to digestion and carbohydrate absorption and metabolism.
Orange
1 pathway (nicotine addiction) was identified in the orange module.
Pink
10 pathways were identified in the pink module. The pathways identified were related to digestion, defensins, and staphylococcus aureus infection.
Plum2
5 pathways were identified in the plum2 module. The pathways identified were related to cancer, nicotine addiction, and wnt signaling.
Salmon
236 pathways were identified in the salmon module. The pathways were related to APC, beta-oxidation, cell cycle, cellular responses, DNA, interleukin-1, metabolism, mitochondrial metabolism, mRNA, NF-kappa B, nonsense mediated decay, oxidative phosphorylation, p53, PPAR signaling, RNA polymerase II, rRNA, signaling, TCA cycle, transcriptional regulation, translation, thermogenesis, ubiquitin, and VLDL.
Skyblue3
91 pathways were identified in the skyblue3 module. The pathways were related to APC, cell cycle, metabolism, p53, NADPH regeneration, interleukin-1, TCR signaling, transcriptional regulation, and ubiquitin.
Turquoise
220 pathways were identified in the turquoise module. The pathways were related to adipocytokine signaling, apoptosis, AMPK signaling, autophagy, biosynthesis of amino acids and co-factors, antigen processing, cell cycle, MHC I mediated antigen processing and presentation, collagen, fatty acid metabolism, fructose and mannose metabolism, glucagon signaling, glycerophospholipids, amino acid metabolism, glycosaminoglcans, cancer, autoimmune disease, immunity, insulin, LDL, toll like receptors, metabolism, MyD88, neutrophil degranulation, NF-kappa B, notch signaling, MAPK, n-glycan biosynthesis, platelet activation, protein processing of the ER, signaling, t cell receptor signaling, vasopressin and VEGF, and vitamin digestion and absorption.
Violet
19 pathways were identified in the violet module. The pathways were related to cell cycle, MHC II antigen presentation, nuclear envelope, and p53.
tdata.FPKM.sample.info <- readRDS(here("Data","20190406_RNAseq_B6_4wk_2DG_counts_phenotypes.RData"))

tdata.FPKM <- readRDS(here("Data","20190406_RNAseq_B6_4wk_2DG_counts_numeric.RData"))

log.tdata.FPKM <- log(tdata.FPKM + 1)
log.tdata.FPKM <- as.data.frame(log.tdata.FPKM)

log.tdata.FPKM.sample.info <- cbind(log.tdata.FPKM, tdata.FPKM.sample.info[,27238:27240])

log.tdata.FPKM.sample.info <- log.tdata.FPKM.sample.info %>% rownames_to_column() %>% filter(rowname != "A113") %>% column_to_rownames()

log.tdata.FPKM.subset <- log.tdata.FPKM[,colMeans(log.tdata.FPKM != 0) > 0.5]

log.tdata.FPKM.subset <- log.tdata.FPKM.subset %>% rownames_to_column() %>% filter(rowname != "A113") %>% column_to_rownames()

log.tdata.FPKM.sample.info.subset.liver <- log.tdata.FPKM.sample.info %>% rownames_to_column() %>% filter(Tissue == "Liver") %>% column_to_rownames()

log.tdata.FPKM.subset <- subset(log.tdata.FPKM.sample.info.subset.liver, select = -c(Time,Treatment,Tissue))

WGCNA.pathway <-readRDS(here("Data","Liver","Chang_B6_96hr_4wk_gprofiler_pathway_annotation_list_liver_WGCNA.RData"))

Matched<-readRDS(here("Data","Liver","Annotated_genes_in_liver_WGCNA_Chang_B6_96hr_4wk.RData"))


module.names <- Matched$X..Module.
name <- str_split(module.names,"_")
samples <-c()
for(i in 1:length(name)){
samples[[i]] <- name[[i]][2]
}
name <- str_split(samples,"\"")
name <- unlist(name)

Treatment <- unclass(as.factor(log.tdata.FPKM.sample.info.subset.liver[,27238]))
Time <- unclass(as.factor(log.tdata.FPKM.sample.info.subset.liver[,27237]))
Treat.Time <- paste0(Treatment, Time)
phenotype <- data.frame(cbind(Treatment, Time, Treat.Time))

nSamples <- nrow(log.tdata.FPKM.sample.info.subset.liver)

MEs0 <- read.csv(here("Data","Liver","log.tdata.FPKM.sample.info.subset.liver.WGCNA.module.eigens.csv"),header = T, row.names = 1)
name <- str_split(names(MEs0),"_")
samples <-c()
for(i in 1:length(name)){
samples[[i]] <- name[[i]][2]
}
name <- str_split(samples,"\"")
name <- unlist(name)
colnames(MEs0) <-name
MEs <- orderMEs(MEs0)
moduleTraitCor <- cor(MEs, phenotype, use = "p");
moduleTraitPvalue <- corPvalueStudent(moduleTraitCor, nSamples)
Relationship between Modules and Traits
#sizeGrWindow(10,6)
# Will display correlations and their p-values
textMatrix = paste(signif(moduleTraitCor, 2), "\n(",
                        signif(moduleTraitPvalue, 1), ")", sep = "");
dim(textMatrix) = dim(moduleTraitCor)

# Display the correlation values within a heatmap plot
heat <- pheatmap(moduleTraitCor, main = paste("Module-trait relationships"), display_numbers = textMatrix,color=colorRampPalette(brewer.pal(n = 11, name = "Paired"))(10), cluster_rows = F, cluster_cols = F, fontsize_number = 4, angle_col = 45, number_color = "black", border_color = "white")
heat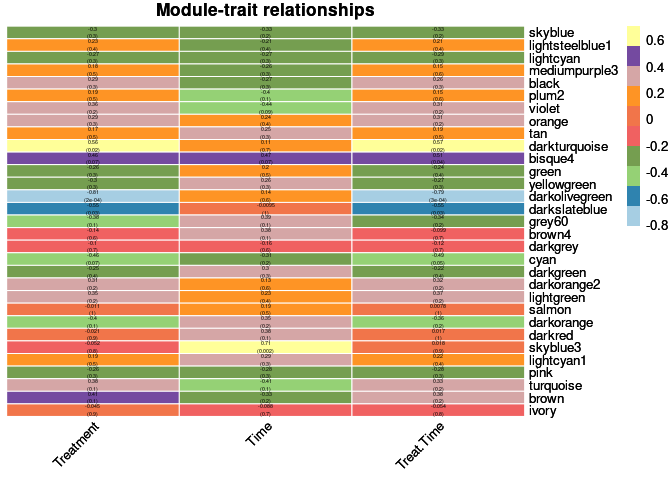
Top 10 Hub genes within each significant module
Treatment
The top 10 genes that were significant for treatment within the darkturquoise module and had the highest correlation with darkturquoise were:
- Lrrc18
- Ankfy1
- H2-M3
- A730011C13Rik
- ENSMUSG00000053714
- Slc30a9
- ENSMUSG00000086507
- Nt5c2
- Rgs9
- Pigz
When assessing the overall sample contribution through their summary eigengenes it appears that for darkturquoise controls had a positive and negative effect while 2DG had a negative effect. Controls had over and under-expressed genes while 2DG had mostly under-expressed genes.
The top 10 genes that were significant for treatment within the darkolivegreen module and had the highest correlation with darkolivegreen were:
- N4bp2l1
- Sumo3
- Asb13
- ENSMUSG00000040891
- Gm7292
- Dchs1
- Cacnb3
- ENSMUSG00000078180
- Dscc1
- Plac8
When assessing the overall sample contribution through their summary eigengenes it appears that for darkolivegreen controls had a negative effect while 2DG had a positive effect. Controls had under-expressed genes while 2DG had over-expressed genes.
Time
The top 10 genes that were significant for time within the skyblue3 module and had the highest correlation with skyblue3 were:
- Snrpe
- 1600002K03Rik
- Gpr176
- Uba52
- Ndufb7
- Sumo2
- ENSMUSG00000084411
- Zfp59
- Loxl3
- Chrac1
When assessing the overall sample contribution through their summary eigengenes it appears that for darkolivegreen 96 hrs, independent of treatment, had a positive effect while 4 wk, independent of treatment, had a negative effect. 96 hrs had over-expressed genes while 4 weeks had under-expressed genes.
Treatment by time
The top 10 genes that were significant for treatment by time within the darkturquoise module and had the highest correlation with darkturquoise were:
- Lrrc18
- Ankfy1
- H2-M3
- A730011C13Rik
- 1110002L01Rik
- ENSMUSG00000053714
- Slc30a9
- Nt5c2
- Rgs9
- Rpgr
When assessing the overall sample contribution through their summary eigengenes it appears that for darkturquoise controls had a half positive and half negative effect for each time point while 2DG had a negative effect with the exception of one 4 wk sample. Controls had over and under-expressed genes while 2DG had mostly under-expressed genes.
The top 10 genes that were significant for treatment by time within the darkolivegreen module and had the highest correlation with darkolivegreen were:
- N4bp2l1
- Zxda
- Asb13
- ENSMUSG00000040891
- Gm7292
- Dchs1
- Gatad1
- Cacnb3
- G630016G05Rik
- Lypla2
When assessing the overall sample contribution through their summary eigengenes it appears that for darkolivegreen controls had a negative effect while 2DG had a positive effect, all independent of time. Controls had under-expressed genes while 2DG had over-expressed genes.
Analysis performed by Ann Wells
The Carter Lab The Jackson Laboratory 2023
ann.wells@jax.org