Summary Heart
Ann Wells
April 23, 2023
Summary
needed.packages <- c("tidyverse", "here", "functional", "gplots", "dplyr", "GeneOverlap", "R.utils", "reshape2","magrittr","data.table", "RColorBrewer","preprocessCore", "ARTool","emmeans", "phia", "gProfileR","rlist", "pheatmap", "WGCNA")
for(i in 1:length(needed.packages)){library(needed.packages[i], character.only = TRUE)}

source(here("source_files","WGCNA_source.R"))
There were 16 samples (4 per time and treatment). Mice were fed 2DG (6g/L) or nothing in their water for 96hrs or 4 weeks. WGCNA analysis was performed to determine gene clustering. A soft-thresholding power was chosen so that the scale-free topology correlation attempts to hit 0.9. The power chosen for heart was 5, which allowed the correlations to hover around 0.88. This power clustered the genes into 42 modules originally, however, modules that were highly correlated (0.75 or higher) were further merged together to create 25 modules.
modules<-read.csv(here("Data","Heart","log.tdata.FPKM.sample.info.subset.heart.WGCNA.module.membership.csv"), header=T)

module_barplot(modules)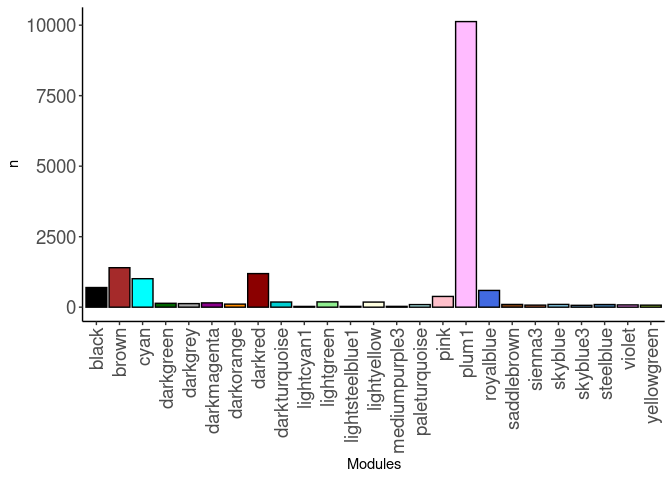
Pathways
Pathways were assessed for each module. Out of 25 modules, only 12 modules had pathway hits of any kind. The pathways that had the highest frequency across modules were mitochondrial related (mitochondrial translation, elongation, and termination). The black, brown, and darkgreen modules all contained these pathways. Innate immune system was another pathway hit that was identified in the black, cyan, and darkgrey modules.
Black
151 pathways were identified for the Black module. Many pathways had to do with various aspects of transcription and translation. The innate immune system was also an affected pathway. Several pathways that also play a role in cancer were identified.
Brown
193 pathways were identified for the Brown module. Many pathways involved in cell cycle and RNA were present.
Cyan
7 pathways were identified for the cyan module. These pathways included the innate immune system, complement pathways, neutrophil degradation, as well as, sphingolipid metabolism, phagosomes, and platelet degradation.
Darkgreen
8 pathways were identified for the darkgreen module. Overall, metabolism was identified in this module through mitochondrial pathways, pyruvate dehydrogenase, and the TCA cycle.
Darkgrey
36 pathways were identified for the darkgrey module. Overall, many different aspects of immunity were identified within this module, as well as pathways related to platelet function, and rheumatoid arthritis.
Lightgreen
11 pathways were identified for the lightgreen module. IL-17, TNF signaling, neutrophil degradation, and viral protein interaction with cytokine and cytokine receptor were among the pathways identified.
Mediumpurple3
1 pathway was identified for the mediumpurple3 module. Histidine metabolism was identified.
Pink
92 pathways were identified for the pink module. Overall, different aspects of fatty acid metabolism we identified, as well as amino acid metabolism.
Plum1
Plum1 contained the largest number of genes, which spanned across 236 pathways. The pathways that contained the largest number of genes from plum1 played a role in protein metabolism and post-translational protein modification, as well as transcription, adaptive immunity, vesicle-mediated transport, and membrane trafficking.
Skyblue
8 pathways were identified for the skyblue module. The module only contained pathways related to digestion, particularly carbohydrate digestion.
Modules, Traits, Genes, and Sample Effects
When looking at the relationship between modules and traits, treatment and treatment by time were highly positively correlated with the darkorange module and highly negatively correlated with the darkgreen module. Time was highly positively correlated the plum1 module.
tdata.FPKM.sample.info <- readRDS(here("Data","20190406_RNAseq_B6_4wk_2DG_counts_phenotypes.RData"))

tdata.FPKM <- readRDS(here("Data","20190406_RNAseq_B6_4wk_2DG_counts_numeric.RData"))

log.tdata.FPKM <- log(tdata.FPKM + 1)
log.tdata.FPKM <- as.data.frame(log.tdata.FPKM)

log.tdata.FPKM.sample.info <- cbind(log.tdata.FPKM, tdata.FPKM.sample.info[,27238:27240])

log.tdata.FPKM.sample.info <- log.tdata.FPKM.sample.info %>% rownames_to_column() %>% filter(rowname != "A113") %>% column_to_rownames()

log.tdata.FPKM.subset <- log.tdata.FPKM[,colMeans(log.tdata.FPKM != 0) > 0.5]

log.tdata.FPKM.subset <- log.tdata.FPKM.subset %>% rownames_to_column() %>% filter(rowname != "A113") %>% column_to_rownames()

log.tdata.FPKM.sample.info.subset.heart <- log.tdata.FPKM.sample.info %>% rownames_to_column() %>% filter(Tissue == "Heart") %>% column_to_rownames()

log.tdata.FPKM.subset <- subset(log.tdata.FPKM.sample.info.subset.heart, select = -c(Time,Treatment,Tissue))

WGCNA.pathway <-readRDS(here("Data","Heart","Chang_B6_96hr_4wk_gprofiler_pathway_annotation_list_heart_WGCNA.RData"))

Matched<-readRDS(here("Data","Heart","Annotated_genes_in_heart_WGCNA_Chang_B6_96hr_4wk.RData"))


module.names <- Matched$X..Module.
name <- str_split(module.names,"_")
samples <-c()
for(i in 1:length(name)){
samples[[i]] <- name[[i]][2]
}
name <- str_split(samples,"\"")
name <- unlist(name)

Treatment <- unclass(as.factor(log.tdata.FPKM.sample.info.subset.heart[,27238]))
Time <- unclass(as.factor(log.tdata.FPKM.sample.info.subset.heart[,27237]))
Treat.Time <- paste0(Treatment, Time)
phenotype <- data.frame(cbind(Treatment, Time, Treat.Time))

nSamples <- nrow(log.tdata.FPKM.sample.info.subset.heart)

MEs0 <- read.csv(here("Data","Heart","log.tdata.FPKM.sample.info.subset.heart.WGCNA.module.eigens.csv"),header = T, row.names = 1)
name <- str_split(names(MEs0),"_")
samples <-c()
for(i in 1:length(name)){
samples[[i]] <- name[[i]][2]
}
name <- str_split(samples,"\"")
name <- unlist(name)
colnames(MEs0) <-name
MEs <- orderMEs(MEs0)
moduleTraitCor <- cor(MEs, phenotype, use = "p");
moduleTraitPvalue <- corPvalueStudent(moduleTraitCor, nSamples)
Relationship between Modules and Traits
#sizeGrWindow(10,6)
# Will display correlations and their p-values
textMatrix = paste(signif(moduleTraitCor, 2), "\n(",
                        signif(moduleTraitPvalue, 1), ")", sep = "");
dim(textMatrix) = dim(moduleTraitCor)

# Display the correlation values within a heatmap plot
heat <- pheatmap(moduleTraitCor, main = paste("Module-trait relationships"), display_numbers = textMatrix,color=colorRampPalette(brewer.pal(n = 11, name = "Paired"))(10), cluster_rows = F, cluster_cols = F, fontsize_number = 4, angle_col = 45, number_color = "black", border_color = "white")
heat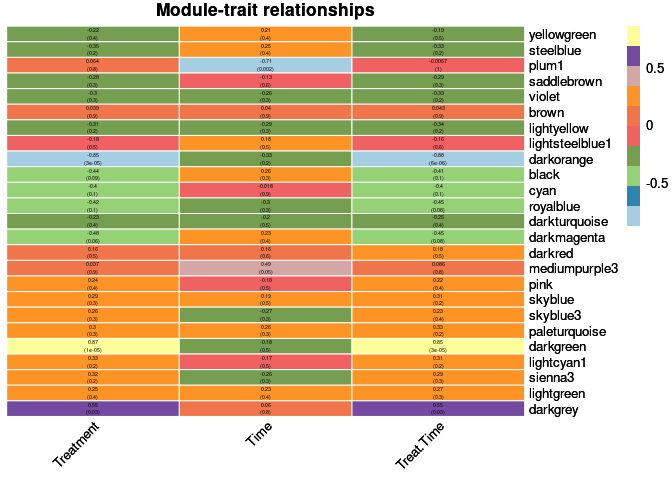
Top 10 Hub genes within each significant module
Treatment
The top 10 genes that were significant for treatment within the darkorange module and had the highest correlation with darkorange were:
- Mtcp1
- D630036H23Rik
- Parp10
- Ing1
- Tnni3k
- Zbtb18
- Pex7
- Gm14306
- Rassf7
- Apbb3
When assessing the overall sample contribution through their summary eigengenes it appears that for darkorange most controls had a negative effect while most 2DG had a positive effect, indicating that there are a lot of under-expressed genes for control mice and over-expressed genes for 2DG treated mice.
The top 10 genes that were significant for treatment within the darkgreen module and had the highest correlation with darkgreen were:
- Zfand1
- Gfra3
- Prmt5
- Inpp5e
- Mrpl37
- Sesn3
- Hmgcs1
- Sirt2
- Mcl1
- Epb4
When assessing the overall sample contribution through their summary eigengenes it appears that for darkgreen all controls had a positive effect while 2DG had a negative effect, indicating that there are a lot of over-expressed genes for control mice and under-expressed genes for 2DG treated mice.
Treatment by time
The top 10 genes that were significant for treatment by time within the darkorange module and had the highest correlation with darkorange were:
- Mtcp1
- Tnni3k
- Ing1
- Gm14306
- Rassf7
- Apbb3
- Gm14340
- Ppox
- Mmgt2
- Sft2d1
When assessing the overall sample contribution through their summary eigengenes it appears that for darkorange, regardless of time, most controls had a negative effect while most 2DG had a positive effect, indicating that there are a lot of under-expressed genes for control mice and over-expressed genes for 2DG treated mice.
The top 10 genes that were significant for treatment by time within the darkgreen module and had the highest correlation with darkgreen were:
- Zfand1
- Zscan22
- Mfn2
- Map3k3
- Larp4b
- Mvp
- Gfra3
- Ripl1
- Prmt5
- Snx17
When assessing the overall sample contribution through their summary eigengenes it appears that for darkgreen, regardless of time point, all controls had a positive effect while 2DG had a negative effect, indicating that there are a lot of over-expressed genes for control mice and under-expressed genes for 2DG treated mice.
Time
The top 10 genes that were significant for time within the plum1 module and had the highest correlation with plum1 were:
- Man1a
- Lrig3
- Vsig10
- Cacna1d
- Gm14378
- Lpp
- Tlcd1
- Plvap
- ENSMUSG00000087433
- Lrcc73
When assessing the overall sample contribution through their summary eigengenes it appears that for plum1 the 96hr time point had a negative effect while 4 weeks had a positive effect on the module, indicating that there are a lot of under-expressed genes at 96 hours and over-expressed genes at 4 weeks.
Analysis performed by Ann Wells
The Carter Lab The Jackson Laboratory 2023
ann.wells@jax.org