Summary Kidney
Ann Wells
April 23, 2023
Summary
needed.packages <- c("tidyverse", "here", "functional", "gplots", "dplyr", "GeneOverlap", "R.utils", "reshape2","magrittr","data.table", "RColorBrewer","preprocessCore", "ARTool","emmeans", "phia", "gProfileR","rlist", "pheatmap", "WGCNA")
for(i in 1:length(needed.packages)){library(needed.packages[i], character.only = TRUE)}

source(here("source_files","WGCNA_source.R"))
There were 16 samples (4 per time and treatment). Mice were fed 2DG (6g/L) or nothing in their water for 96hrs or 2 weeks. WGCNA analysis was performed to determine gene clustering. A soft-thresholding power was chosen so that the scale-free topology correlation attempts to hit 0.9. The power chosen for kidney was 3, which allowed the correlations to hover around 0.90. This power clustered the genes into 24 modules originally, however, modules that were highly correlated (0.75 or higher) were further merged together to create 17 modules.
modules<-read.csv(here("Data","Kidney","log.tdata.FPKM.sample.info.subset.kidney.WGCNA.module.membership.csv"), header=T)

module_barplot(modules)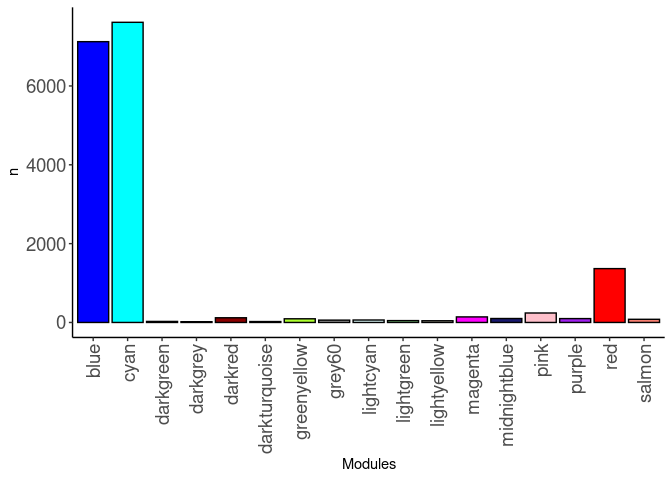
Pathways
Pathways were assessed for each module. Out of 17 modules, only 12 modules had pathway hits of any kind. The pathways that had the highest frequency across modules were metabolic pathways and collagen. The blue, cyan, pink, and red modules all contained these pathways.
Blue
47 pathways were identified for the blue module. The pathways identified were involved in cell cycle, BCAA metabolism, DNA pathways, general metabolism, post-translational modification, and Class 1 MHC processing and presentation.
Cyan
107 pathways identified for the cyan module. The pathways identified were involved in several cancers, insulin signaling, toll like receptors, and cancer pathways.
Darkgreen module
12 pathways were identified for the darkgreen module. The pathways identified were involved in DNA repair, PPAR signaling, and protein digestion and absorption.
Darkgrey
2 pathways were identified for the darkgrey module, ABC transporters and neurotrophin signaling pathway.
Darkred
2 pathways were identified for the darkred module, SLC-mediated transmembrane transport and transport of small molecules.
Darkturquoise
11 pathways were identified for the darkturquoise module. The pathways identified were involved in collagen, extracellular matrix, calcium and potassium channels, and protein digestion and absorption.
Grey60
4 pathways were identified for the grey60 module. The pathways involved were glutamatergic synapse, neurexins and neuroligins, neuronal system, and protein-protein interactions at synapses.
Lightgreen
2 pathways were identified for the lightgreen module, potassium channels and voltage gated potassium channels.
Lightyellow
3 pathways were identified for the lightyellow module, mitotic spindle checkpoint, phosphorylation of the APC/C, regulation fo APC/C activators between G1/S and early anaphase.
Magenta
3 pathways were identified for the magenta module, arrhythmogenic right ventricular cardiomyopathy, muscle contraction, and striated muscle contraction.
Pink
73 pathways were identified for the pink module. The pathways identified were involved in bile acid metabolism, chylomicron pathways, complement pathways, HDL pathways, innate immunity, general metabolism, plasma pathways, and VLDL pathways.
Red
101 pathways were identified for the red module. The pathways identified were involved in Alzheimer’s disease, external cellular response (hypoxia, stress), general metabolism, mRNA and RNA pathways, NAFLD, and triglyceride biosynthesis.
tdata.FPKM.sample.info <- readRDS(here("Data","20190406_RNAseq_B6_4wk_2DG_counts_phenotypes.RData"))

tdata.FPKM <- readRDS(here("Data","20190406_RNAseq_B6_4wk_2DG_counts_numeric.RData"))

log.tdata.FPKM <- log(tdata.FPKM + 1)
log.tdata.FPKM <- as.data.frame(log.tdata.FPKM)

log.tdata.FPKM.sample.info <- cbind(log.tdata.FPKM, tdata.FPKM.sample.info[,27238:27240])

log.tdata.FPKM.sample.info <- log.tdata.FPKM.sample.info %>% rownames_to_column() %>% filter(rowname != "A113") %>% column_to_rownames()

log.tdata.FPKM.subset <- log.tdata.FPKM[,colMeans(log.tdata.FPKM != 0) > 0.5]

log.tdata.FPKM.subset <- log.tdata.FPKM.subset %>% rownames_to_column() %>% filter(rowname != "A113") %>% column_to_rownames()

log.tdata.FPKM.sample.info.subset.kidney <- log.tdata.FPKM.sample.info %>% rownames_to_column() %>% filter(Tissue == "Kidney") %>% column_to_rownames()

log.tdata.FPKM.subset <- subset(log.tdata.FPKM.sample.info.subset.kidney, select = -c(Time,Treatment,Tissue))

WGCNA.pathway <-readRDS(here("Data","Kidney","Chang_B6_96hr_4wk_gprofiler_pathway_annotation_list_kidney_WGCNA.RData"))

Matched<-readRDS(here("Data","Kidney","Annotated_genes_in_kidney_WGCNA_Chang_B6_96hr_4wk.RData"))


module.names <- Matched$X..Module.
name <- str_split(module.names,"_")
samples <-c()
for(i in 1:length(name)){
samples[[i]] <- name[[i]][2]
}
name <- str_split(samples,"\"")
name <- unlist(name)

Treatment <- unclass(as.factor(log.tdata.FPKM.sample.info.subset.kidney[,27238]))
Time <- unclass(as.factor(log.tdata.FPKM.sample.info.subset.kidney[,27237]))
Treat.Time <- paste0(Treatment, Time)
phenotype <- data.frame(cbind(Treatment, Time, Treat.Time))

nSamples <- nrow(log.tdata.FPKM.sample.info.subset.kidney)

MEs0 <- read.csv(here("Data","Kidney","log.tdata.FPKM.sample.info.subset.kidney.WGCNA.module.eigens.csv"),header = T, row.names = 1)
name <- str_split(names(MEs0),"_")
samples <-c()
for(i in 1:length(name)){
samples[[i]] <- name[[i]][2]
}
name <- str_split(samples,"\"")
name <- unlist(name)
colnames(MEs0) <-name
MEs <- orderMEs(MEs0)
moduleTraitCor <- cor(MEs, phenotype, use = "p");
moduleTraitPvalue <- corPvalueStudent(moduleTraitCor, nSamples)
Relationship between Modules and Traits
#sizeGrWindow(10,6)
# Will display correlations and their p-values
textMatrix = paste(signif(moduleTraitCor, 2), "\n(",
                        signif(moduleTraitPvalue, 1), ")", sep = "");
dim(textMatrix) = dim(moduleTraitCor)

# Display the correlation values within a heatmap plot
heat <- pheatmap(moduleTraitCor, main = paste("Module-trait relationships"), display_numbers = textMatrix,color=colorRampPalette(brewer.pal(n = 11, name = "Paired"))(10), cluster_rows = F, cluster_cols = F, fontsize_number = 4, angle_col = 45, number_color = "black", border_color = "white")
heat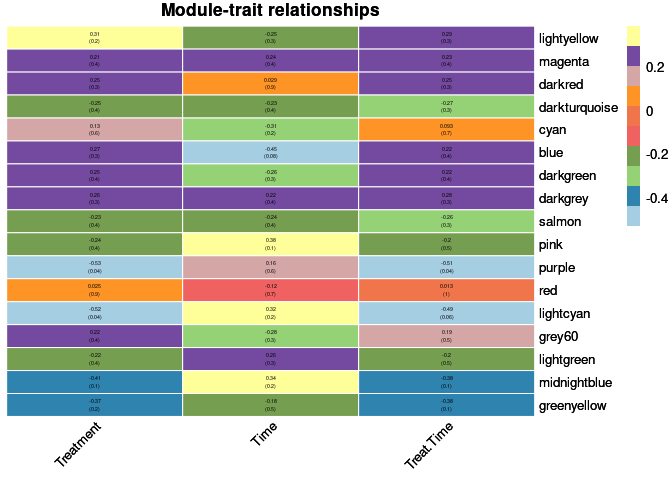
Top 10 Hub genes within each significant module
Treatment
The top 10 genes that were significant for treatment within the lightyellow module and had the highest correlation with lightyellow were:
- Grin3b
- ENSMUSG00000081674
- ENSMUSG00000094749
- ENSMUSG00000084896
- Gm15797
- Wfikkn2
- Iscu
- ENSMUSG00000075589
- C1qtfn6
- Spink4
When assessing the overall sample contribution through their summary eigengenes it appears that for lightyellow all mice had a negative effect with the exception of one 4 wk control and one 96 hr control. All samples with a negative effect had mostly under-expressed genes while the two positive samples had mostly over-expressed genes.
The top 10 genes that were significant for treatment within the purple module and had the highest correlation with purple were:
- Fam57a
- ENSMUSG00000021944
- ENSMUSG00000095547
- ENSMUSG00000084132
- Rfc4
- Pcdhb3
- Scnm1
- Grik4
- ENSMUSG00000074650
- Nrn1l
When assessing the overall sample contribution through their summary eigengenes it appears that for purple all mice had a negative effect with the exception of two 4 wk 2DG and two 96 hr 2DG. All samples with a negative effect had mostly under-expressed genes while the 4 positive samples had mostly over-expressed genes.
The top 10 genes that were significant for treatment within the lightcyan module and had the highest correlation with lightcyan were:
- Wnt6
- ENSMUSG00000089667
- Rps29
- Mrpl11
- Ndufa1
- Rft1
- Bccip
- Atox1
- Gm10241
- Gm5834
When assessing the overall sample contribution through their summary eigengenes it appears that for lightcyan controls mostly had a negative effect while 2DG had a positive effect. Controls had mostly under-expressed genes while 2DG had mostly over-expressed genes.
Time
The top 10 genes that were significant for time within the blue module and had the highest correlation with blue were:
- Tnfrsf21
- Rec8
- Iws1
- Ing1
- Syt15
- Slc25a35
- Zfp652
- Eya2
- Abcc10
- Pcgf6
When assessing the overall sample contribution through their summary eigengenes it appears that for blue controls mostly had a negative effect while 2DG had a half positive and half negative effect. Controls had mostly under-expressed genes while 2DG had both over and under-expressed genes.
The top 10 genes that were significant for time within the pink module and had the highest correlation with pink were:
- ENSMUSG00000091393
- Tmc8
- Mmd
- Rab27a
- Adamts2
- Gm26590
- ENSMUSG00000059864
- ENSMUSG00000070426
- Hmox2
- ENSMUSG00000086944
When assessing the overall sample contribution through their summary eigengenes it appears that for pink controls and 2DG mostly had a negative effect. 96 hr 2DG had mostly a positive effect. Controls and 2DG had mostly under-expressed genes while 96 hr 2DG samples had mostly over-expressed genes.
The top 10 genes that were significant for time within the lightcyan module and had the highest correlation with lightcyan were:
- Chka
- Mrpl30
- ENSMUSG00000074354
- Klf5
- Ddx17
- ENSMUSG00000092459
- 9830147E19Rik
- Car5b
- Atox1
- ENSMUSG00000054988
When assessing the overall sample contribution through their summary eigengenes it appears that for lightcyan controls mostly had a negative effect while 2DG had a positive effect, somewhat independent of time. Controls had mostly under-expressed genes while 2DG had mostly over-expressed genes.
The top 10 genes that were significant for time within the midnightblue module and had the highest correlation with midnightblue were:
- Noc3l
- Gm26588
- Rtel1
- Zfp189
- Ppp1cb
- Noxo1
- Cd37
- Zfp191
- Anp32e
- Ttc30b
When assessing the overall sample contribution through their summary eigengenes it appears that for midnightblue controls mostly had a negative effect while 4 wk 2DG had a negative effect and 96 hr 2DG had a positive effect. Controls had mostly under-expressed genes while 4wk 2DG had mostly under-expressed genes and 96 hr 2DG had mostly over-expressed genes.
Treatment by time
The top 10 genes that were significant for treatment by time within the lightyellow module and had the highest correlation with lightyellow were:
- Grin3b
- ENSMUSG00000081674
- ENSMUSG00000084896
- Gm15797
- Wfikkn2
- ENSMUSG00000086918
- Iscu
- Pbk
- ENSMUSG00000027077
- C1qtnf6
When assessing the overall sample contribution through their summary eigengenes it appears that for lightyellow all mice had a negative effect with the exception of one 4 wk control and one 96 hr control. All samples with a negative effect had mostly under-expressed genes while the two positive samples had mostly over-expressed genes.
The top 10 genes that were significant for treatment by time within the purple module and had the highest correlation with purple were:
- Fam57a
- Trnp1
- AV099323
- 4930447C04Rik
- ENSMUSG00000021944
- ENSMUSG00000095547
- ENSMUSG00000084132
- Lcat
- Mup10
- Abca1
When assessing the overall sample contribution through their summary eigengenes it appears that for purple all mice had a negative effect with the exception of two 4 wk 2DG and two 96 hr 2DG. All samples with a negative effect had mostly under-expressed genes while the 4 positive samples had mostly over-expressed genes.
The top 10 genes that were significant for treatment by time within the lightcyan module and had the highest correlation with lightcyan were:
- Gm561
- Wnt6
- ENSMUSG00000089667
- Rps29
- Mrpl11
- Ndufa1
- Zfc3h1
- Rft1
- Atox1
- Fam136a
When assessing the overall sample contribution through their summary eigengenes it appears that for lightcyan controls mostly had a negative effect while 2DG had a positive effect, somewhat independent of time. Controls had mostly under-expressed genes while 2DG had mostly over-expressed genes.
Analysis performed by Ann Wells
The Carter Lab The Jackson Laboratory 2023
ann.wells@jax.org