Cibersort Small Intestine
Ann Wells
April 23, 2023
This dataset contains nine tissues (heart, hippocampus, hypothalamus, kidney, liver, prefrontal cortex, skeletal liver, small intestine, and spleen) from C57BL/6J mice that were fed 2-deoxyglucose (6g/L) through their drinking water for 96hrs or 4wks. 96hr mice were given their 2DG treatment 2 weeks after the other cohort started the 4 week treatment. The organs from the mice were harvested and processed for metabolomics and transcriptomics. The data in this document pertains to the transcriptomics data only. The counts that were used were FPKM normalized before being log transformed. It was determined that sample A113 had low RNAseq quality and through further analyses with PCA, MA plots, and clustering was an outlier and will be removed for the rest of the analyses performed. This document will deconvolve the green4 module, as well as all genes identified in the small intestine due to the predominant immunological signature that was identified when looking at overrepresented pathways for the green4 module.
tdata.FPKM.sample.info <- readRDS(here("Data","20190406_RNAseq_B6_4wk_2DG_counts_phenotypes.RData"))
tdata.FPKM.sample.info.pheno <- tdata.FPKM.sample.info[,c(27238:27240)] %>% rownames_to_column()

cibersort <- read.csv(here("Data","Small Intestine","CIBERSORTx_Job16_Results.csv"))
cibersort <- cibersort[,-c(27:29)]
cibersort.phenotypes <- left_join(cibersort, tdata.FPKM.sample.info.pheno, by = c("Mixture" = "rowname"))
cibersort.phenotypes <- cibersort.phenotypes %>% column_to_rownames(var = "Mixture")
cibersort.phenotypes <- cibersort.phenotypes %>% mutate("Module" = rep("Green4",16))

cibersort.all <- read.csv(here("Data","Small Intestine","CIBERSORTx_Job29_Results.csv"))
cibersort.all <- cibersort.all[,-c(27:29)]
cibersort.all.phenotypes <- left_join(cibersort.all, tdata.FPKM.sample.info.pheno, by = c("Mixture" = "rowname"))
cibersort.all.phenotypes <- cibersort.all.phenotypes %>% column_to_rownames(var = "Mixture")
cibersort.all.phenotypes <- cibersort.all.phenotypes %>% mutate("Module" = rep("All",16))

cibersort.compare <- rbind(cibersort.phenotypes,cibersort.all.phenotypes)
Check Distribution
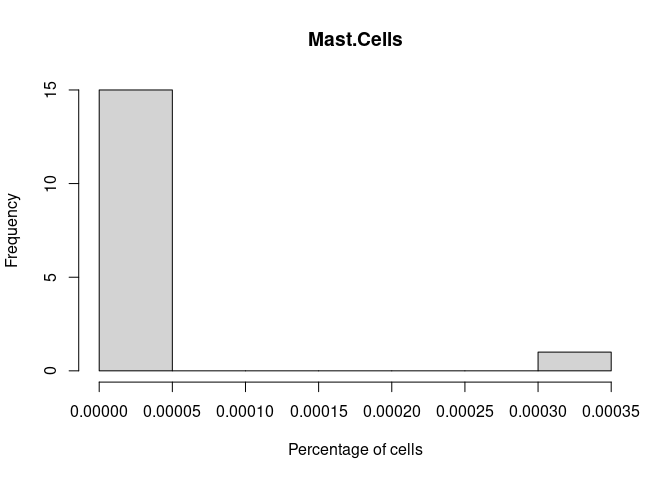
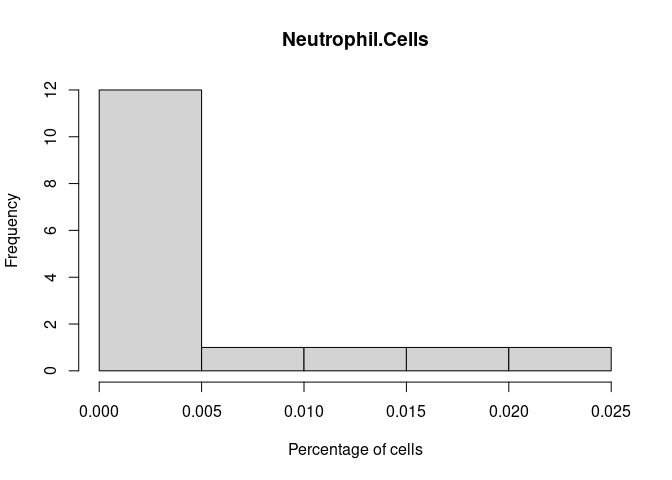
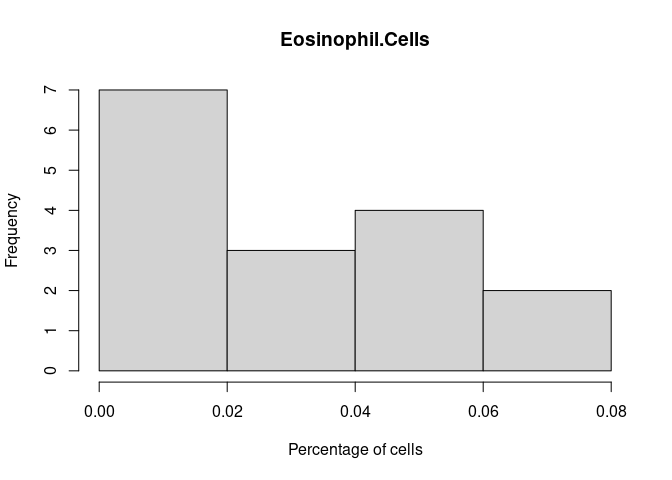
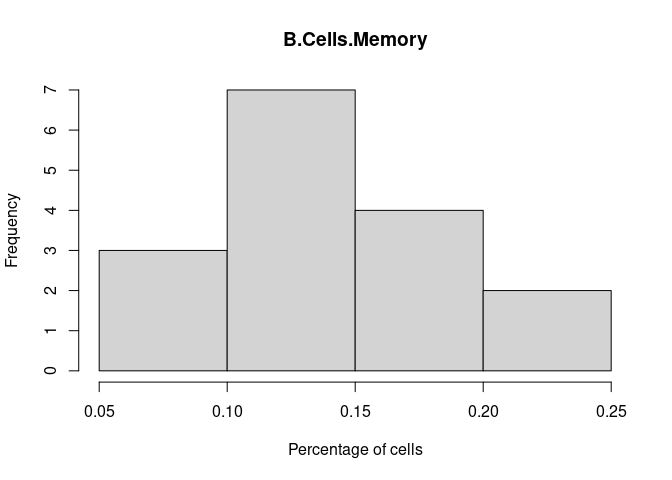
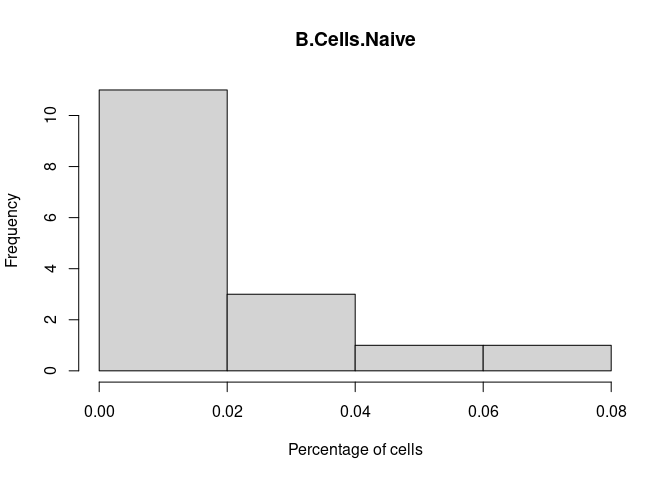
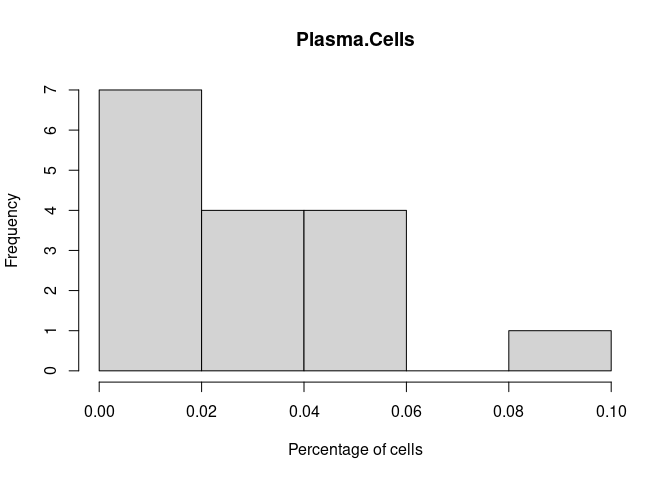
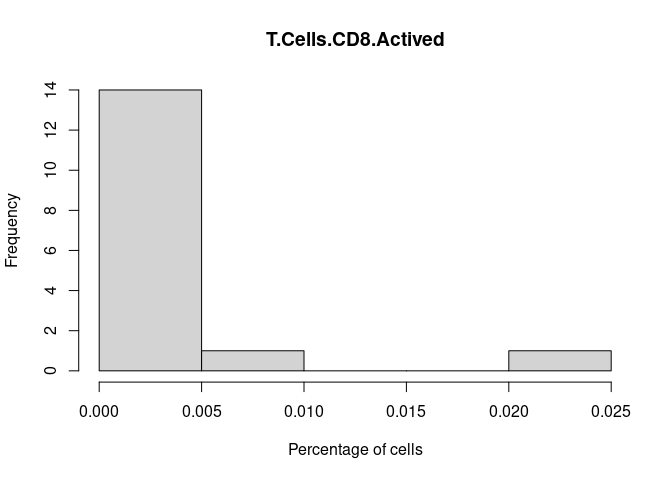
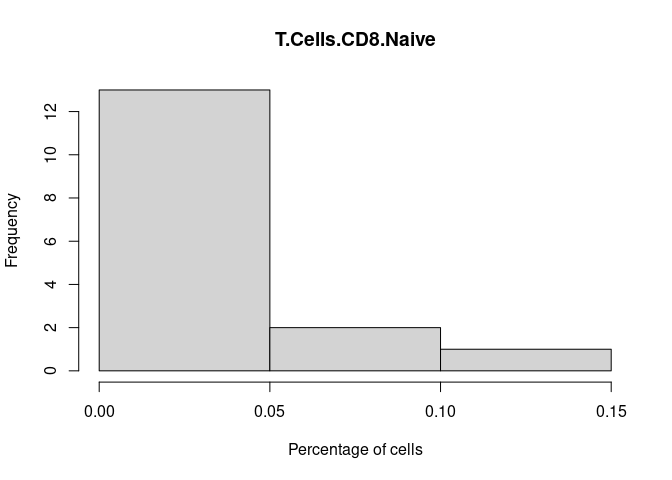
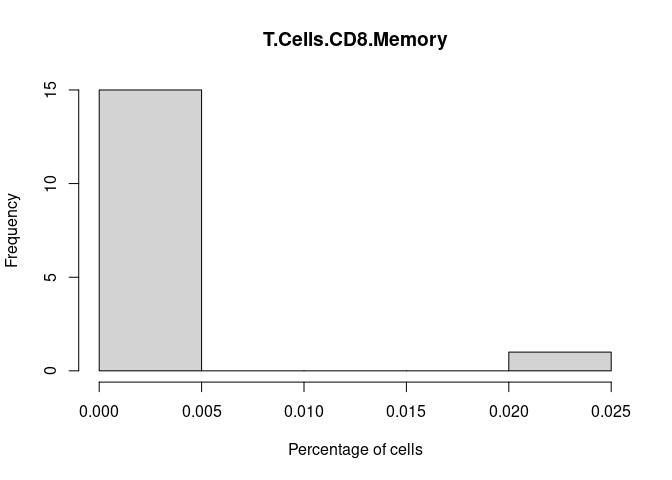
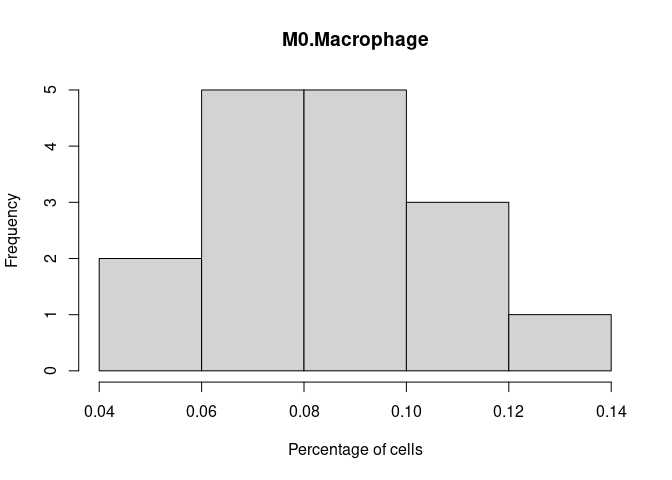
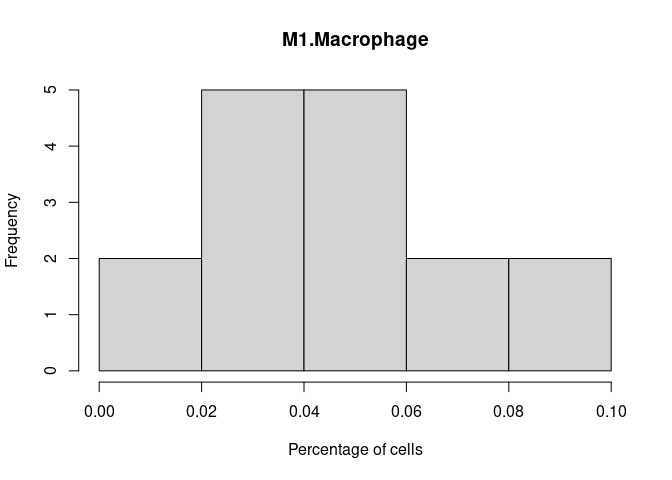
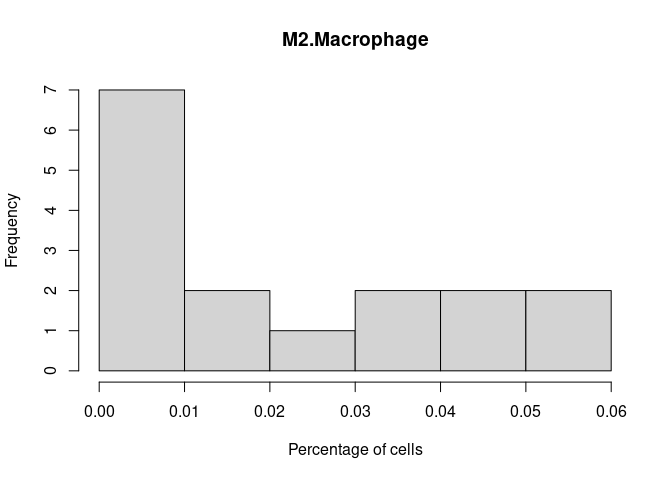
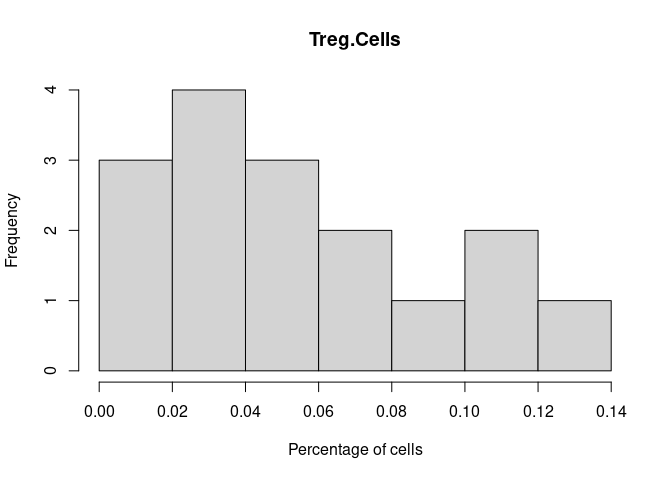
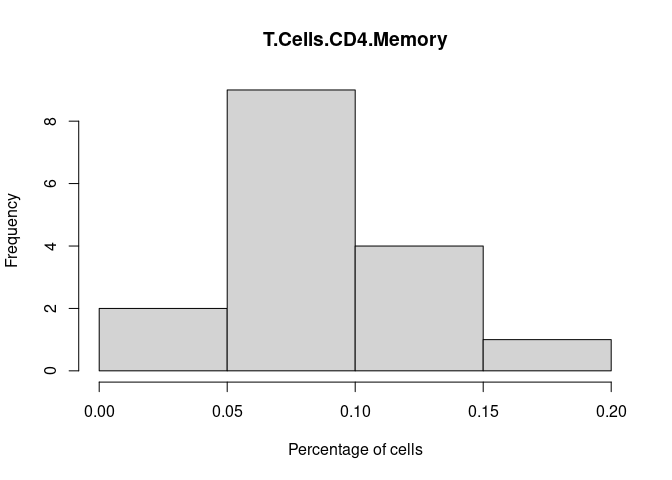
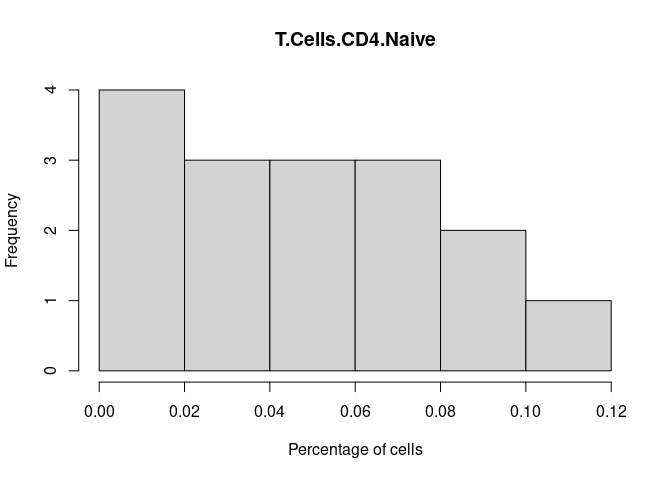
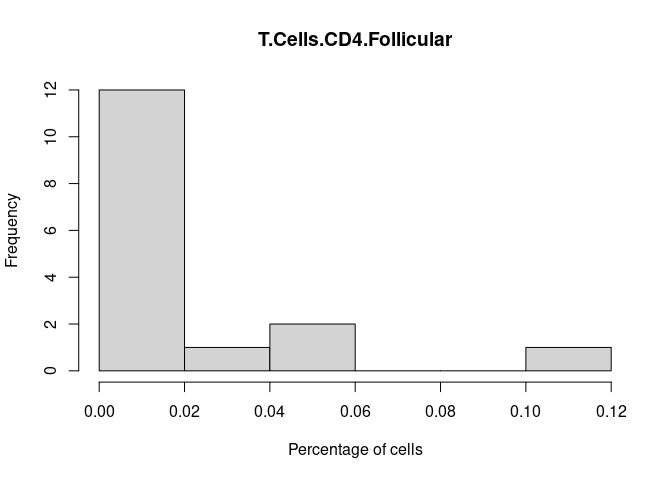
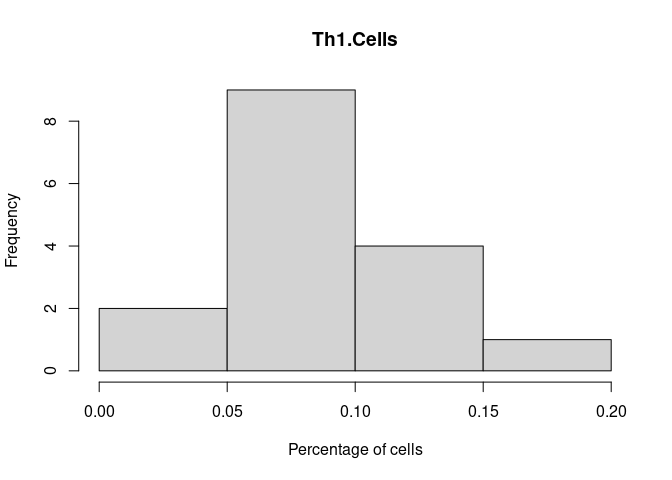
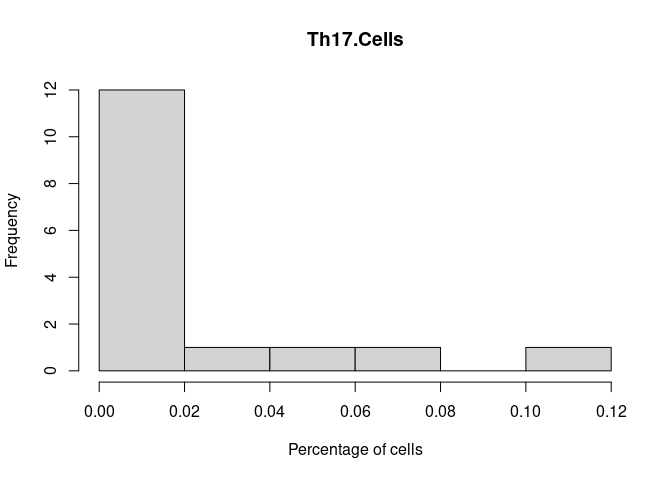
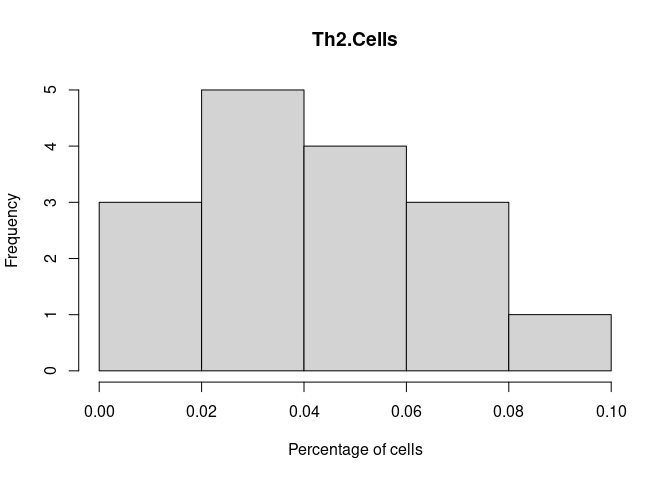
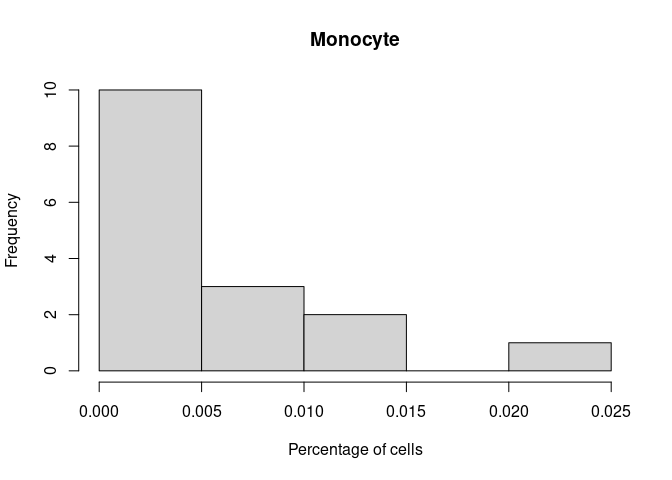
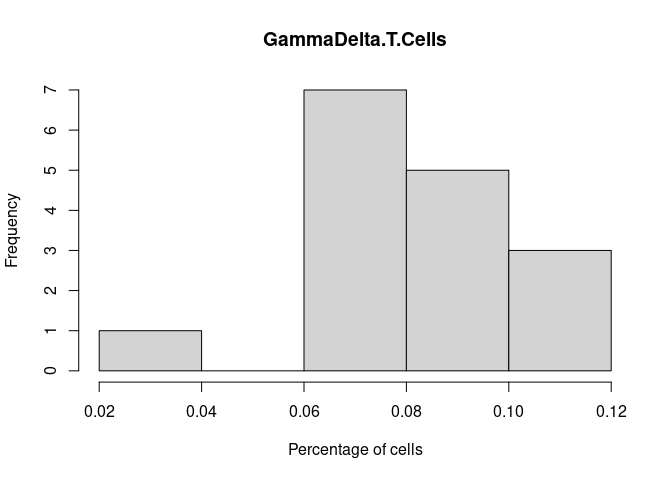
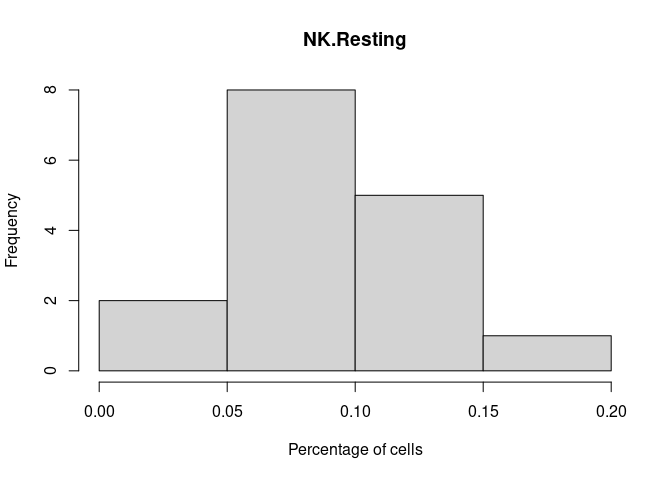
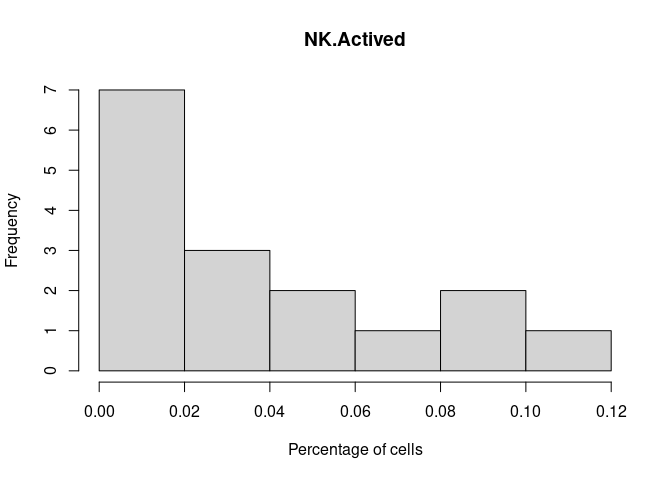
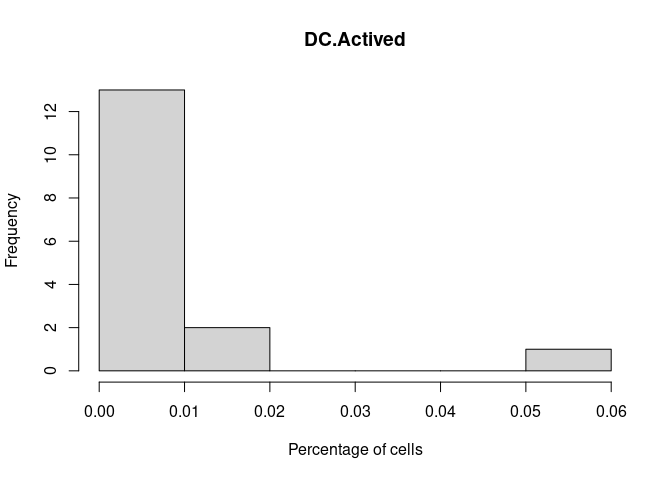
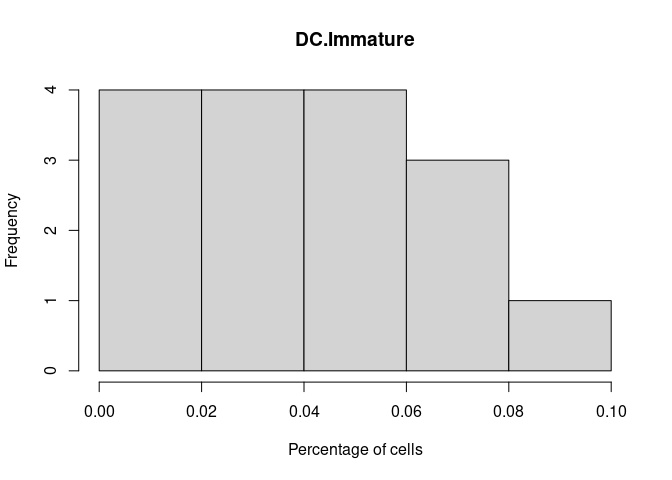
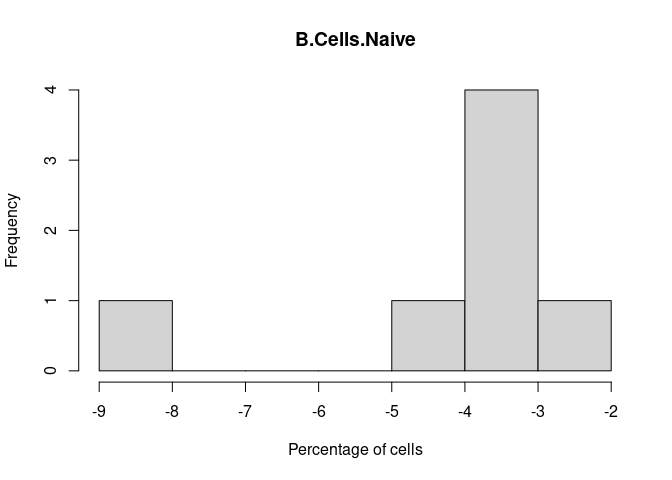
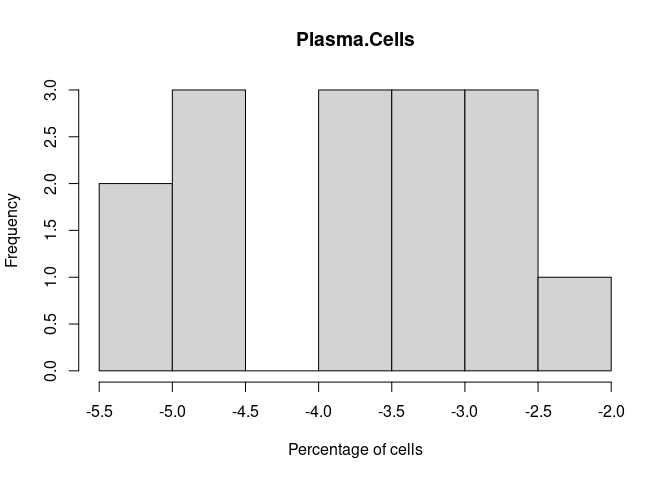
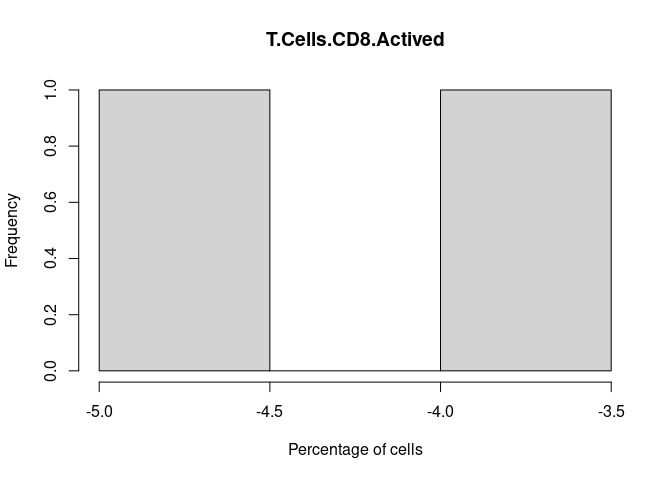
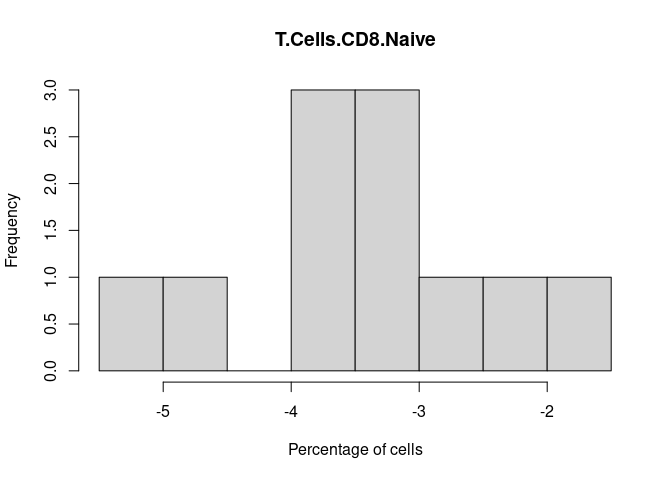
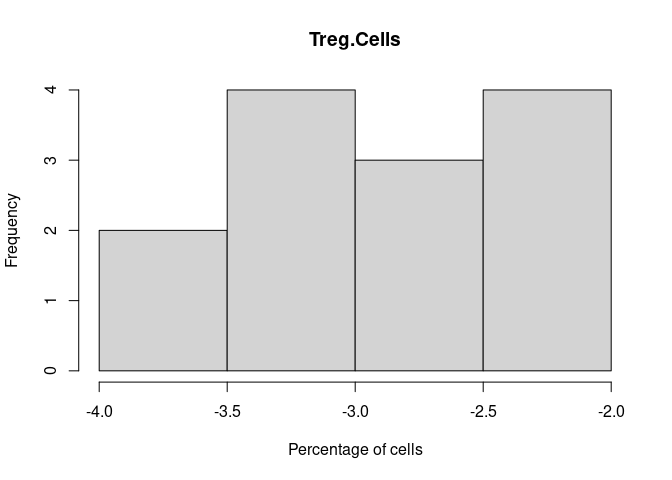
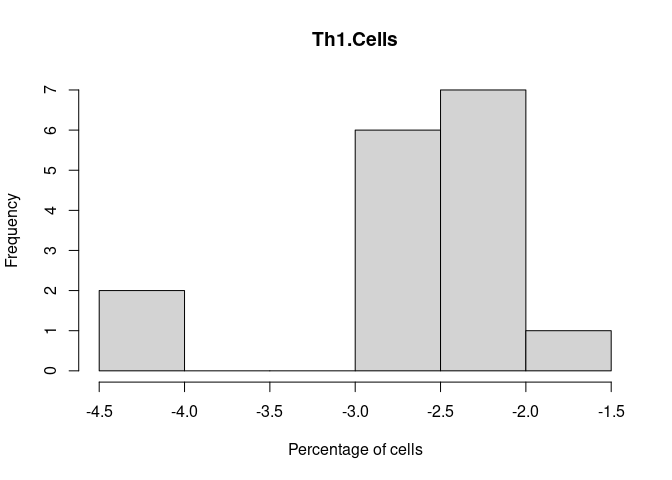
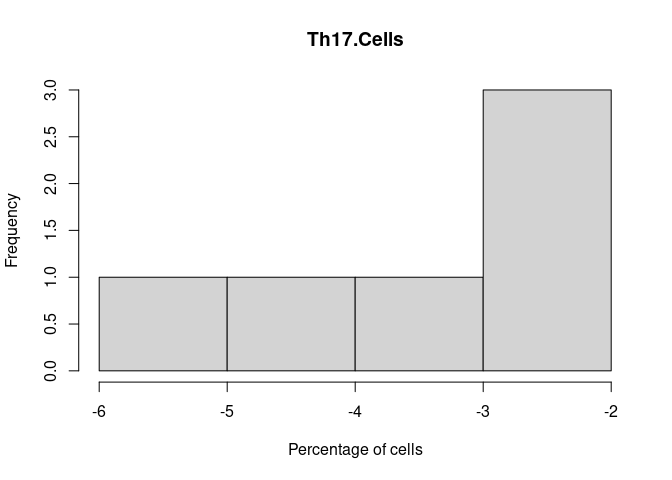
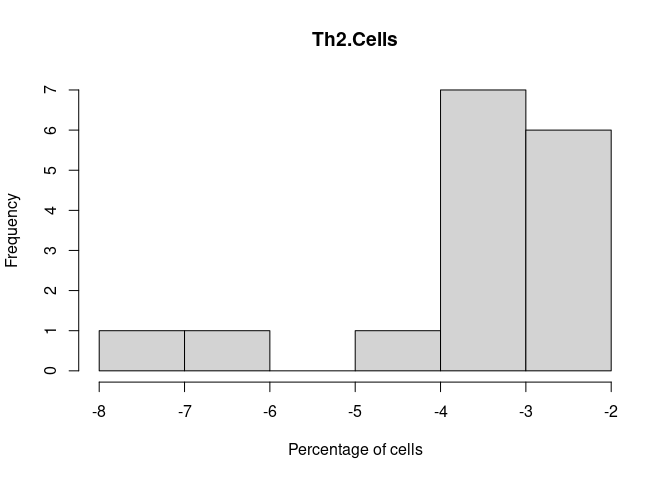
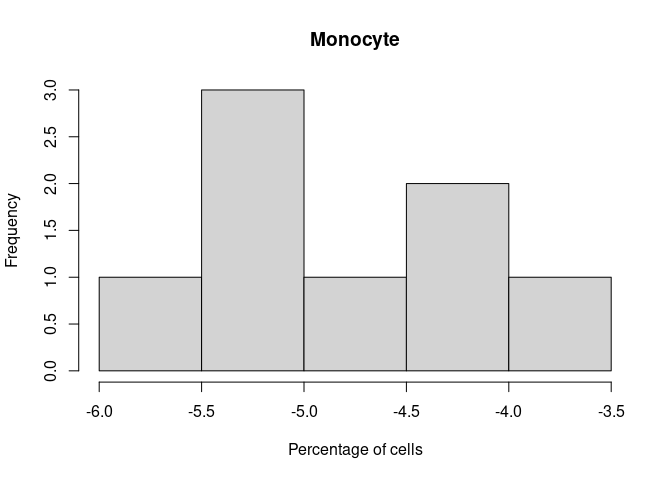
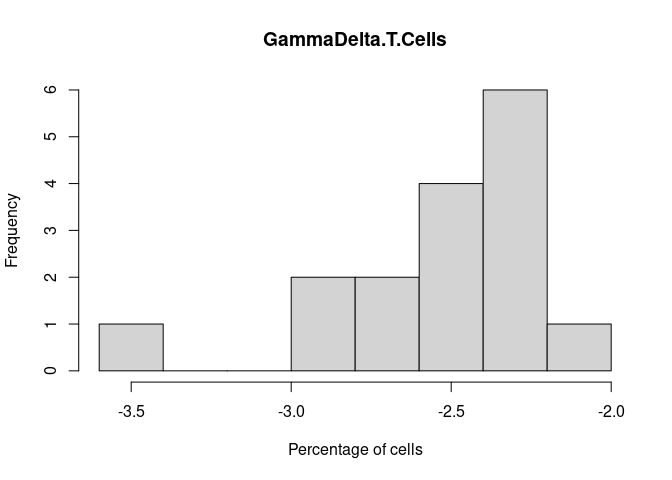
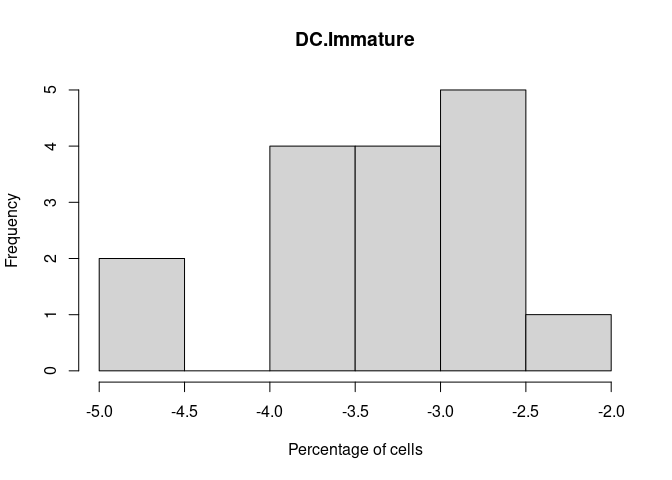
Raw Percentages
for(i in 1: length(cibersort[-1])){
  cat("\n####", names(cibersort[i+1]), "\n")
  hist(cibersort[,i+1],xlab = "Percentage of cells", main = names(cibersort[i+1]))
  cat("\n \n")
}
Mast.Cells
Neutrophil.Cells
Eosinophil.Cells
B.Cells.Memory
B.Cells.Naive
Plasma.Cells
T.Cells.CD8.Actived
T.Cells.CD8.Naive
T.Cells.CD8.Memory
M0.Macrophage
M1.Macrophage
M2.Macrophage
Treg.Cells
T.Cells.CD4.Memory
T.Cells.CD4.Naive
T.Cells.CD4.Follicular
Th1.Cells
Th17.Cells
Th2.Cells
Monocyte
GammaDelta.T.Cells
NK.Resting
NK.Actived
DC.Actived
DC.Immature
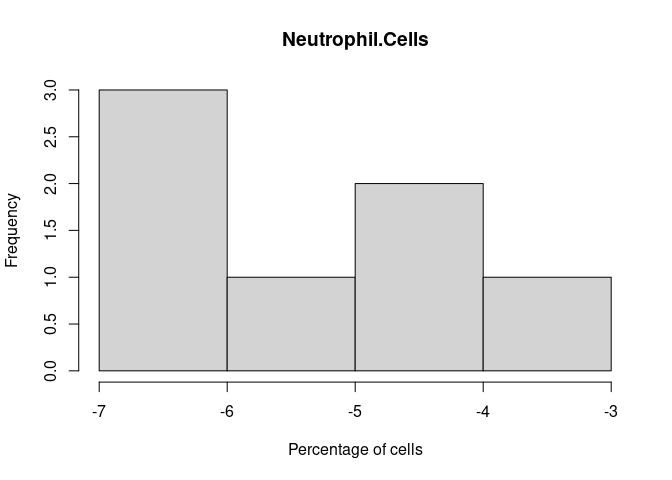
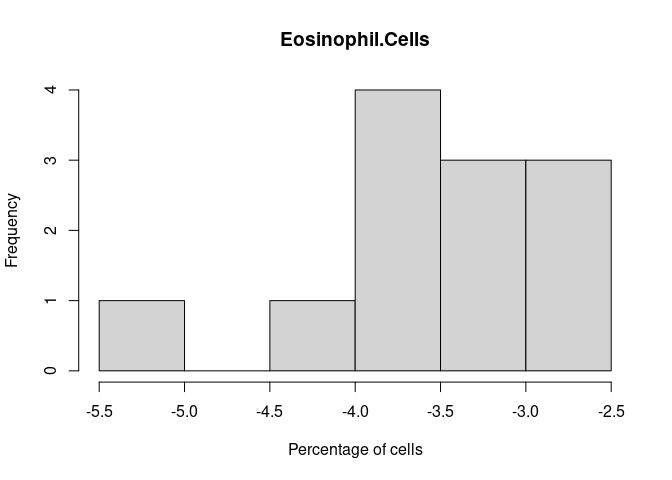
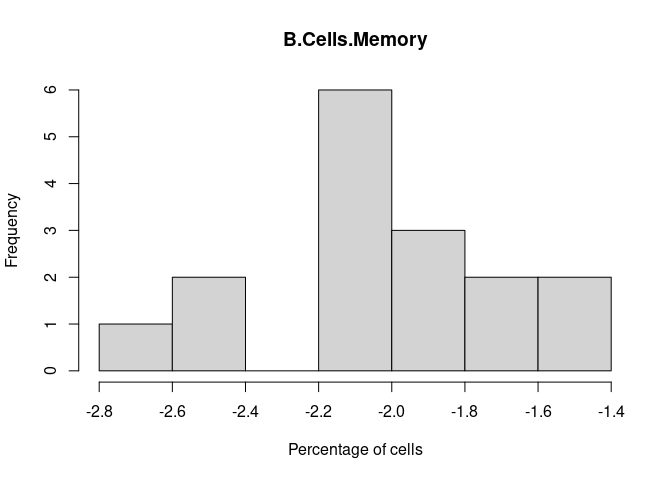
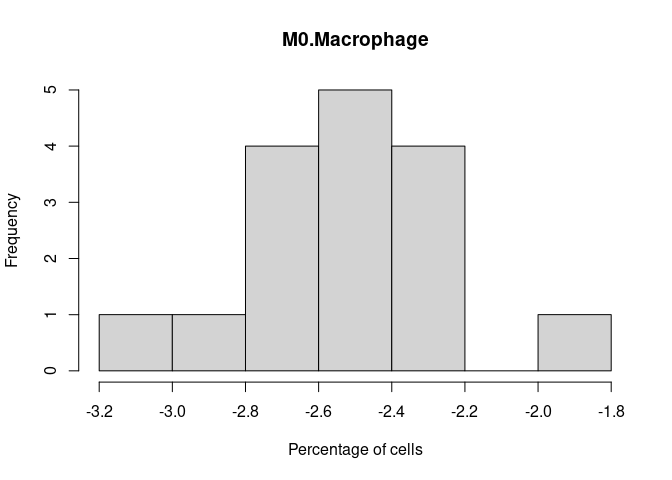
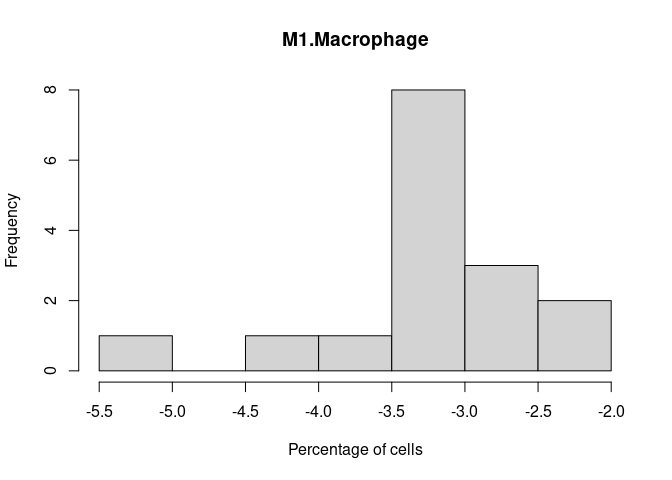
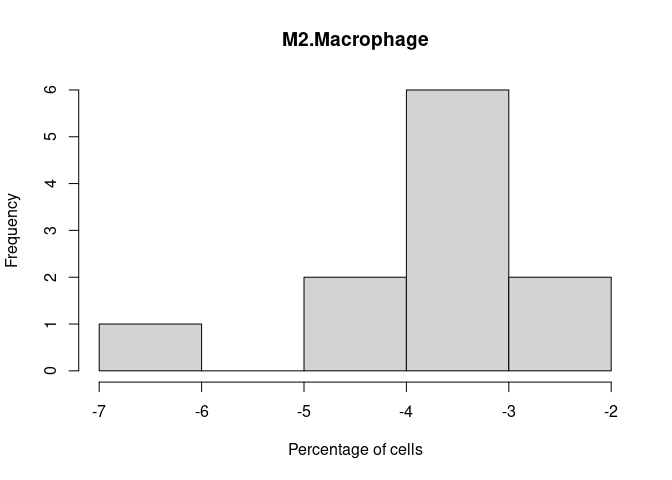
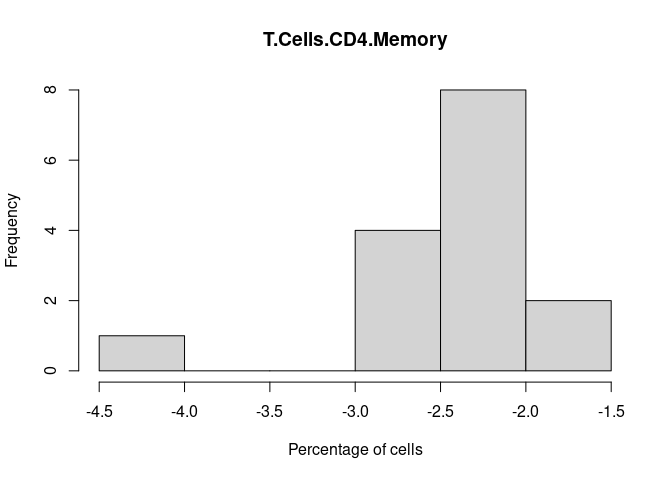
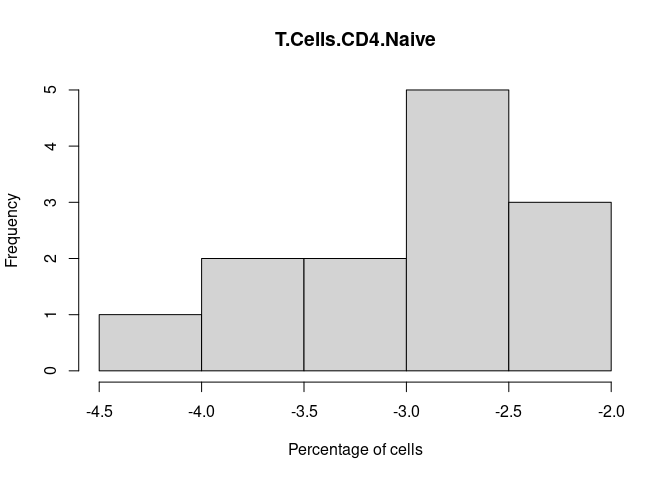
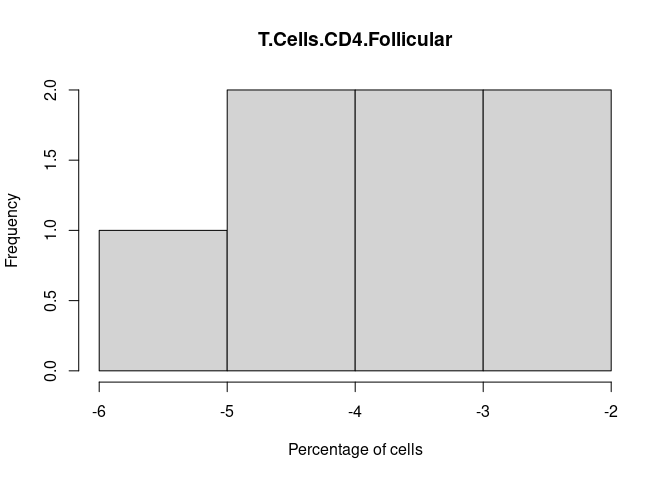
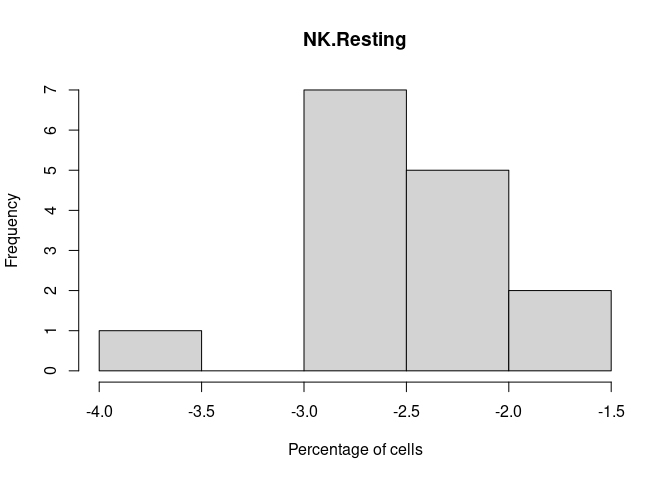
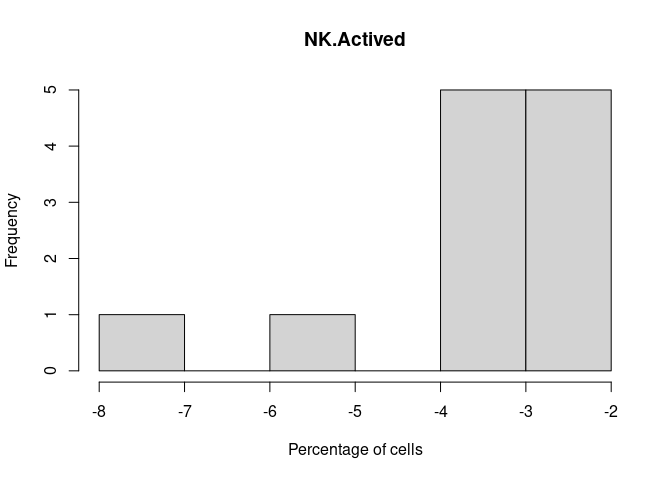
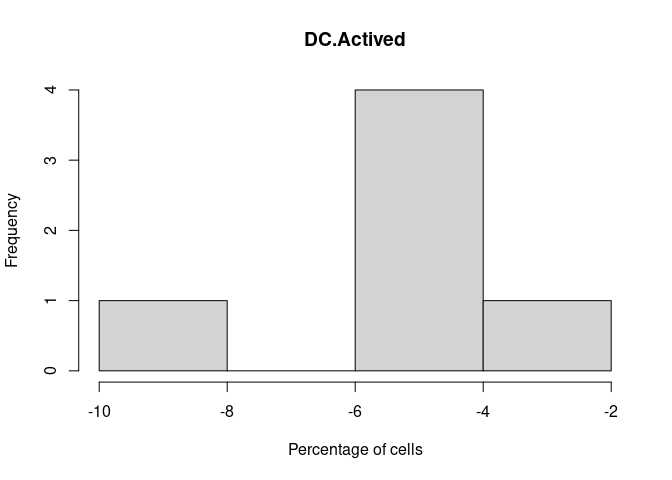
Logged Percentages
log.cibersort <- log(cibersort[,2:26])

for(i in 1: length(log.cibersort[-1])){
    cat("\n####", names(log.cibersort[i+1]), "\n")
  hist(log.cibersort[,i+1], xlab = "Percentage of cells",main = names(log.cibersort[i+1]))
  cat("\n \n")
}
Neutrophil.Cells
Eosinophil.Cells
B.Cells.Memory
B.Cells.Naive
Plasma.Cells
T.Cells.CD8.Actived
T.Cells.CD8.Naive
T.Cells.CD8.Memory
M0.Macrophage
M1.Macrophage
M2.Macrophage
Treg.Cells
T.Cells.CD4.Memory
T.Cells.CD4.Naive
T.Cells.CD4.Follicular
Th1.Cells
Th17.Cells
Th2.Cells
Monocyte
GammaDelta.T.Cells
NK.Resting
NK.Actived
DC.Actived
DC.Immature
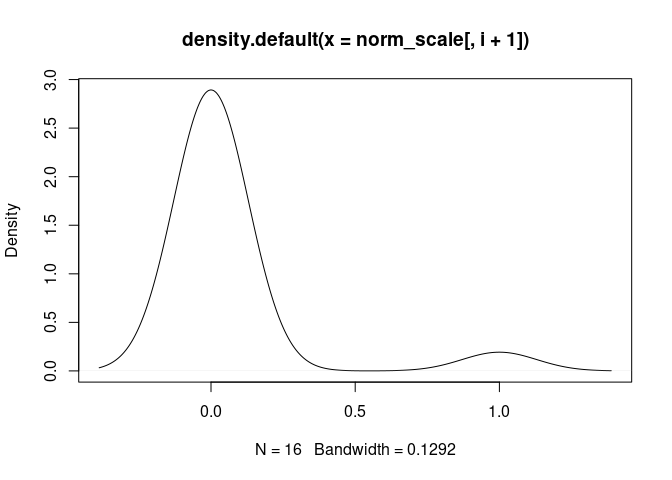
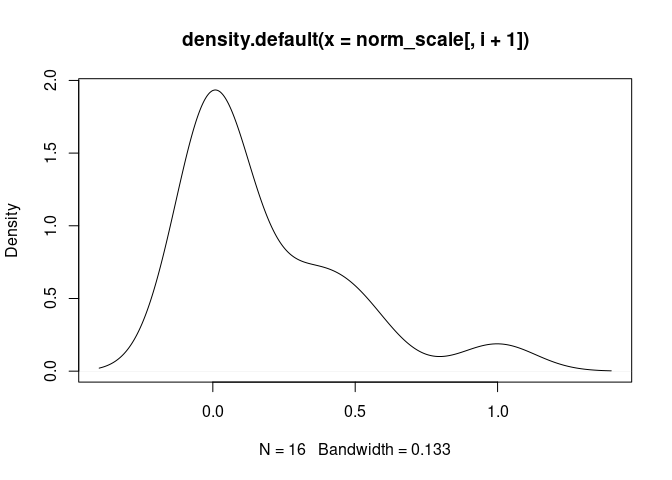
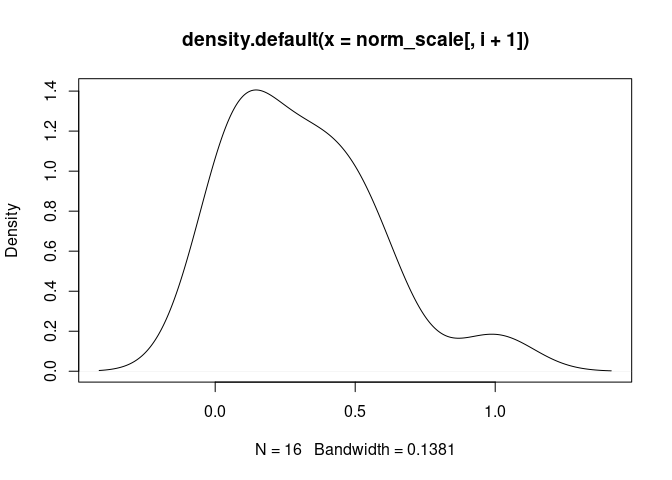
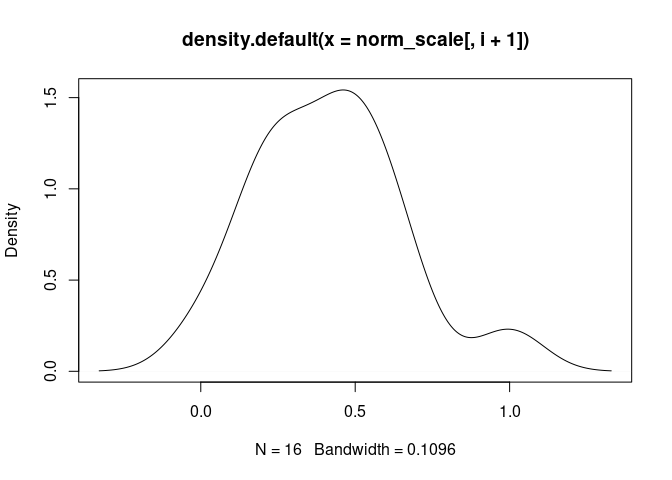
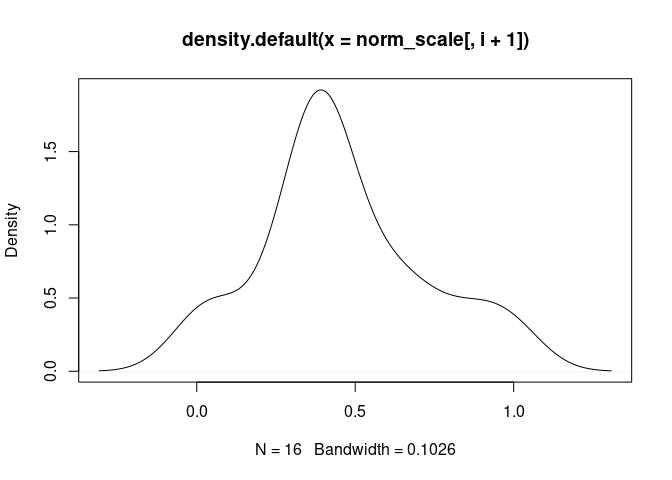
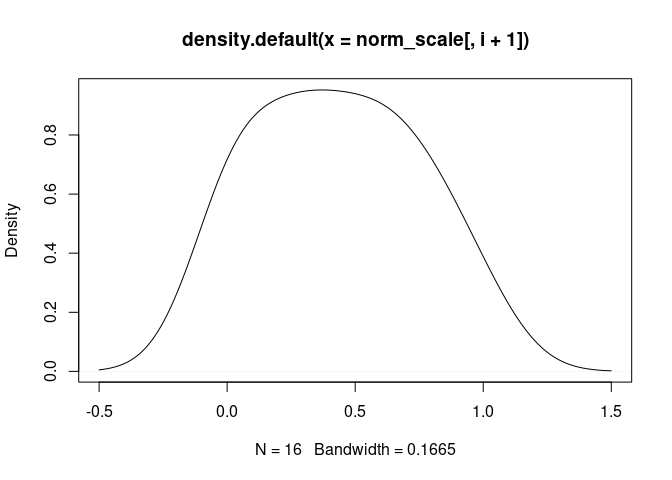
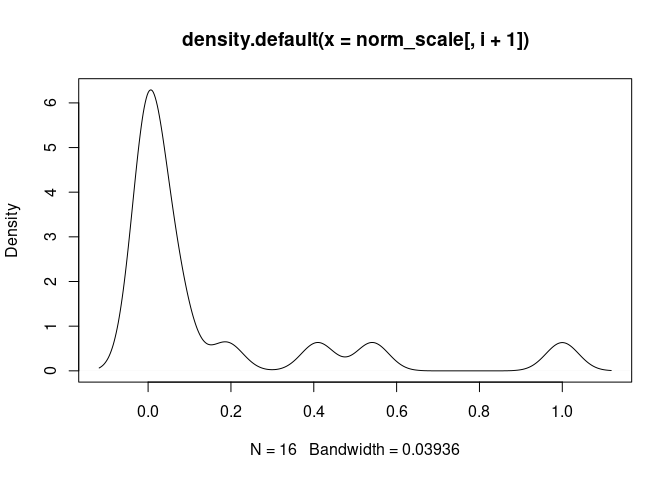
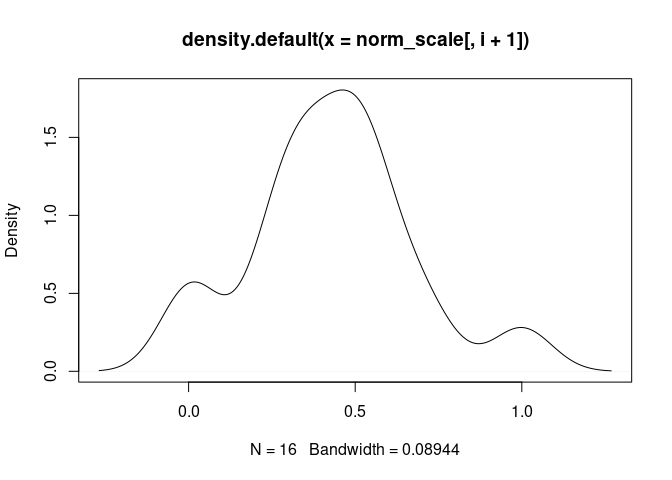
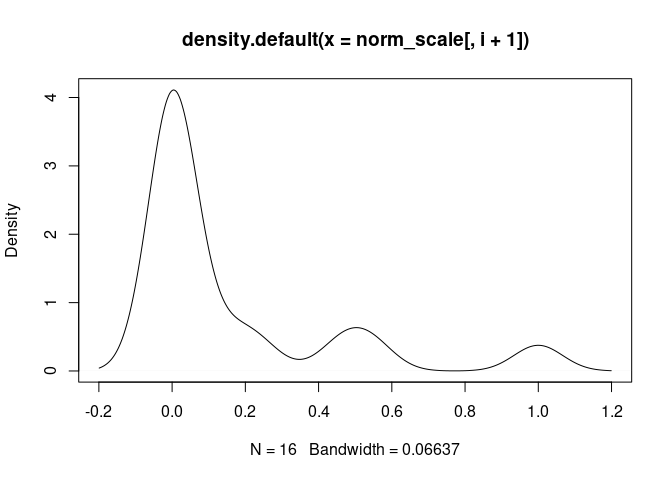
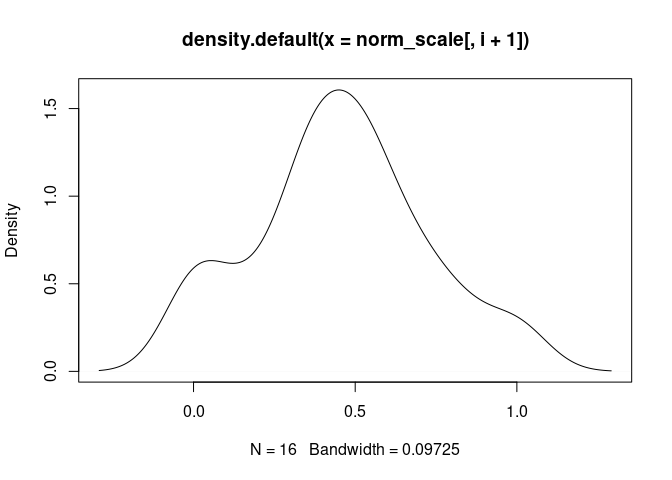
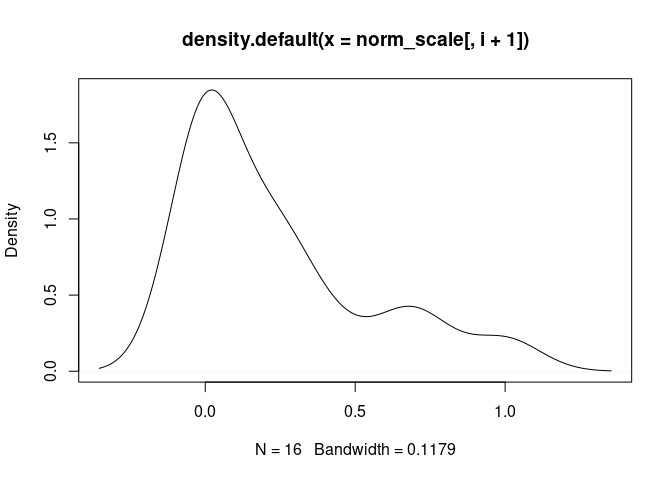
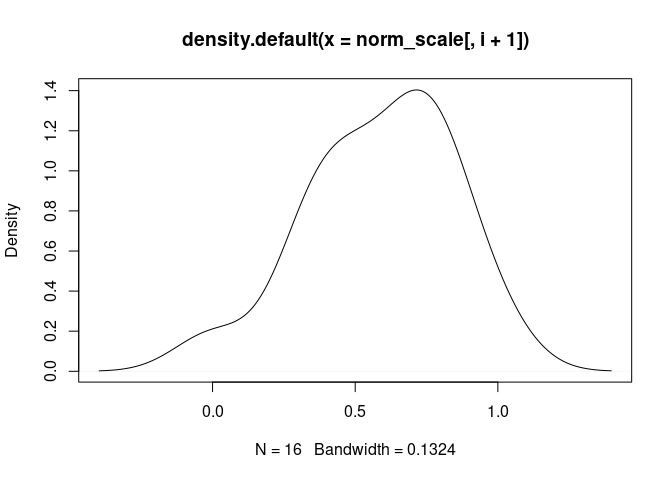
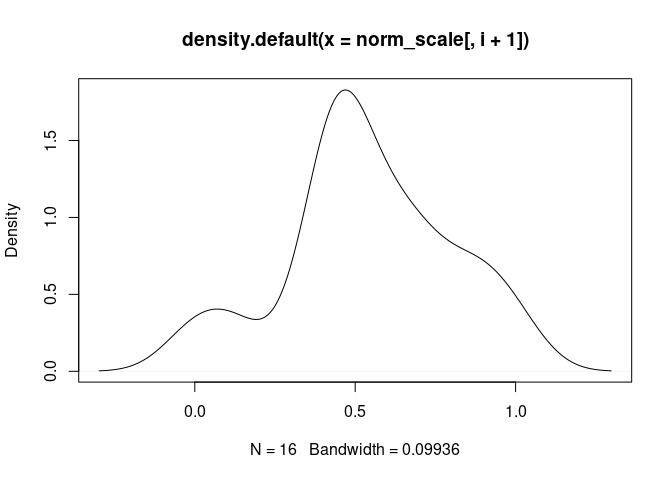
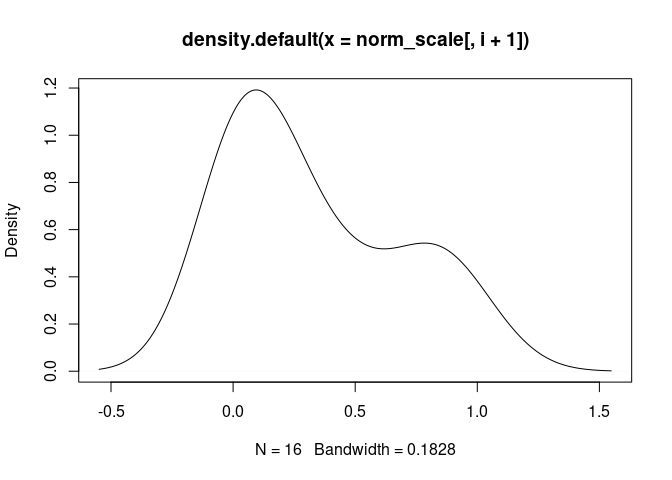
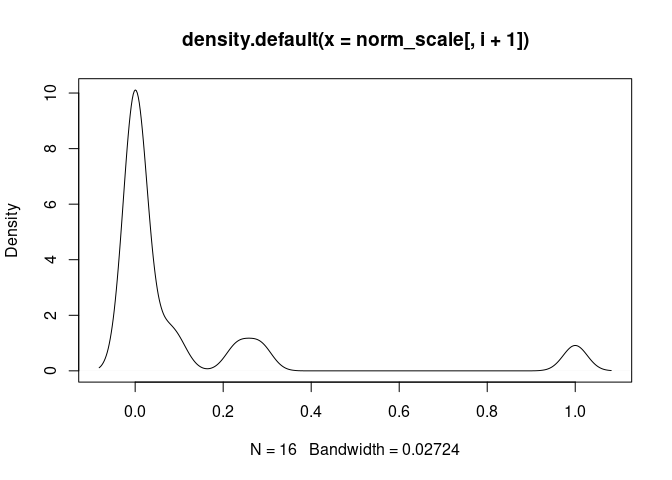
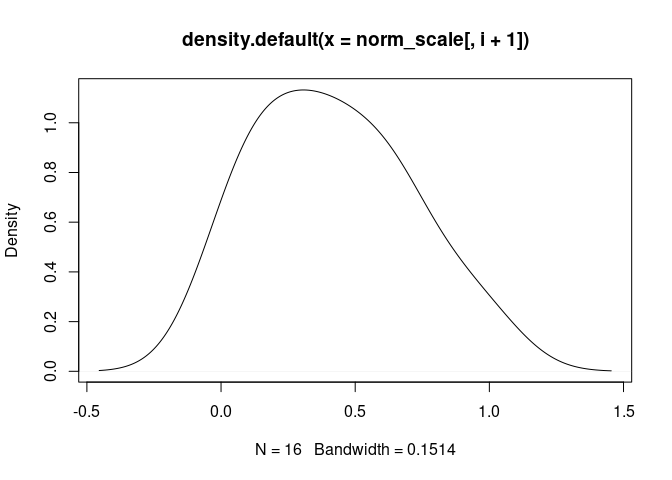
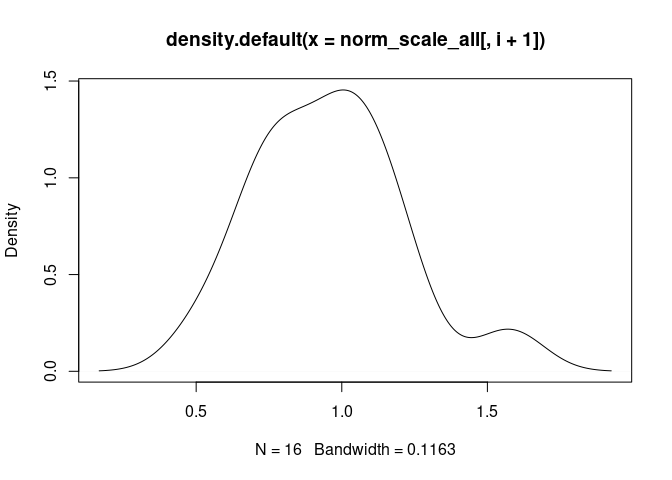
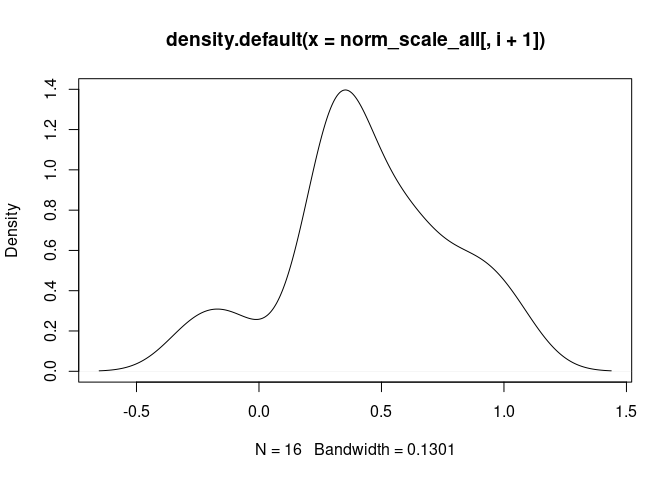
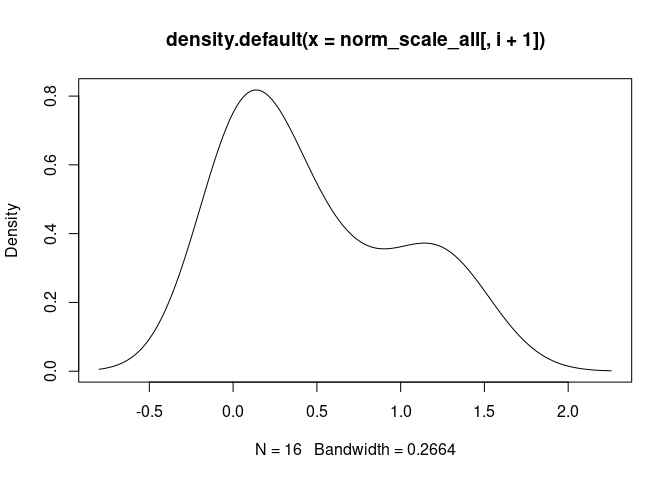
Density Plots
Green4 module
process <- preProcess(as.data.frame(cibersort), method=c("range"))

norm_scale <- predict(process, as.data.frame(cibersort))

for(i in 1: length(norm_scale[-1])){
  cat("\n####", names(norm_scale[i+1]), "\n")
  plot(density(norm_scale[,i+1]), main = names(norm_scale[,i+1]))
  cat("\n \n")
}
Mast.Cells
Neutrophil.Cells
Eosinophil.Cells

B.Cells.Memory
B.Cells.Naive
Plasma.Cells
T.Cells.CD8.Actived
T.Cells.CD8.Naive
T.Cells.CD8.Memory

M0.Macrophage
M1.Macrophage
M2.Macrophage
Treg.Cells

T.Cells.CD4.Memory
T.Cells.CD4.Naive
T.Cells.CD4.Follicular
Th1.Cells
Th17.Cells
Th2.Cells
Monocyte
GammaDelta.T.Cells
NK.Resting
NK.Actived
DC.Actived
DC.Immature
norm_scale_phenotypes <- left_join(norm_scale, tdata.FPKM.sample.info.pheno, by = c("Mixture" = "rowname"))
norm_scale_phenotypes <- norm_scale_phenotypes %>% column_to_rownames(var = "Mixture")
norm_scale_phenotypes$Time <- as.factor(norm_scale_phenotypes$Time)
norm_scale_phenotypes$Treatment <- as.factor(norm_scale_phenotypes$Treatment)
model <- list()
adjust <- list()
for(i in 1:length(norm_scale[-1])) {
name <- colnames(norm_scale_phenotypes[,i])
#m <- art(data = cibersort.all.phenotypes, cibersort.all.phenotypes[,i] ~ Time*Treatment)
m <- lm(data = norm_scale_phenotypes, norm_scale_phenotypes[,i] ~ Time*Treatment)
model[[i]] <- anova(m)
adjust[[i]] <- p.adjust(model[[i]]$`Pr(>F)`, method = "BH")
}
names(model) <- colnames(norm_scale[-1])
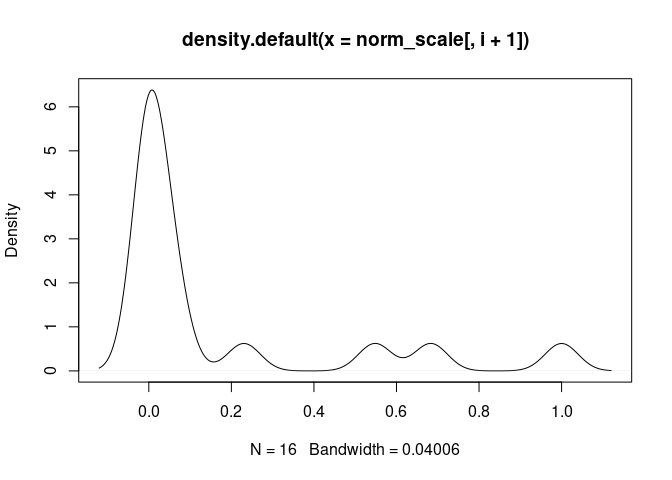
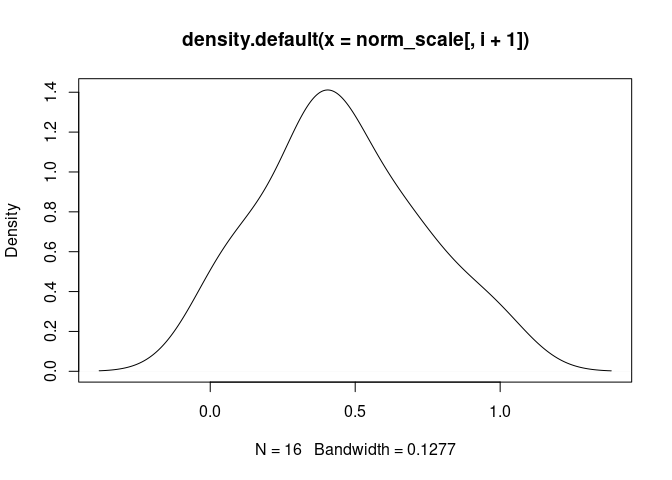
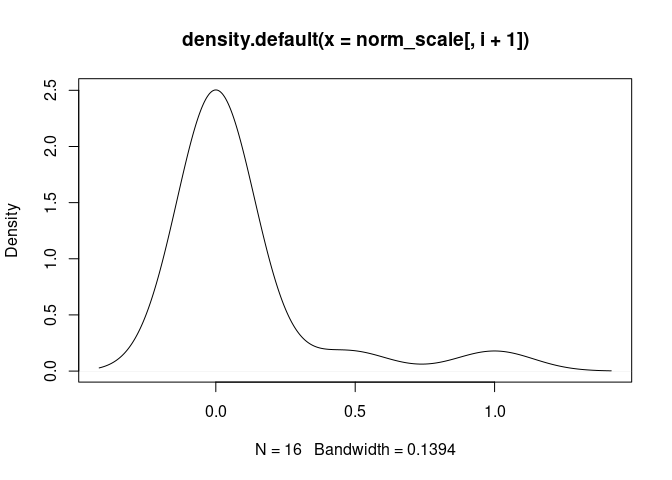
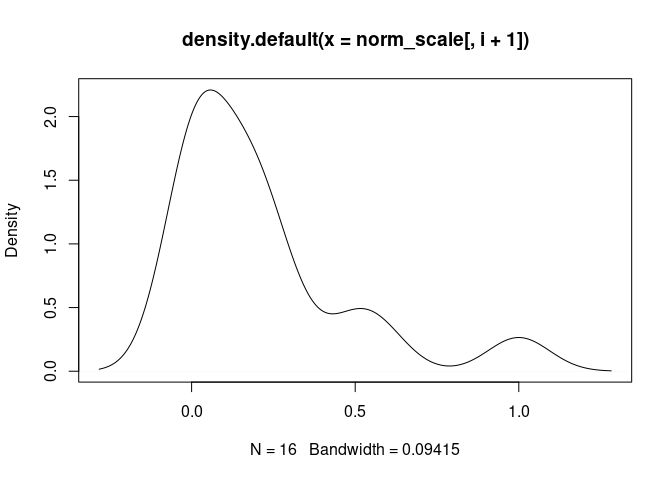
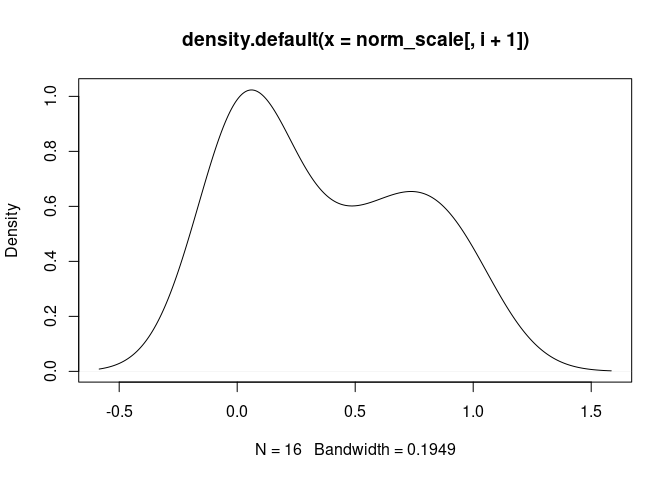
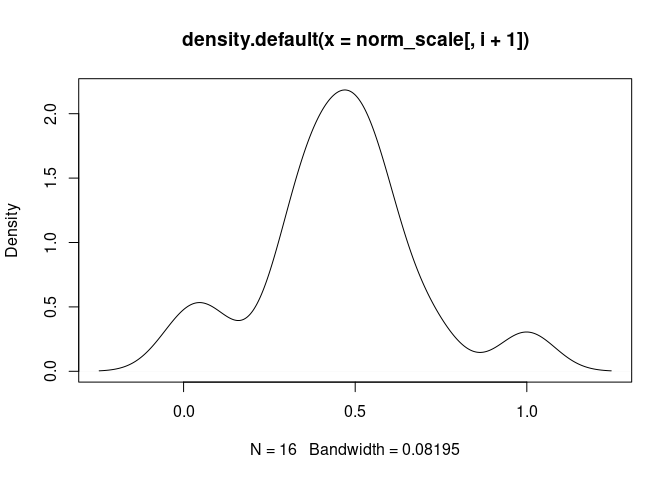
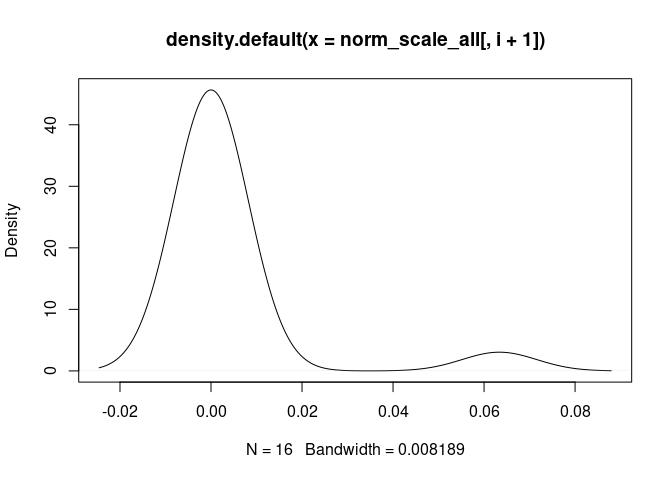
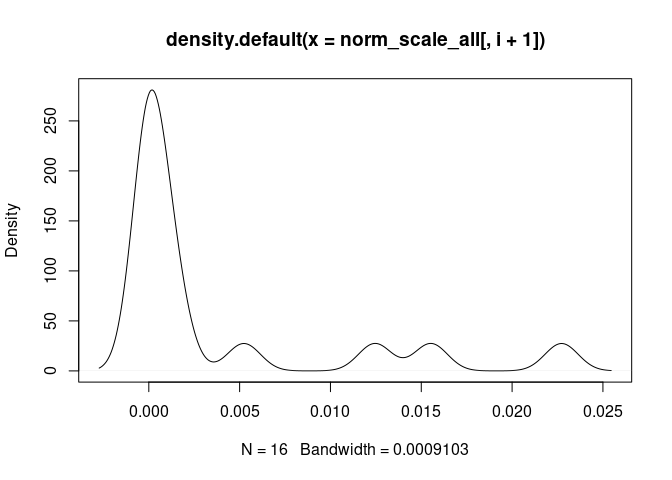
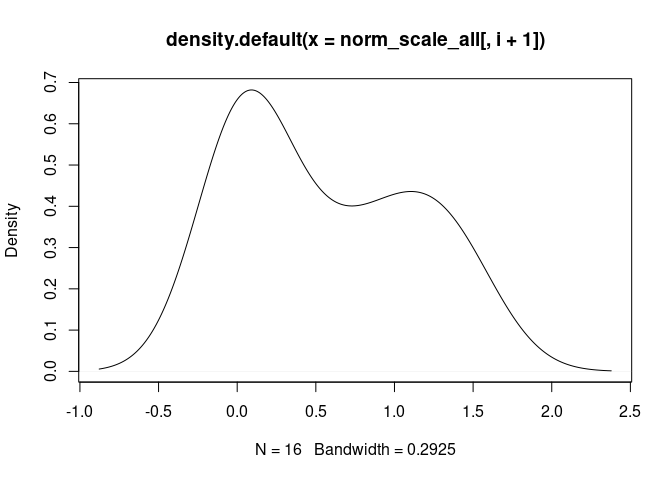
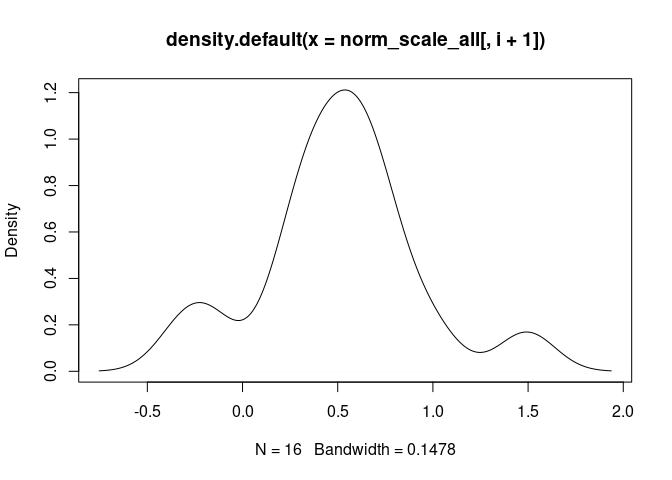
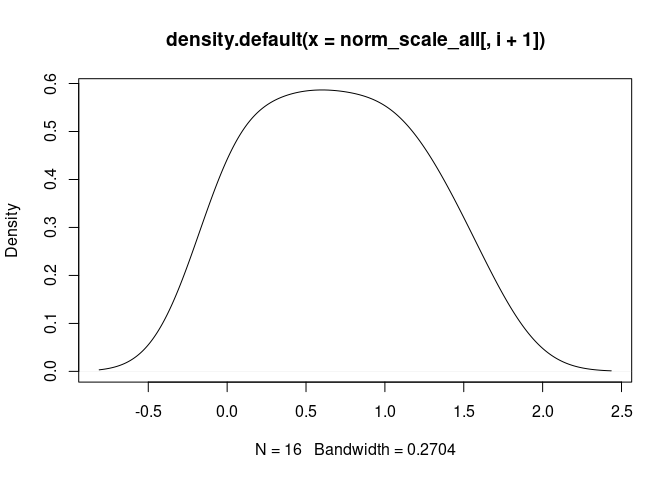
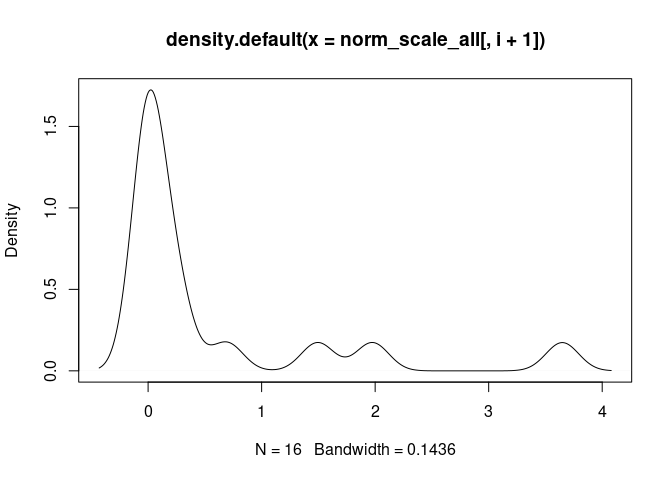
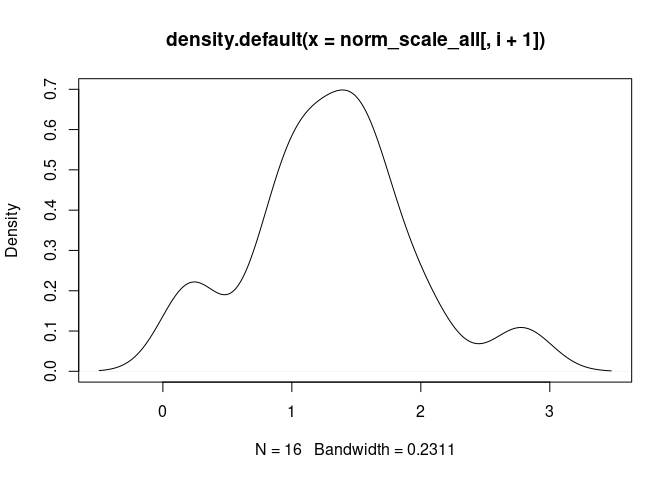
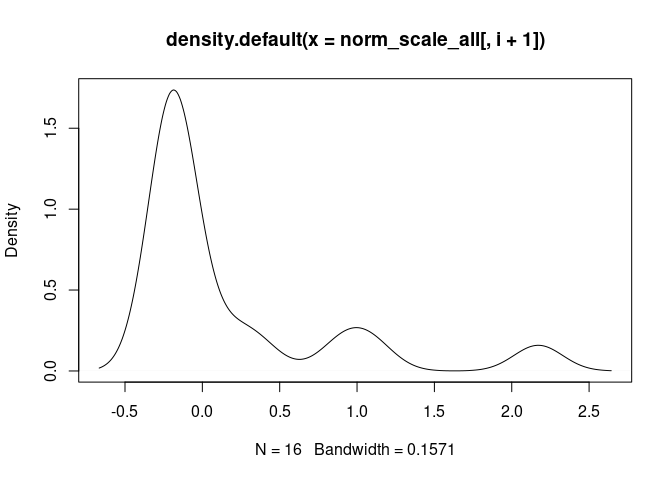
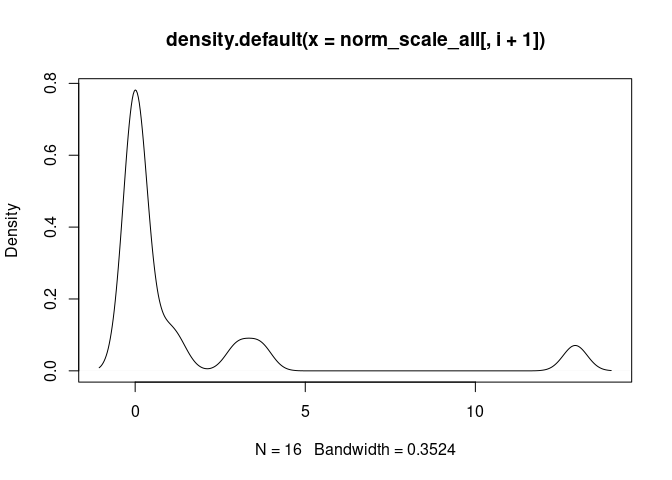
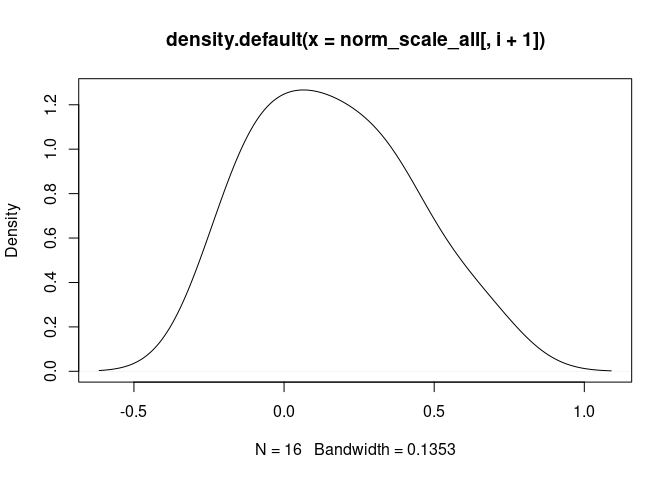
names(adjust) <- colnames(norm_scale[-1])All genes in Small Intestine
process <- preProcess(as.data.frame(cibersort.all), method=c("range"))
norm_scale_all <- predict(process, as.data.frame(cibersort))
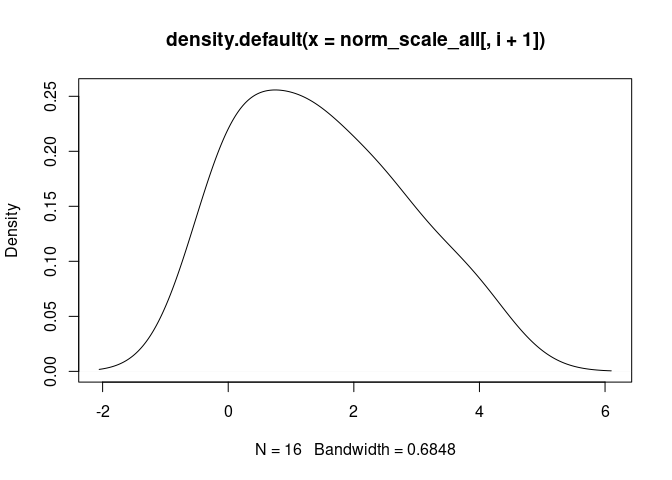
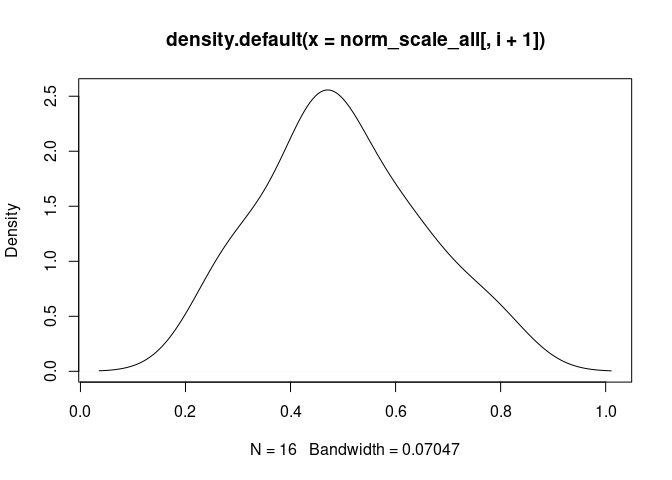
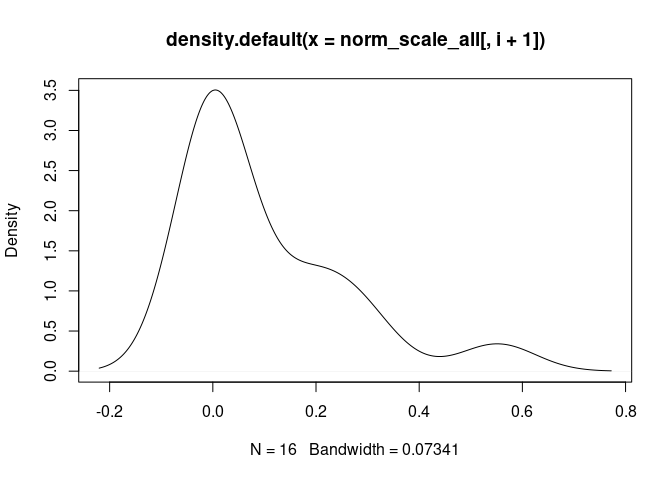
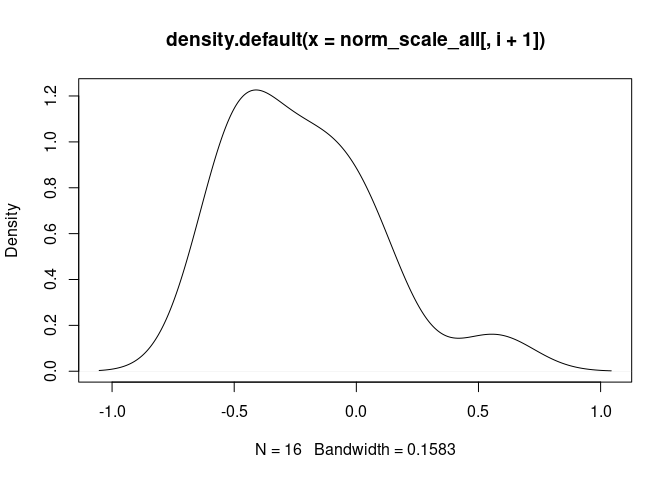
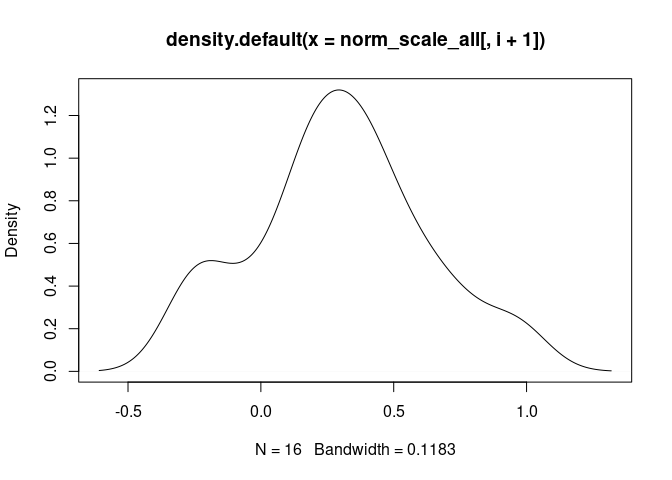
for(i in 1: length(norm_scale_all[-1])){
cat("\n####", names(norm_scale_all[i+1]), "\n")
d <- density(norm_scale_all[,i+1])
plot(d)
cat("\n \n")
}Mast.Cells
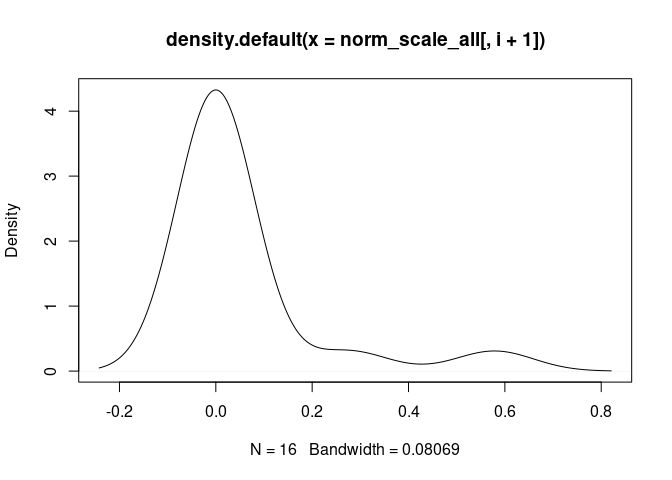
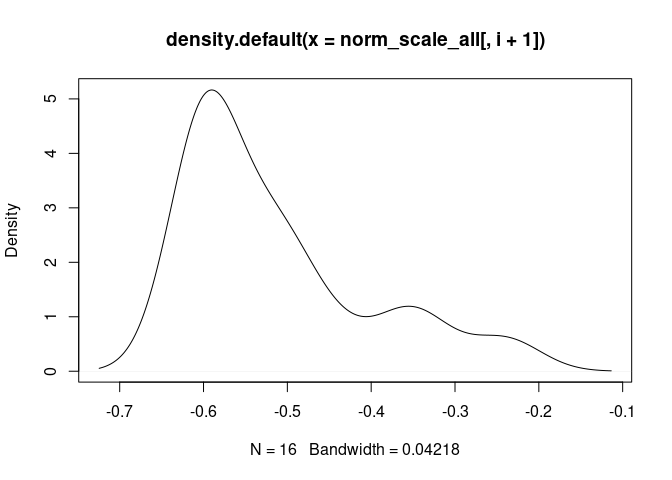
Neutrophil.Cells
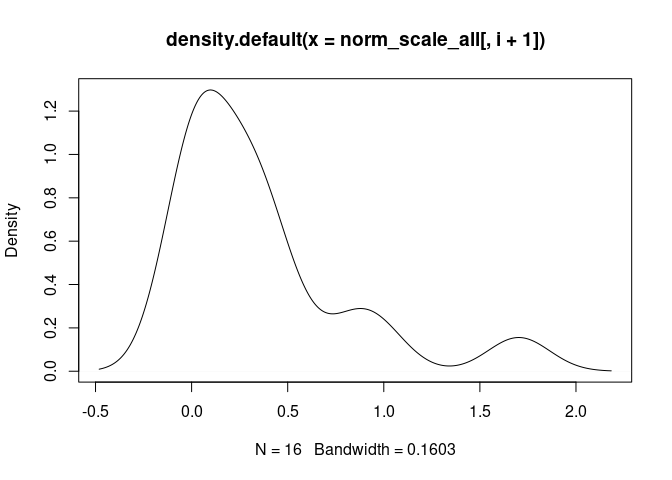
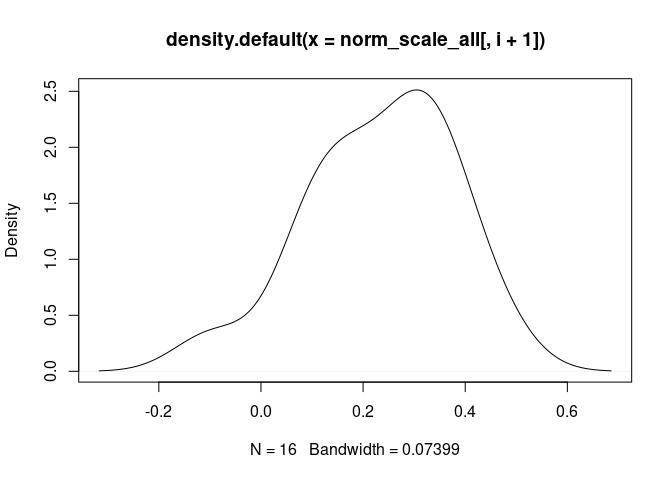
Eosinophil.Cells
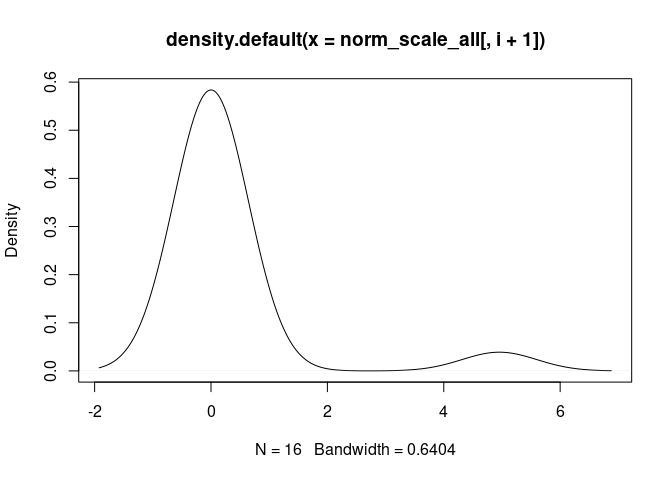
B.Cells.Memory
B.Cells.Naive
Plasma.Cells
T.Cells.CD8.Actived
T.Cells.CD8.Naive
T.Cells.CD8.Memory
M0.Macrophage
M1.Macrophage
M2.Macrophage
Treg.Cells
T.Cells.CD4.Memory
T.Cells.CD4.Naive
T.Cells.CD4.Follicular
Th1.Cells
Th17.Cells
Th2.Cells
Monocyte
GammaDelta.T.Cells
NK.Resting
NK.Actived
DC.Actived
DC.Immature
norm_scale_all_phenotypes <- left_join(norm_scale_all, tdata.FPKM.sample.info.pheno, by = c("Mixture" = "rowname"))
norm_scale_all_phenotypes <- norm_scale_all_phenotypes %>% column_to_rownames(var = "Mixture")

norm_scale_all_phenotypes$Time <- as.factor(norm_scale_all_phenotypes$Time)
norm_scale_all_phenotypes$Treatment <- as.factor(norm_scale_all_phenotypes$Treatment)

model <- list()
adjust <- list()

for(i in 1:length(norm_scale_all[-1])) {
   print(i)
    name <- colnames(norm_scale_all_phenotypes[,i])
    #m <- art(data = cibersort.all.phenotypes, cibersort.all.phenotypes[,i] ~ Time*Treatment)
    m <- lm(data = norm_scale_all_phenotypes, norm_scale_all_phenotypes[,i] ~ Time*Treatment)
             model[[i]] <- anova(m)
             adjust[[i]] <- p.adjust(model[[i]]$`Pr(>F)`, method = "BH")
}
## [1] 1
## [1] 2
## [1] 3
## [1] 4
## [1] 5
## [1] 6
## [1] 7
## [1] 8
## [1] 9
## [1] 10
## [1] 11
## [1] 12
## [1] 13
## [1] 14
## [1] 15
## [1] 16
## [1] 17
## [1] 18
## [1] 19
## [1] 20
## [1] 21
## [1] 22
## [1] 23
## [1] 24
## [1] 25names(model) <- colnames(norm_scale_all[-1])
names(adjust) <- colnames(norm_scale_all[-1])ANOVA Non-parametric
To perform analysis of variance Aligned Rank Transformation was performed, which is designed to handle non-parametric multi-factorial experiments. P-value was adjusted using Benjamini-hochberg procedure.
Green4 Module
cibersort.phenotypes$Time <- as.factor(cibersort.phenotypes$Time)
cibersort.phenotypes$Treatment <- as.factor(cibersort.phenotypes$Treatment)

model <- list()
adjust <- list()

for(i in 1:length(cibersort[-1])) {
    name <- colnames(cibersort.phenotypes[,i])
    m <- art(data = cibersort.phenotypes, cibersort.phenotypes[,i] ~ Time*Treatment)
             model[[i]] <- anova(m)
             adjust[[i]] <- p.adjust(model[[i]]$`Pr(>F)`, method = "BH")
}
names(model) <- colnames(cibersort[-1])
names(adjust) <- colnames(cibersort[-1])

cibersort.matrix <- matrix(nrow = 25, ncol = 4)
for(i in 1:length(adjust)){

  cibersort.matrix[i,] <- cbind(colnames(cibersort.phenotypes)[i],adjust[[i]][1],adjust[[i]][2],adjust[[i]][3])
}
colnames(cibersort.matrix) <- c("Immune Cells","Time","Treatment","Time by Treatment")
cibersort.matrix <- as.data.frame(cibersort.matrix)

DT::datatable(cibersort.matrix, extensions = 'Buttons', rownames = FALSE,
              filter="top", options = list(dom = 'Blfrtip', buttons = c('copy', 'csv', 'excel'), lengthMenu = list(c(10,25,50,-1), c(10,25,50,"All")),
                                           scrollX= TRUE), class = "display")
All Small Intestine Genes
cibersort.all.phenotypes$Time <- as.factor(cibersort.all.phenotypes$Time)
cibersort.all.phenotypes$Treatment <- as.factor(cibersort.all.phenotypes$Treatment)

model <- list()
adjust <- list()

for(i in 1:length(cibersort.all[-1])) {
    name <- colnames(cibersort.all.phenotypes[,i])
    #m <- art(data = cibersort.all.phenotypes, cibersort.all.phenotypes[,i] ~ Time*Treatment)
    m <- lm(data = cibersort.all.phenotypes, cibersort.all.phenotypes[,i] ~ Time*Treatment)
             model[[i]] <- anova(m)
             adjust[[i]] <- p.adjust(model[[i]]$`Pr(>F)`, method = "BH")
}
names(model) <- colnames(cibersort.all[-1])
names(adjust) <- colnames(cibersort.all[-1])

cibersort.all.matrix <- matrix(nrow = 25, ncol = 4)
for(i in 1:length(adjust)){

  cibersort.all.matrix[i,] <- cbind(colnames(cibersort.all.phenotypes)[i],adjust[[i]][1],adjust[[i]][2],adjust[[i]][3])
}
colnames(cibersort.all.matrix) <- c("Immune Cells","Time","Treatment","Time by Treatment")
cibersort.all.matrix <- as.data.frame(cibersort.all.matrix)

DT::datatable(cibersort.all.matrix, extensions = 'Buttons', rownames = FALSE,
              filter="top", options = list(dom = 'Blfrtip', buttons = c('copy', 'csv', 'excel'), lengthMenu = list(c(10,25,50,-1), c(10,25,50,"All")),
                                           scrollX= TRUE), class = "display")
Compare module to all genes in small intestine
cibersort.compare$Time <- as.factor(cibersort.compare$Time)
cibersort.compare$Treatment <- as.factor(cibersort.compare$Treatment)

model <- list()
adjust <- list()

for(i in 1:length(cibersort.all[-1])) {
    name <- colnames(cibersort.compare[,i])
    #m <- art(data = cibersort.compare, cibersort.compare[,i] ~ Time*Treatment)
    m <- lm(data = cibersort.compare, cibersort.compare[,i] ~ Module*Time*Treatment)
             model[[i]] <- anova(m)
             adjust[[i]] <- p.adjust(model[[i]]$`Pr(>F)`, method = "BH")
}
names(model) <- colnames(cibersort.all[-1])
names(adjust) <- colnames(cibersort.all[-1])

cibersort.all.matrix <- matrix(nrow = 25, ncol = 8)
for(i in 1:length(adjust)){

  cibersort.all.matrix[i,] <- cbind(colnames(cibersort.compare)[i],adjust[[i]][1],adjust[[i]][2],adjust[[i]][3],adjust[[i]][4],adjust[[i]][5],adjust[[i]][6],adjust[[i]][7])
}
colnames(cibersort.all.matrix) <- c("Immune Cells","Module","Time","Treatment","Module:Time","Module:Treatment","Time:Treatment","Module:Time:Treatment")
cibersort.all.matrix <- as.data.frame(cibersort.all.matrix)

DT::datatable(cibersort.all.matrix, extensions = 'Buttons', rownames = FALSE,
              filter="top", options = list(dom = 'Blfrtip', buttons = c('copy', 'csv', 'excel'), lengthMenu = list(c(10,25,50,-1), c(10,25,50,"All")),
                                           scrollX= TRUE), class = "display")
Plot to compare Green4 module to all genes in small intestine
meltcibersort.all <- melt(cibersort.compare)
p <- ggplot(meltcibersort.all, aes(variable,value, fill = c(Treatment),alpha = Module))
p <- p + geom_bar(stat = "summary", position = "dodge") + basic_theme + theme(axis.text.x = element_text(angle = 90)) + xlab("Immune Cells") + ylab("Percentage") + labs(fill = c("Treatment")) + scale_alpha_discrete(range = c(.4,1))
p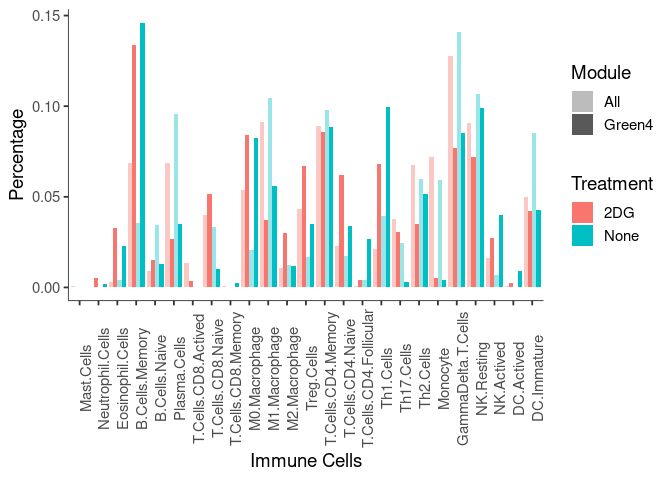
tdata.FPKM.sample.info <- readRDS(here("Data","20190406_RNAseq_B6_4wk_2DG_counts_phenotypes.RData"))

tdata.FPKM <- readRDS(here("Data","20190406_RNAseq_B6_4wk_2DG_counts_numeric.RData"))

log.tdata.FPKM <- log(tdata.FPKM + 1)
log.tdata.FPKM <- as.data.frame(log.tdata.FPKM)

log.tdata.FPKM.sample.info <- cbind(log.tdata.FPKM, tdata.FPKM.sample.info[,27238:27240])

log.tdata.FPKM.sample.info <- log.tdata.FPKM.sample.info %>% rownames_to_column() %>% filter(rowname != "A113") %>% column_to_rownames()

log.tdata.FPKM.subset <- log.tdata.FPKM[,colMeans(log.tdata.FPKM != 0) > 0.5]

log.tdata.FPKM.subset <- log.tdata.FPKM.subset %>% rownames_to_column() %>% filter(rowname != "A113") %>% column_to_rownames()

log.tdata.FPKM.sample.info.subset.small.intestine <- log.tdata.FPKM.sample.info %>% rownames_to_column() %>% filter(Tissue == "Small Intestine") %>% column_to_rownames()

log.tdata.FPKM.sample.info.subset.small.intestine <- log.tdata.FPKM.sample.info.subset.small.intestine[,colMeans(log.tdata.FPKM.sample.info.subset.small.intestine != 0) > 0.5]
cibersort.all.genes <- log.tdata.FPKM.sample.info.subset.small.intestine[,-c(17912:17914)] %>% t()
cibersort.all.genes <- as.data.frame(cibersort.all.genes) %>% rownames_to_column()
ensembl.location <- readRDS(here("Data","Ensembl_gene_id_and_location.RData"))
cibersort.all.genes <- left_join(cibersort.all.genes,ensembl.location, by = c("rowname" = "ensembl_gene_id"))
cibersort.all.genes <- as.data.frame(cbind(cibersort.all.genes$external_gene_name, cibersort.all.genes[,-c(1,18:22)]))
cibersort.all.genes <- cibersort.all.genes[!duplicated(cibersort.all.genes$`cibersort.all.genes$external_gene_name`),]
rownames(cibersort.all.genes) <- cibersort.all.genes$`cibersort.all.genes$external_gene_name`
cibersort.all.genes <- cibersort.all.genes[,-1]
write.table(cibersort.all.genes, here("Data","Small Intestine","B6_2DG_Small_Intestine_all_gene_expression_for_cibersort.txt"), col.names = T, row.names = T)Analysis performed by Ann Wells
The Carter Lab The Jackson Laboratory 2023
ann.wells@jax.org