Summary Spleen
Ann Wells
April 23, 2023
Summary
needed.packages <- c("tidyverse", "here", "functional", "gplots", "dplyr", "GeneOverlap", "R.utils", "reshape2","magrittr","data.table", "RColorBrewer","preprocessCore", "ARTool","emmeans", "phia", "gProfileR","rlist", "pheatmap", "WGCNA")
for(i in 1:length(needed.packages)){library(needed.packages[i], character.only = TRUE)}

source(here("source_files","WGCNA_source.R"))
There were 16 samples (4 per time and treatment). Mice were fed 2DG (6g/L) or nothing in their water for 96hrs or 2 weeks. WGCNA analysis was performed to determine gene clustering. A soft-thresholding power was chosen so that the scale-free topology correlation attempts to hit 0.9. The power chosen for spleen was 20, which allowed the correlations to hover around 0.88. This power clustered the genes into 161 modules originally, however, modules that were highly correlated (0.75 or higher) were further merged together to create 31 modules.
modules<-read.csv(here("Data","Spleen","log.tdata.FPKM.sample.info.subset.spleen.WGCNA.module.membership.csv"), header=T)

module_barplot(modules)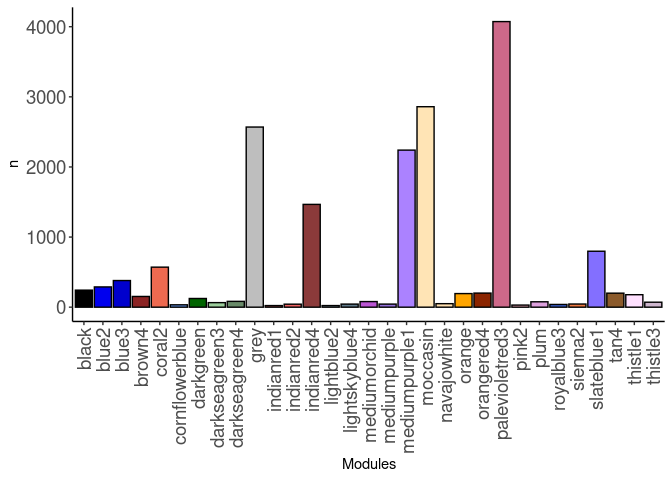
Pathways
Pathways were assessed for each module. Out of 31 modules, only 28 modules had pathway hits of any kind. The pathways that had the highest frequency across modules were metabolism and metabolism of RNA. The blue2, blue3, cornflowerblue, mediumpurple1, orangered4, slateblue1, and tan4 modules all contained these pathways.
Black
9 pathways were identified in the Black module. The pathways were related to digestion, carbohydrates, pancreatic and salivary secretion, and synaptic vesicle cycle.
Blue2
284 pathways were identified in the Blue2 module. The pathways were related to APC, DNA, cell cycle, p53, interleukins, metabolism, mitochondrial metabolism, mRNA, oxidative phosphorylation, RNA polymerase II, TGF-beta, thermogenesis, signaling, transcriptional regulation.
Blue3
39 pathways were identified in the Blue3 module. The pathways were related to chromatin, mRNA, RNA polymerase I, and WNT signaling.
Coral2
21 pathways were identified in the Coral2 module. The pathways were related to antigen processing and presentation, autoimmune disease, metabolic pathways, and viral.
Cornflowerblue
22 pathways were identified in the Cornflowerblue module. The pathways were related to metabolism, ribosomes, translation, rRNA, and nonsense mediated decay.
Darkgreen
7 pathways were identified in the Darkgreen module. The pathways were related to fat digestion and absorption, microbial functions, and transcriptional misregulation in cancer.
Darkseagreen4
1 pathway, striated muscle contraction, was identified in the Darkseagreen4 module.
Grey
14 pathways were identified in the Grey module. The pathways were related to calcium signaling, muscle contraction, cardiac function, and neuronal activity.
Indiandred1
2 pathways were identified in the Indianred1 module. The pathways were FMO oxidizes nucleophiles and regulation of insulin-like growth factor transport and uptake by insulin-like growth factor binding proteins.
Indianred4
64 pathways were identified in the Indianred4 module. The pathways were related to chromatin, B cell receptor signaling, autoimmune disease, immunity, insulin resistance, interleukins, natural killer cells, NF-kappa B signaling, Notch signaling, T cell receptor signaling, Th1 and 2 differentiation, and Th17 differentiation.
Lightblue2
10 pathways were identified in the Lightblue2 module. The pathways were related to neuronal activity, estrogen, and endocannabinoid signaling.
Lightskyblue4
18 pathways were identified in the Lightskyblue4 module. The pathways were related to MAPK, NMDA receptors, and mitochondrial uncoupling.
Mediumorchid
7 pathways were identified in the Mediumorchid module. The pathways were related to neuronal activity.
Mediumpurple
3 pathways were identified in the Mediumpurple module. The pathways were folate biosynthesis, metabolism of amine-derived hormones, and protein digestion and absorption.
Mediumpurple1
279 pathways were identified in the Mediumpurple1 module. The pathways were related to APC, antigen processing, cell cycle, cellular responses, cyclins, DNA, metabolism, interleukins, mitochrondria, p53, amino acid metabolism, TCA cycle, signaling, SUMOylation, and transport.
Moccasin
140 pathways were identified in the Moccasin module. The pathways were related to amino acids, adherens, cell-cell interactions, endocrine function, glycolysis, gluconeogenesis, insulin signaling, glycosphingolipid, MAPK, pantothenate and CoA biosynthesis, and platelet activation.
Orange
4 pathways were identified in the Orange module. The pathways were cushing syndrome, metabolism, PPAR signaling pathway, and renin-angiotensin system.
Orangered4
33 pathways were identified in the Orangered4 module. The pathways were related to amino acids, fatty acid metabolism, peroxisomes, protein digestion and absorption, synthesis of bile acids, and transport.
Palevioletred3
27 pathways were identified in the Palevioletred3 module. The pathways were related to B cell receptor signaling, MAPK, NOD-like receptor signaling, T cell receptor signaling, TNF signaling, TLR cascade and signaling, and osteoclast differentiation.
Pink2
2 pathways were identified in the Pink2 module. The pathways were EPH-Ephrin signaling and EPHA-mediated growth cone collapse.
Plum
1 pathway, neuroactive ligand-receptor interaction, was identified in the Plum module.
Sienna2
2 pathways were identified in the Sienna2 module. The pathways were ECM-receptor interaction and Focal adhesion.
Slateblue1
55 pathways were identified in the Slateblue1 module. The pathways were related to cell cycle, metabolism, mitochondrial metabolism, mRNA, SUMOylation, and transport.
Tan4
32 pathways were identified in the Tan4 module. The pathways were related to metabolism, mitochondrial metabolism, respiratory electron transport, oxidative phosphorylation, TCA cycle, thermogenesis, and translation.
Thistle1
117 pathways were identified in the Thistle1 module. The pathways were related to fatty acid metabolism, bile acids, chylomicron activity, complement, HDL and LDL processing, metabolism, innate immunity, platelets, plasma, urea cycle, steroid hormone biosynthesis, tyrosine catabolism and metabolism, and VLDL processing.
tdata.FPKM.sample.info <- readRDS(here("Data","20190406_RNAseq_B6_4wk_2DG_counts_phenotypes.RData"))

tdata.FPKM <- readRDS(here("Data","20190406_RNAseq_B6_4wk_2DG_counts_numeric.RData"))

log.tdata.FPKM <- log(tdata.FPKM + 1)
log.tdata.FPKM <- as.data.frame(log.tdata.FPKM)

log.tdata.FPKM.sample.info <- cbind(log.tdata.FPKM, tdata.FPKM.sample.info[,27238:27240])

log.tdata.FPKM.sample.info <- log.tdata.FPKM.sample.info %>% rownames_to_column() %>% filter(rowname != "A113") %>% column_to_rownames()

log.tdata.FPKM.subset <- log.tdata.FPKM[,colMeans(log.tdata.FPKM != 0) > 0.5]

log.tdata.FPKM.subset <- log.tdata.FPKM.subset %>% rownames_to_column() %>% filter(rowname != "A113") %>% column_to_rownames()

log.tdata.FPKM.sample.info.subset.spleen <- log.tdata.FPKM.sample.info %>% rownames_to_column() %>% filter(Tissue == "Spleen") %>% column_to_rownames()

log.tdata.FPKM.subset <- subset(log.tdata.FPKM.sample.info.subset.spleen, select = -c(Time,Treatment,Tissue))

WGCNA.pathway <-readRDS(here("Data","Spleen","Chang_B6_96hr_4wk_gprofiler_pathway_annotation_list_spleen_WGCNA.RData"))

Matched<-readRDS(here("Data","Spleen","Annotated_genes_in_spleen_WGCNA_Chang_B6_96hr_4wk.RData"))


module.names <- Matched$X..Module.
name <- str_split(module.names,"_")
samples <-c()
for(i in 1:length(name)){
samples[[i]] <- name[[i]][2]
}
name <- str_split(samples,"\"")
name <- unlist(name)

Treatment <- unclass(as.factor(log.tdata.FPKM.sample.info.subset.spleen[,27238]))
Time <- unclass(as.factor(log.tdata.FPKM.sample.info.subset.spleen[,27237]))
Treat.Time <- paste0(Treatment, Time)
phenotype <- data.frame(cbind(Treatment, Time, Treat.Time))

nSamples <- nrow(log.tdata.FPKM.sample.info.subset.spleen)

MEs0 <- read.csv(here("Data","Spleen","log.tdata.FPKM.sample.info.subset.spleen.WGCNA.module.eigens.csv"),header = T, row.names = 1)
name <- str_split(names(MEs0),"_")
samples <-c()
for(i in 1:length(name)){
samples[[i]] <- name[[i]][2]
}
name <- str_split(samples,"\"")
name <- unlist(name)
colnames(MEs0) <-name
MEs <- orderMEs(MEs0)
moduleTraitCor <- cor(MEs, phenotype, use = "p");
moduleTraitPvalue <- corPvalueStudent(moduleTraitCor, nSamples)
Relationship between Modules and Traits
#sizeGrWindow(10,6)
# Will display correlations and their p-values
textMatrix = paste(signif(moduleTraitCor, 2), "\n(",
                        signif(moduleTraitPvalue, 1), ")", sep = "");
dim(textMatrix) = dim(moduleTraitCor)

# Display the correlation values within a heatmap plot
heat <- pheatmap(moduleTraitCor, main = paste("Module-trait relationships"), display_numbers = textMatrix,color=colorRampPalette(brewer.pal(n = 11, name = "Paired"))(10), cluster_rows = F, cluster_cols = F, fontsize_number = 4, angle_col = 45, number_color = "black", border_color = "white")
heat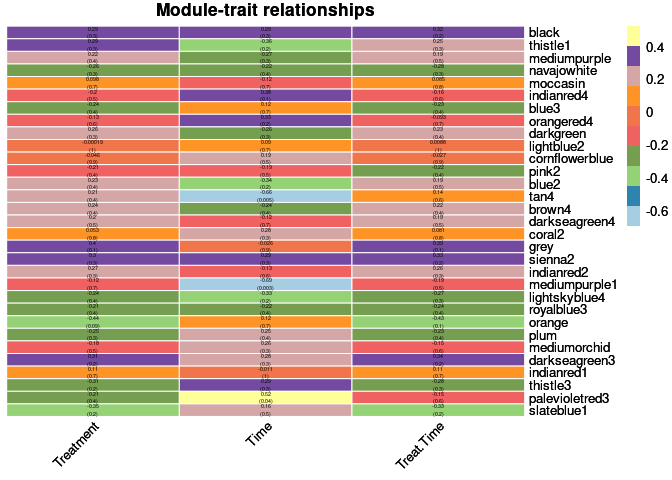
Top 10 Hub genes within each significant module
Treatment
None
Time
The top 10 genes that were significant for time within the tan4 module and had the highest correlation with tan4 were:
- Copz2
- lft80
- Map9
- Rps15
- 2810025M15Rik
- Nup153
- Sstr2
- Slc52a2
- Dynlt1f
- 2310010J17Rik
When assessing the overall sample contribution through their summary eigengenes it appears that for tan4 most 96 hr 2DG had a negative effect while half of 96 hr controls had a negative effect. All 4 wk mice, independent of treatment, had a positive effect. These effects indicate that there are some under-expressed genes for 96 hr mice and over-expressed genes for 4 wk mice.
The top 10 genes that were significant for time within the mediumpurple1 module and had the highest correlation with mediumpurple1 were:
- Gpr108
- Traf2
- Nup155
- Anxa6
- Ap3d1
- Hp1bp3
- Wdr16
- ENSMUSG00000010825
- Klhl8
- Zfp524
When assessing the overall sample contribution through their summary eigengenes it appears that for mediumpurple1 most 96 hr controls had a negative effect and 4 wk controls were half negative and half positive while all 96 hr 2DG had a negative effect and 4 wk 2DG had a mostly negative effect, indicating that there are some under-expressed genes for 96 hr, independent of treatment, and under-expressed genes for most of the 4 wk mice, independent of treatment.
The top 10 genes that were significant for time within the palevioletred3 module and had the highest correlation with palevioletred3 were:
- Gm14565
- Lrp12
- Sept5
- Klra2
- Mad2l2
- Ino80c
- ENSMUSG00000086386
- Cul2
- Mff
- Rtn4ip1
When assessing the overall sample contribution through their summary eigengenes it appears that for palevioletred3 4 week old mice, independent of treatment had half positive and half negative effects while 96 hr mice, independent of treatment, had a mostly positive effect, indicating that there are both over and under-expressed genes for 4 weeks and mostly over-expressed genes 96 hrs.
Treatment by time
None
Analysis performed by Ann Wells
The Carter Lab The Jackson Laboratory 2023
ann.wells@jax.org