Summary Small Intestine
Ann Wells
April 23, 2023
Summary
needed.packages <- c("tidyverse", "here", "functional", "gplots", "dplyr", "GeneOverlap", "R.utils", "reshape2","magrittr","data.table", "RColorBrewer","preprocessCore", "ARTool","emmeans", "phia", "gProfileR","rlist", "pheatmap", "WGCNA")
for(i in 1:length(needed.packages)){library(needed.packages[i], character.only = TRUE)}

source(here("source_files","WGCNA_source.R"))
There were 16 samples (4 per time and treatment). Mice were fed 2DG (6g/L) or nothing in their water for 96hrs or 4 weeks. WGCNA analysis was performed to determine gene clustering. A soft-thresholding power was chosen so that the scale-free topology correlation attempts to hit 0.9. The power chosen for small.intestine was 13, which allowed the correlations to hover around 0.88. This power clustered the genes into 229 modules originally, however, modules that were highly correlated (0.75 or higher) were further merged together to create 46 modules.
modules<-read.csv(here("Data","Small Intestine","log.tdata.FPKM.sample.info.subset.small.intestine.WGCNA.module.membership.csv"), header=T)

module_barplot(modules)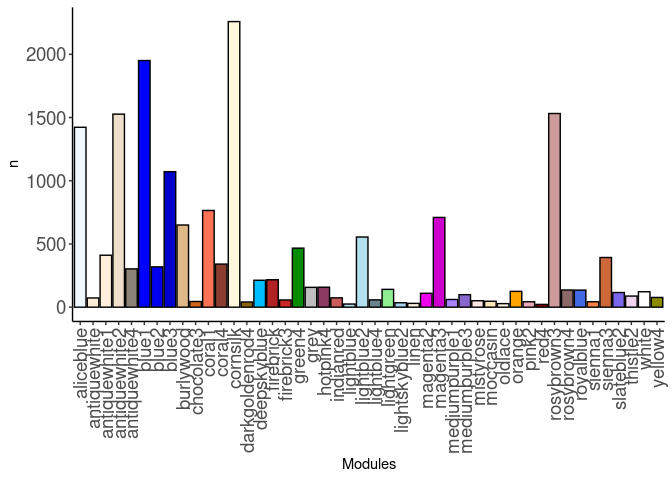
Pathways
Pathways were assessed for each module. Out of 46 modules, only 29 modules had pathway hits of any kind. The pathways that had the highest frequency across modules were cell cycle and mitotic metaphase and anaphase. The antiquewhite1, antiquewhite2, antiquewhite4, cornsilk, lightblue, lightblue4, orange, and yellow4 modules all contained these pathways.
Aliceblue
71 pathways were identified in the Aliceblue module. The pathways were related to cholesterol, fatty acid metabolism, glycolysis, gluconeogenesis, glycerophospholipids, metabolism, LDL, peroxisomes, PPAR signaling, pyruvate metabolism, sphingolipids, sulfur, and transport.
Antiquewhite
1 pathway, sulfur relay system, was identified in the Antiquwhite module.
Antiquewhite1
136 pathways were identified in the Antiquewhite1 module. The pathways were related to APC, NF-kappa B cells, cell cycle, cellular responses, DNA, metabolism, interleukin-1, mRNA, and p53.
Antiquewhite2
211 pathways were identified in the Antiquewhite2 module. The pathways were related to APC, cell cycle, interleukin-1, metabolism, mitochondrial metabolism, mRNA, oxidative phosphorylation, p53, RNA polymerase I, transcriptional regulation, TCA cycle, thermogenesis, activation of NF-kappa in B cells.
Antiquewhite4
132 pathways were identified in the Antiquewhite4 module. The pathways were related to APC, cell cycle, cellular responses, DNA, MHC I mediated antigen processing and presentation, interleukin-1, mitochondrial metabolism, insulin receptor signaling, p53, rRNA, translation, and ubiquitin.
Blue1
40 pathways were identified in the Blue1 module. The pathways were related to cell cycle, collagen, MAPK, adrenergic signaling, wnt signaling, VEGF, protein processing in the ER, and n-glycan biosynthesis.
Blue3
5 pathways were identified in the Blue3 module. The pathways were related to branched chain amino acid degradation, riboflavin metabolism, autophagy, metabolic pathways, and biosynthesis of cofactors.
Burlywood
52 pathways were identified in the Burlywood module. The pathways were related to cardiac function, axon guidance, collagen, glycogen, cAMP, platelets, MET, and ion homeostasis.
Coral1
2 pathways were identified in the Coral1 module. The pathways were glycerolipid metabolism and herpes simplex virus 1 infection.
Cornsilk
22 pathways were identified in the Cornsilk module. They pathways were related to cell cycle, SUMOylation, oxidative phosphorylation, lysine degradation, and thermogenesis.
Firebrick
2 pathways were identified in the Firebrick module. The pathways were IL-17 signaling pathway and TNF signaling pathway.
Green4
69 pathways were identified in the Green4 module. The pathways were related to adaptive immunity, cytokine signaling, DAP12, autoimmune disease, cell adhesion molecules, cytokine signaling, immunity, interleukins, natural killer cells, NOD-like receptor signaling, JAK-STAT signaling, NF-kappa B signaling, Th1 and 2 differentiation, Th17 differentiation, and TNF signaling.
Hotpink4
13 pathways were identified in the Hotpink4 module. The pathways were related to PDH, TCA cycle, FOXO-mediated transcription of cell cycle genes.
Indianred
9 pathways were identified in the Indianred module. The pathways were related to viruses and NOD-like receptor signaling pathway.
Lightblue
29 pathways were identified in the Lightblue module. The pathways were related to cell cycle, MHC II antigen presentation, RHO GTPase, and HDL remodeling.
Lightblue2
44 pathways were identified in the Lightblue2 module. The pathways were related to cellular senescence, mRNA, chromatin, cancer, and RNA.
Lightgreen
3 pathways were identified in the lightgreen module. The pathways were metabolism, PPAR signaling pathway, and regulation of lipolysis in adipocytes.
Magenta3
19 pathways were identified in the Magenta3 module. The pathways were related to insulin signaling, interleukin-6, ERK 1/2, thermogenesis, ubiquitin, growth hormone, and axon guidance.
Mistyrose
7 pathways were identified in the Mistyrose module. The pathways were related to collagen, MET, depolarization, and cardiac conduction.
Moccasin
2 pathways were identified in the Moccasin module. The pathways were ATP sensitive potassium channels and wnt signaling.
Oldlace
21 pathways were identified in the Oldlace module. The pathways were related to antigen processing and presentation, cellular responses, MAPK signaling, protein processing in the ER, estrogen, HSF1, and HSP90.
Pink2
6 pathways were identified in the Pink2 module. The pathways were Apoptosis - multiple species, Herpes simplex virus 1 infection, Human immunodeficiency virus 1 infection, Lipid and atherosclerosis, Osteoclast differentiation, and Toxoplasmosis.
Red4
1 pathway, fatty acid degradation, was identified in the Red4 module.
Rosybrown3
103 pathways were identified in the Rosybrown3 module. The pathways were related to adaptive immunity, autoimmune disease, cytokine signaling, DAP12, CD28, calcium signaling, B cell receptor, cell adhesion molecules, interleukins, innate immune system, JAK-STAT, natural killer cells, NF-kappa B, platelets, Rap1, PD-1, Th1 and 2 differentiation, Th17 differentiation, TNF, T cell receptor signaling, and VEGF.
Rosybrown4
17 pathways were identified in the Rosybrown4 module. The pathways were related to neurodegenerative diseases, oxidative phosphorylation, thermogenesis, and cardiac muscle contraction.
Royalblue
3 pathways were identified in the Royalblue module. The pathways were muscle contraction, nicotine addiction, and striated muscle contraction.
Thistle2
1 pathway, neuroactive ligand-receptor interaction, was identified in the Thistle2 module.
White
8 pathways were identified in the White module. The pathways were related to digestion, metabolic pathways, carbohydrates, and pancreatic and salivary secretion.
Yellow4
34 pathways were identified in the Yellow4 module. The pathways were related to adaptive immunity, cell cycle, DNA, MHC II antigen presentation, mTOR, and RHO GTPase.
tdata.FPKM.sample.info <- readRDS(here("Data","20190406_RNAseq_B6_4wk_2DG_counts_phenotypes.RData"))

tdata.FPKM <- readRDS(here("Data","20190406_RNAseq_B6_4wk_2DG_counts_numeric.RData"))

log.tdata.FPKM <- log(tdata.FPKM + 1)
log.tdata.FPKM <- as.data.frame(log.tdata.FPKM)

log.tdata.FPKM.sample.info <- cbind(log.tdata.FPKM, tdata.FPKM.sample.info[,27238:27240])

log.tdata.FPKM.sample.info <- log.tdata.FPKM.sample.info %>% rownames_to_column() %>% filter(rowname != "A113") %>% column_to_rownames()

log.tdata.FPKM.subset <- log.tdata.FPKM[,colMeans(log.tdata.FPKM != 0) > 0.5]

log.tdata.FPKM.subset <- log.tdata.FPKM.subset %>% rownames_to_column() %>% filter(rowname != "A113") %>% column_to_rownames()

log.tdata.FPKM.sample.info.subset.small.intestine <- log.tdata.FPKM.sample.info %>% rownames_to_column() %>% filter(Tissue == "Small Intestine") %>% column_to_rownames()

log.tdata.FPKM.subset <- subset(log.tdata.FPKM.sample.info.subset.small.intestine, select = -c(Time,Treatment,Tissue))

WGCNA.pathway <-readRDS(here("Data","Small Intestine","Chang_B6_96hr_4wk_gprofiler_pathway_annotation_list_small_intestine_WGCNA.RData"))

Matched<-readRDS(here("Data","Small Intestine","Annotated_genes_in_small_intestine_WGCNA_Chang_B6_96hr_4wk.RData"))


module.names <- Matched$X..Module.
name <- str_split(module.names,"_")
samples <-c()
for(i in 1:length(name)){
samples[[i]] <- name[[i]][2]
}
name <- str_split(samples,"\"")
name <- unlist(name)

Treatment <- unclass(as.factor(log.tdata.FPKM.sample.info.subset.small.intestine[,27238]))
Time <- unclass(as.factor(log.tdata.FPKM.sample.info.subset.small.intestine[,27237]))
Treat.Time <- paste0(Treatment, Time)
phenotype <- data.frame(cbind(Treatment, Time, Treat.Time))

nSamples <- nrow(log.tdata.FPKM.sample.info.subset.small.intestine)

MEs0 <- read.csv(here("Data","Small Intestine","log.tdata.FPKM.sample.info.subset.small.intestine.WGCNA.module.eigens.csv"),header = T, row.names = 1)
name <- str_split(names(MEs0),"_")
samples <-c()
for(i in 1:length(name)){
samples[[i]] <- name[[i]][2]
}
name <- str_split(samples,"\"")
name <- unlist(name)
colnames(MEs0) <-name
MEs <- orderMEs(MEs0)
moduleTraitCor <- cor(MEs, phenotype, use = "p");
moduleTraitPvalue <- corPvalueStudent(moduleTraitCor, nSamples)
Relationship between Modules and Traits
#sizeGrWindow(10,6)
# Will display correlations and their p-values
textMatrix = paste(signif(moduleTraitCor, 2), "\n(",
                        signif(moduleTraitPvalue, 1), ")", sep = "");
dim(textMatrix) = dim(moduleTraitCor)

# Display the correlation values within a heatmap plot
heat <- pheatmap(moduleTraitCor, main = paste("Module-trait relationships"), display_numbers = textMatrix,color=colorRampPalette(brewer.pal(n = 11, name = "Paired"))(10), cluster_rows = F, cluster_cols = F, fontsize_number = 4, angle_col = 45, number_color = "black", border_color = "white")
heat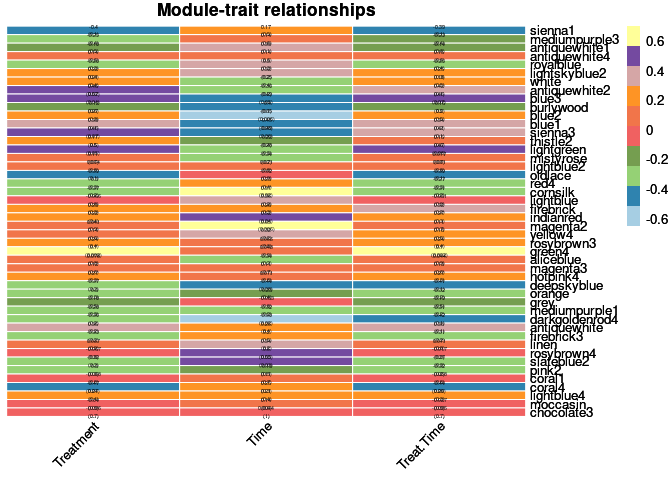
Top 10 Hub genes within each significant module
Treatment
The top 10 genes that were significant for treatment within the green4 module and had the highest correlation with green4 were:
- Prkd3
- 6546
- Gm14455
- Parp2
- Ewsr1
- Rapsn
- Asap2
- Elovl6
- Mon1b
- Pir
When assessing the overall sample contribution through their summary eigengenes it appears that for green4 most controls had a positive effect while most 2DG had a negative effect, indicating that there are some over-expressed genes for control mice and under-expressed genes 2DG treated mice.
Time
The top 10 genes that were significant for time within the blue2 module and had the highest correlation with blue2 were:
- ENSMUSG00000095863
- Serinc4
- ENSMUSG00000000617
- F9
- Ncf1
- Gsta1
- Kif13a
- Gm9967
- Stk38
- ENSMUSG00000054006
When assessing the overall sample contribution through their summary eigengenes it appears that for blue2 most 4 wk controls had a positive effect and half of the 96 hr controls had a positive effect and half had a negative effect while most 96 hr 2DG mice had a negative effect and 4 wk 2DG mice had a positive effect, indicating that there are some over-expressed genes for 4 wk mice, independent of treatment, and under-expressed genes for 96 hr 2DG treated mice.
The top 10 genes that were significant for time within the cornsilk module and had the highest correlation with cornsilk were:
- Dnah8
- Clec16a
- Slmap
- Gp1bb
- Cacna1c
- Xrcc4
- Cep78
- ENSMUSG00000030651
- ENSMUSG00000096846
- Cyp46a1
When assessing the overall sample contribution through their summary eigengenes it appears that for cornsilk most 4 wk controls had a negative effect and most 96 hr controls had a positive effect while most 2DG mice had a positive effect, independent of time point, indicating that there are under-expressed genes for 4 wk control mice, over -expressed for 96 hr control mice and over-expressed genes for 2DG treated mice, independent of time point.
The top 10 genes that were significant for time within the magenta2 module and had the highest correlation with magenta2 were:
- Ttc12
- Usp31
- ENSMUSG00000087518
- Trappc11
- ENSMUSG00000041710
- Slc36a4
- ENSMUSG00000095130
- ENSMUSG00000028008
- Cxcl1
- Stc2
When assessing the overall sample contribution through their summary eigengenes it appears that for magenta2 most 4 wk controls had a negative effect and 96 hr controls had a positive effect while most 96 hr 2DG mice had a positive effect and half of 4 wk 2DG mice had a negative effect and half had a positive effect, indicating that there are some under-expressed genes for 4 wk control mice and half of 4 wk 2DG mice and over-expressed genes for 96 hrs, independent of time point.
The top 10 genes that were significant for time within the darkgoldenrod4 module and had the highest correlation with darkgoldenrod4 were:
- 2410127l17Rik
- Fbxo30
- Spice1
- Hspb7
- Usp24
- ENSMUSG00000097421
- ENSMUSG00000070683
- Tmie
- ENSMUSG00000085975
- Gm26704
When assessing the overall sample contribution through their summary eigengenes it appears that for darkgoldenrod4 half of 4 wk controls had a positive effect and half had a negative effect. The 96 hr controls had a negative effect while most 96 hr 2DG mice had a negative effect and 4 wk 2DG mice had a positive effect, indicating that there are some over-expressed genes for 4 wk control and 2DG mice, and under-expressed genes for 96 hr, independent of time point.
Treatment by time
The top 10 genes that were significant for treatment by time within the green4 module and had the highest correlation with green4 were:
- Prkd3
- ENSMUSG00000006546
- Nfya
- Parp2
- Rapsn
- Asap2
- Elovl6
- Mon1b
- Pir
- Pm20d2
When assessing the overall sample contribution through their summary eigengenes it appears that for green4 most controls had a positive effect while most 2DG had a negative effect, independent of time, indicating that there are some over-expressed genes for control mice and under-expressed genes 2DG treated mice.
Analysis performed by Ann Wells
The Carter Lab The Jackson Laboratory 2023
ann.wells@jax.org