Summary Hippocampus
Ann Wells
April 23, 2023
Summary
needed.packages <- c("tidyverse", "here", "functional", "gplots", "dplyr", "GeneOverlap", "R.utils", "reshape2","magrittr","data.table", "RColorBrewer","preprocessCore", "ARTool","emmeans", "phia", "gProfileR","rlist", "pheatmap", "WGCNA")
for(i in 1:length(needed.packages)){library(needed.packages[i], character.only = TRUE)}

source(here("source_files","WGCNA_source.R"))
There were 16 samples (4 per time and treatment). Mice were fed 2DG (6g/L) or nothing in their water for 96hrs or 4 weeks. WGCNA analysis was performed to determine gene clustering. A soft-thresholding power was chosen so that the scale-free topology correlation attempts to hit 0.9. The power chosen for hippocampus was 13, which allowed the correlations to hover around 0.88. This power clustered the genes into 250 modules originally, however, modules that were highly correlated (0.75 or higher) were further merged together to create 45 modules.
modules<-read.csv(here("Data","Hippocampus","log.tdata.FPKM.sample.info.subset.hippocampus.WGCNA.module.membership.csv"), header=T)

module_barplot(modules)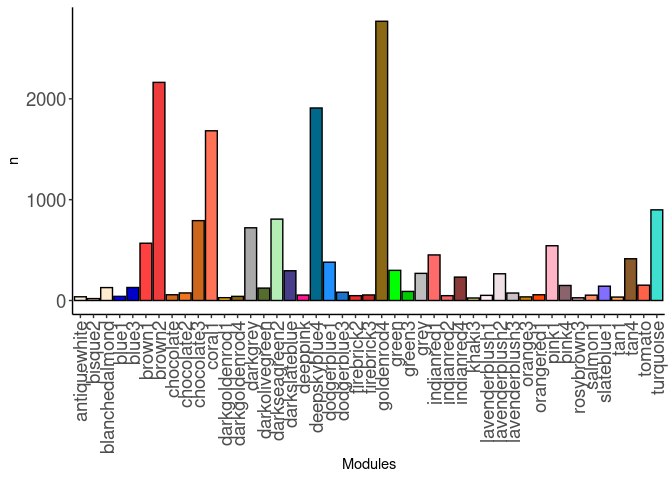
Pathways
Pathways were assessed for each module. Out of 45 modules, only 21 modules had pathway hits of any kind. The pathways that had the highest frequency across modules were general metabolism pathways, gene expression, and Huntington disease. The brown2, chocolate3, coral1, and darkgrey modules all contained these pathways.
Bisque2
11 pathways were identified for the bisque2 module. Many pathways were involved in erythrocyte health (oxygen and carbon dioxide exchange, heme biosynthesis, and scavenging of heme from plasma).
Blue3
50 pathways were identified for the blue3 module. Many pathways were involved in collagen formation and degradation, extracellular matrix processes, and autoimmune disease.
Brown2
1 pathway was identified for the brown2 module, Huntington disease.
Chocolate3
4 pathways were identified for the chocolate3 module. All the pathways involved metabolism, particularly fatty acid metabolism.
Coral1
9 pathways were identified for the coral1 module. Pathways identified had to do with RNA, metabolism, amino acid biosynthesis, Huntington and Parkinson disease, and oxidative phosphorylation.
Darkgoldenrod4
1 pathway was identified for the darkgoldenrod4 module, metabolism of angiotensinogen to angiotensins.
Darkgrey
2 pathways were identified for the darkgrey module. Both were related to transcription.
Darkseagreen2
1 pathway was identified for the darkseagreen2 module, herpes simplex virus 1 infection.
Darkslateblue
3 pathways were identified for the darkslateblue module. All three pathways were digestion related.
Deepskyblue4
There were 112 pathways identified for the deepskyblue module. The pathways identified were involved in cell cycle, IL-1, mitochondrial processing, mRNA, cancer pathways, and RNA polymerase II.
Dodgerblue1
2 pathways were identified for the dodgerblue1 module. Focal adhesion and glycosaminoglycan degradation were identified.
Goldenrod4
55 pathways were identified for the goldenrod4 module. Pathways involved in neuroregulation were identified.
Green
18 pathways were identified for the green module. The pathways identified were involved in various aspects of the immune system, autoimmune disease (lupus), and osteoclast differentiation.
Indianred
1 pathway was identified for the indianred module, serotonergic synapse.
Indianred2
12 pathways were identified for the indianred2 module. The pathways identified were involved in fatty acid metabolism, drug metabolism, pentose and glucuronate interconversions, and steroid biosynthesis.
Indianred4
1 pathway was identified for the indianred4 module, herpes simplex virus 1 infection.
Lavenderblush1
5 pathways were identified for the lavenderblush1 module. The pathways identified were involved in amino acid transport.
Lavenderblush2
1 pathway was identified for the lavenderblush2 module, calcium signaling pathway.
Pink4
1 pathway was identified for the pink4 module, calcium signaling pathway.
Tan4
1 pathway was identified for the tan4 module, hippo signaling pathway - multiple species.
Turquoise
11 pathways were identified for the turquoise module. The pathways identified were involved in collagen formation, tight juncture pathways, and transport of small molecules.
Modules, Traits, Genes, and Sample Effects
When looking at the relationship between modules and traits, treatment and treatment by time were highly positively correlated with the coral1, darkslateblue, darkolivegreen, and blue1 modules and highly negatively correlated with the green module. Time was highly positively correlated the khaki3 module.
tdata.FPKM.sample.info <- readRDS(here("Data","20190406_RNAseq_B6_4wk_2DG_counts_phenotypes.RData"))

tdata.FPKM <- readRDS(here("Data","20190406_RNAseq_B6_4wk_2DG_counts_numeric.RData"))

log.tdata.FPKM <- log(tdata.FPKM + 1)
log.tdata.FPKM <- as.data.frame(log.tdata.FPKM)

log.tdata.FPKM.sample.info <- cbind(log.tdata.FPKM, tdata.FPKM.sample.info[,27238:27240])

log.tdata.FPKM.sample.info <- log.tdata.FPKM.sample.info %>% rownames_to_column() %>% filter(rowname != "A113") %>% column_to_rownames()

log.tdata.FPKM.subset <- log.tdata.FPKM[,colMeans(log.tdata.FPKM != 0) > 0.5]

log.tdata.FPKM.subset <- log.tdata.FPKM.subset %>% rownames_to_column() %>% filter(rowname != "A113") %>% column_to_rownames()

log.tdata.FPKM.sample.info.subset.hippocampus <- log.tdata.FPKM.sample.info %>% rownames_to_column() %>% filter(Tissue == "Hippocampus") %>% column_to_rownames()

log.tdata.FPKM.subset <- subset(log.tdata.FPKM.sample.info.subset.hippocampus, select = -c(Time,Treatment,Tissue))

WGCNA.pathway <-readRDS(here("Data","Hippocampus","Chang_B6_96hr_4wk_gprofiler_pathway_annotation_list_hippocampus_WGCNA.RData"))

Matched<-readRDS(here("Data","Hippocampus","Annotated_genes_in_hippocampus_WGCNA_Chang_B6_96hr_4wk.RData"))


module.names <- Matched$X..Module.
name <- str_split(module.names,"_")
samples <-c()
for(i in 1:length(name)){
samples[[i]] <- name[[i]][2]
}
name <- str_split(samples,"\"")
name <- unlist(name)

Treatment <- unclass(as.factor(log.tdata.FPKM.sample.info.subset.hippocampus[,27238]))
Time <- unclass(as.factor(log.tdata.FPKM.sample.info.subset.hippocampus[,27237]))
Treat.Time <- paste0(Treatment, Time)
phenotype <- data.frame(cbind(Treatment, Time, Treat.Time))

nSamples <- nrow(log.tdata.FPKM.sample.info.subset.hippocampus)

MEs0 <- read.csv(here("Data","Hippocampus","log.tdata.FPKM.sample.info.subset.hippocampus.WGCNA.module.eigens.csv"),header = T, row.names = 1)
name <- str_split(names(MEs0),"_")
samples <-c()
for(i in 1:length(name)){
samples[[i]] <- name[[i]][2]
}
name <- str_split(samples,"\"")
name <- unlist(name)
colnames(MEs0) <-name
MEs <- orderMEs(MEs0)
moduleTraitCor <- cor(MEs, phenotype, use = "p");
moduleTraitPvalue <- corPvalueStudent(moduleTraitCor, nSamples)
Relationship between Modules and Traits
#sizeGrWindow(10,6)
# Will display correlations and their p-values
textMatrix = paste(signif(moduleTraitCor, 2), "\n(",
                        signif(moduleTraitPvalue, 1), ")", sep = "");
dim(textMatrix) = dim(moduleTraitCor)

# Display the correlation values within a heatmap plot
heat <- pheatmap(moduleTraitCor, main = paste("Module-trait relationships"), display_numbers = textMatrix,color=colorRampPalette(brewer.pal(n = 11, name = "Paired"))(10), cluster_rows = F, cluster_cols = F, fontsize_number = 4, angle_col = 45, number_color = "black", border_color = "white")
heat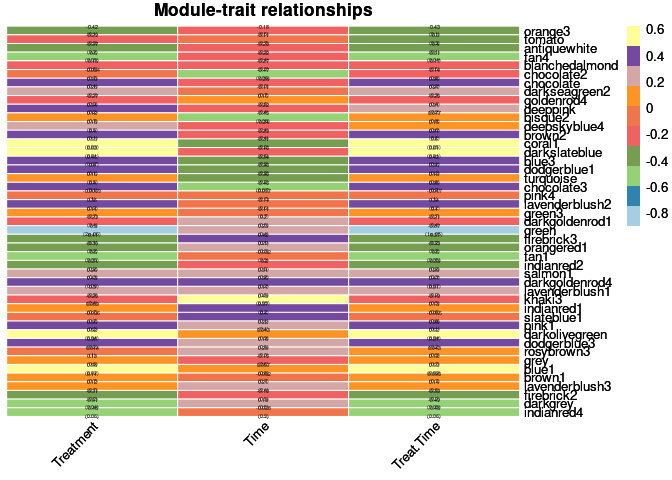
Top 10 Hub genes within each significant module
Treatment
The top 10 genes that were significant for treatment within the coral1 module and had the highest correlation with coral1 were:
- Vps9d1
- Polr3k
- 9930104L06Rik
- Tbl1x
- Gtpbp4
- Plekha5
- Il10ra
- Ncs1
- Lrrtm3
- Psph
When assessing the overall sample contribution through their summary eigengenes it appears that for coral1 most controls had a positive effect while most 2DG had a negative effect, indicating that there are many under-expressed genes for control mice and over-expressed genes 2DG treated mice.
The top 10 genes that were significant for treatment within the darkslateblue module and had the highest correlation with darkslateblue were:
- Met
- Aldh1a1
- ENSMUSG00000097903
- A330050B17Rik
- Fblim1
- Gm12445
- ENSMUSG00000081483
- ENSMUSG00000031682
- Gria4
- Lrrc2
When assessing the overall sample contribution through their summary eigengenes it appears that for darkslateblue most controls had a positive effect while most 2DG had a negative effect, indicating that there are many under-expressed genes for control mice and over-expressed genes 2DG treated mice.
The top 10 genes that were significant for treatment within the green module and had the highest correlation with green were:
- 2010001M06Rik
- Gm16083
- ENSMUSG00000019867
- Mt2
- Pabpc1l
- Ly6e
- Cyb5
- ENSMUSG00000096980
- Paqr7
- Tubgcp5
When assessing the overall sample contribution through their summary eigengenes it appears that for green most controls had a negative effect while most 2DG had a positive effect, indicating that there are many under-expressed genes for control mice and over-expressed genes 2DG treated mice.
The top 10 genes that were significant for treatment within the darkolivegreen module and had the highest correlation with darkolivegreen were:
- Cmtr1
- Gng3
- Ap1m1
- ENSMUSG00000094828
- Mep1b
- Ywhag
- Cd9
- Smarcal1
- ENSMUSG00000096393
- Qpct
When assessing the overall sample contribution through their summary eigengenes it appears that for darkolivegreen most controls had a positive effect while most 2DG had a negative effect, indicating that there are many under-expressed genes for control mice and over-expressed genes 2DG treated mice.
The top 10 genes that were significant for treatment within the blue1 module and had the highest correlation with blue1 were:
- E130102H24Rik
- Fbxl18
- Dzip1l
- Ap4e1
- Syne4
- Psme4
- Kcnmb1
- Galnt16
- Actb
- Lmo1
When assessing the overall sample contribution through their summary eigengenes it appears that for blue1 most controls had a positive effect while most 2DG had a negative effect, indicating that there are many under-expressed genes for control mice and over-expressed genes 2DG treated mice.
Time
The top 10 genes that were significant for time within the khaki3 module and had the highest correlation with khaki3 were:
- ENSMUSG00000096963
- Tmem18
- ENSMUSG00000083993
- Litaf
- ENSMUSG00000009114
- ENSMUSG00000044243
- Bicd2
- Alms1
- Adamts13
- Tgfb1
When assessing the overall sample contribution through their summary eigengenes it appears that for khaki3 most 96 hr samples had a positive effect while most 4 wk samples had a negative effect, indicating that there are many under-expressed genes for control mice and over-expressed genes 2DG treated mice.
Treatment by time
The top 10 genes that were significant for treatment by time within the coral1 module and had the highest correlation with coral1 were:
- Rab7l1
- Nfil3
- Sephs1
- Vps9d1
- Tmsb4x
- 9930104L06Rik
- Tbl1x
- Tbpl1
- Gtpbp4
- Cnnm1
When assessing the overall sample contribution through their summary eigengenes it appears that for coral1 most controls had a positive effect while most 2DG had a negative effect, regardless of time point, indicating that there are many under-expressed genes for control mice and over-expressed genes 2DG treated mice.
The top 10 genes that were significant for treatment by time within the darkslateblue module and had the highest correlation with darkslateblue were:
- Met
- Aldh1a1
- ENSMUSG00000097903
- ENSMUSG00000097142
- A330050B17Rik
- 9030025P20Rik
- Fblim1
- Gm12445
- Nus1
- Gm15912
When assessing the overall sample contribution through their summary eigengenes it appears that for darkslateblue most controls had a positive effect while most 2DG had a negative effect, regardless of time point, indicating that there are many under-expressed genes for control mice and over-expressed genes 2DG treated mice.
The top 10 genes that were significant for treatment by time within the green module and had the highest correlation with green were:
- Rbm45
- 2010001M06Rik
- Gm16083
- Trp72
- ENSMUSG00000019867
- ENSMUSG00000084249
- Mt2
- Bok
- Pabpc1l
- Ly6e
When assessing the overall sample contribution through their summary eigengenes it appears that for green most controls had a negative effect while most 2DG had a positive effect, regardless of time point, indicating that there are many under-expressed genes for control mice and over-expressed genes 2DG treated mice.
The top 10 genes that were significant for treatment by time within the darkolivegreen module and had the highest correlation with darkolivegreen were:
- Gng3
- Ap1m1
- ENSMUSG00000094828
- Mep1b
- Ywhag
- Cd9
- ENSMUSG00000096393
- Smarcal1
- Qpct
- Slc19a3
When assessing the overall sample contribution through their summary eigengenes it appears that for darkolivegreen most controls had a positive effect while most 2DG had a negative effect, regardless of time point, indicating that there are many under-expressed genes for control mice and over-expressed genes 2DG treated mice.
The top 10 genes that were significant for treatment by time within the blue1 module and had the highest correlation with blue1 were:
- E130102H24Rik
- Dzip1l
- Ap4e1
- Rcan1
- Syne4
- Psme4
- Kcnmb1
- 5830418K08Rik
- H2afx
- Galnt16
When assessing the overall sample contribution through their summary eigengenes it appears that for blue1 most controls had a positive effect while most 2DG had a negative effect, regardless of time point, indicating that there are many under-expressed genes for control mice and over-expressed genes 2DG treated mice.
Analysis performed by Ann Wells
The Carter Lab The Jackson Laboratory 2023
ann.wells@jax.org